
Candles represent participants’ actions during any specific period. Many traders seek potential trading positions by following candlestick patterns besides observing some technical and fundamental outlooks of financial assets.
For example, price action traders always consider candle formations to conduct their analysis. The Three Black Crows candlestick pattern is a popular pattern among market participants.
However, trading with any pattern involves learning the complete formation and trading techniques using that pattern. This article will introduce the Three Black Crows candlestick pattern. Moreover, we list the top pros and cons besides explaining trading strategies with chart attachments.
What is the Three Black Crows’ pattern?
It is formed by three bearish candles, signaling a possible upcoming downward price movement. This pattern is fully potential when it takes place at the ending of an uptrend. The Three Black Crows pattern is the exact opposite of the Three White Soldiers.
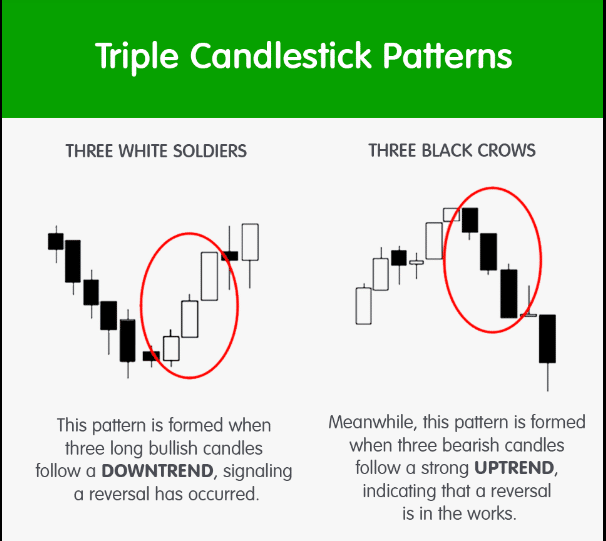
The first candle occurs after a bullish trend; the opening of the second candle is near the closing of the first candle.
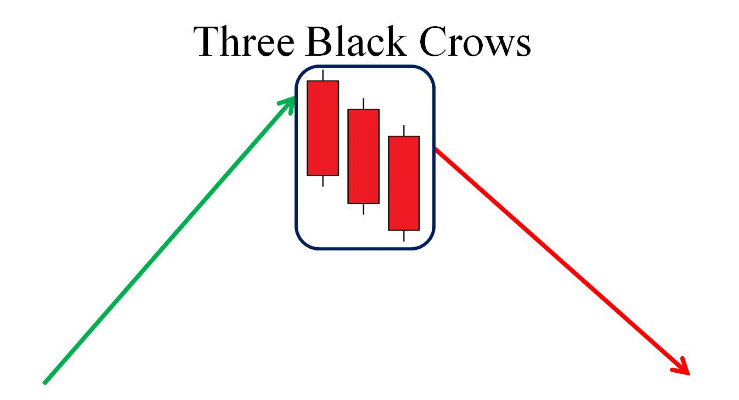
The close of the second candle will be below the last closing price. The third candle is similar to the second candle; the closing price will be below the opening. This pattern has historically many conditions, such as candles will be a complete bearish candle with no or negligible wicks. Those days are gone now; three bearish candles in a row define the market context sufficient to predict future movements.
How to trade using the Three Black Crows pattern
You already know this pattern potentially is higher near resistance levels or where an uptrend ends. Two types of consequences occur after this pattern: either price remains on a sideways trend, or the price starts declining, and a downtrend occurs. So it is better to confirm the market context by combining this pattern info with other technical indicators or tools to determine more accurate entry/exit positions.
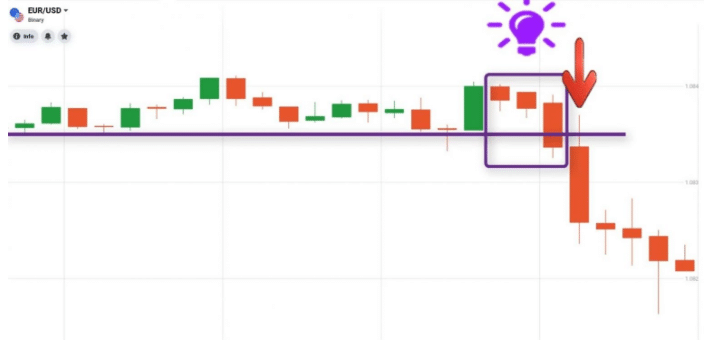
For example, you can wait till the current support level breaks below after the candlestick pattern formation before making entry. The breakout of that support level will confirm making a sell order on the target asset. Otherwise, you can combine momentum, trend, or volume indicator readings besides other technical tools, such as trendline, Fibonacci retracements, etc., to obtain precious trading positions.
A short-term trading strategy
We use support resistance levels to determine trading positions in our short-term trading strategy. We seek to make short term-positions using 15-min or hourly charts suitable for this trading technique to conduct analysis and execute trades.
This trading method involves multi time frame analysis to determine precious trading positions.
First, mark the support resistance levels and other vital levels from upper time frame charts such as weekly, monthly opening-high-low-closing, historical levels, price action levels, etc. Seek entry positions at lower time frame charts. This trading technique also includes using another popular momentum indicator, the ADX, to confirm trend strength before entering the market.
Bullish trade scenario
You have to seek Three White Soldiers near the end of a downtrend for buying opportunities. When the pattern takes place, seek if it breaks any dynamic support resistance level while completing the formation. A valid breakout that occurs above signals a possible upcoming bullish price movement.
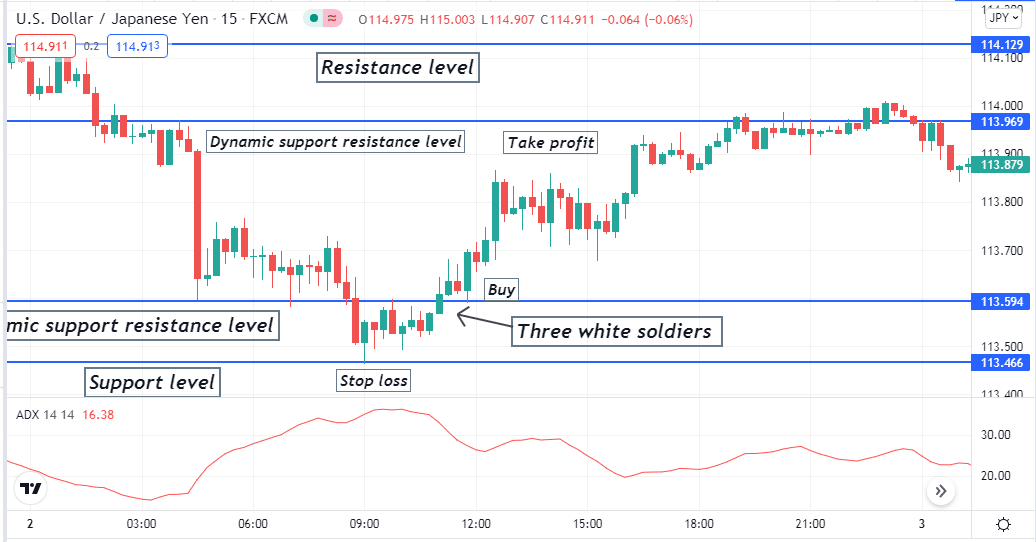
Entry
Enter a buy order when:
- Price breaks above any support resistance or any critical level of upper time frames during the Three White Soldier pattern formations.
- The ADX value is above 20, and the dynamic line is heading more upside.
Stop loss
Place an initial SL below the current swing low with a buffer of 5-10pips.
Take profit
The initial profit target of your buy order will be below the recent resistance or any vital level of upper time frames. Otherwise, you can close the buy order manually when the ADX value drops below 20, which indicates reducing the strength of the current bullish trend.
Bearish trade scenario
For selling opportunities, you have to seek Three Black Crows near the ending of an uptrend. When the pattern takes place, seek if it breaks any dynamic support resistance level while completing the formation. If a valid breakout occurs at the downside, then it signals a possible upcoming bearish price movement.
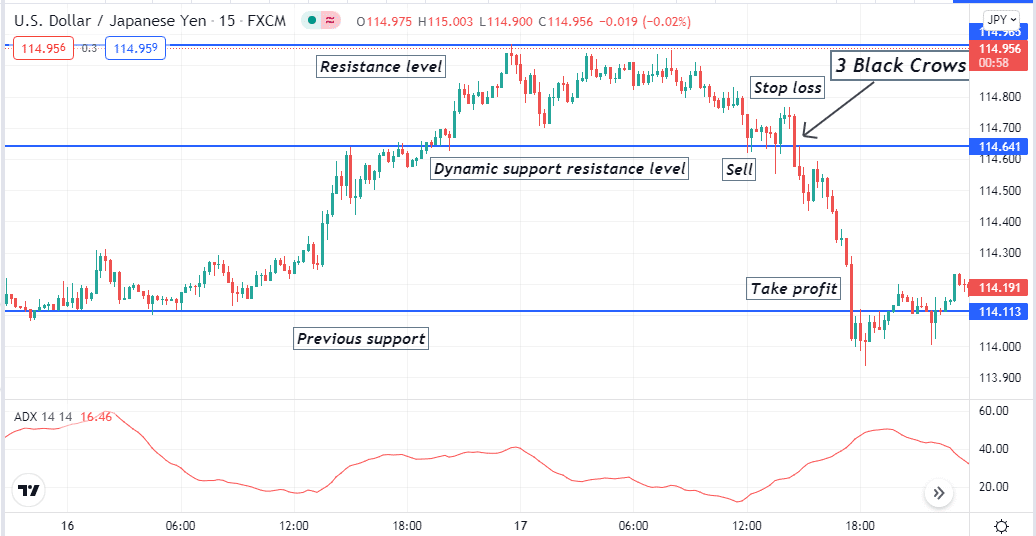
Entry
Enter a sell order when:
- Price breaks below any support resistance or any critical level of upper time frames during the Three Black Crows pattern formations.
- The ADX value is above 20, and the dynamic line is heading more upside.
Stop loss
Place an initial SL above the current swing high with a buffer of 5-10pips.
Take profit
The initial profit target of your sell order will be above the recent support or any vital level of upper time frames. Otherwise, you can close the sell order manually when the ADX value drops below 20, which indicates reducing the strength of the current bearish trend.
A long-term trading strategy
Our long-term trading method involves using a popular momentum indicator, the MACD, besides these candlestick patterns. This strategy suits any time frame we recommend using H4 or above time frame charts to obtain satisfactory long-term trading positions.
Bullish trade scenario
Seek the Three White Soldier pattern near ending on a downtrend. When marking it at your target asset chart, observe the MACD indicator window:
- The dynamic blue line crosses above the dynamic red line.
- Green histogram bars take place above the central line.
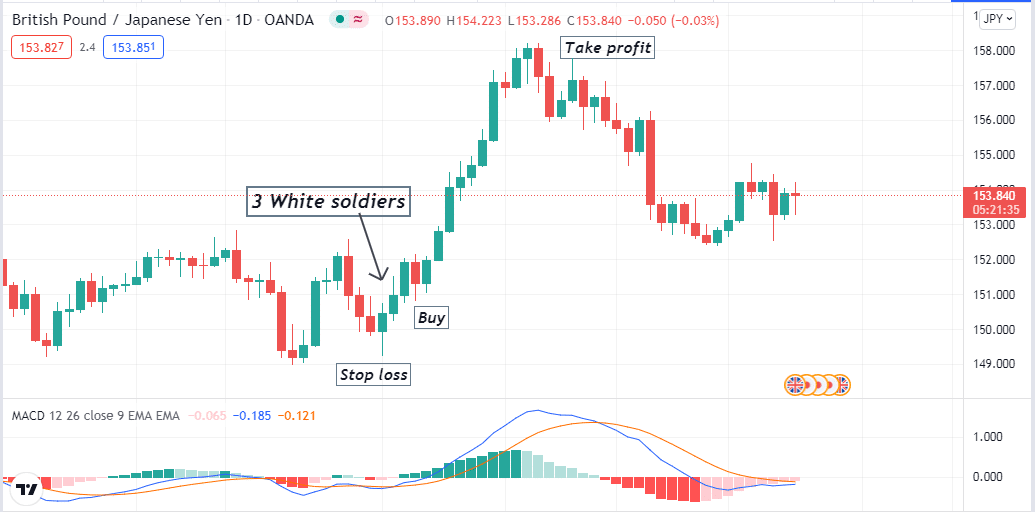
Entry
When these conditions above match with your target asset chart, place a buy order.
Stop loss
Place an initial SL for your buy order below the current swing low.
Take profit
Close the buy order when:
- The dynamic blue line crosses below the dynamic red line.
- Red histogram bars take place below the central line.
Bearish trade scenario
Seek the Three Black Crows pattern near ending on an uptrend. When marking it at your target asset chart, observe the MACD indicator window:
- The dynamic blue line crosses below the dynamic red line.
- Red histogram bars take place below the central line.
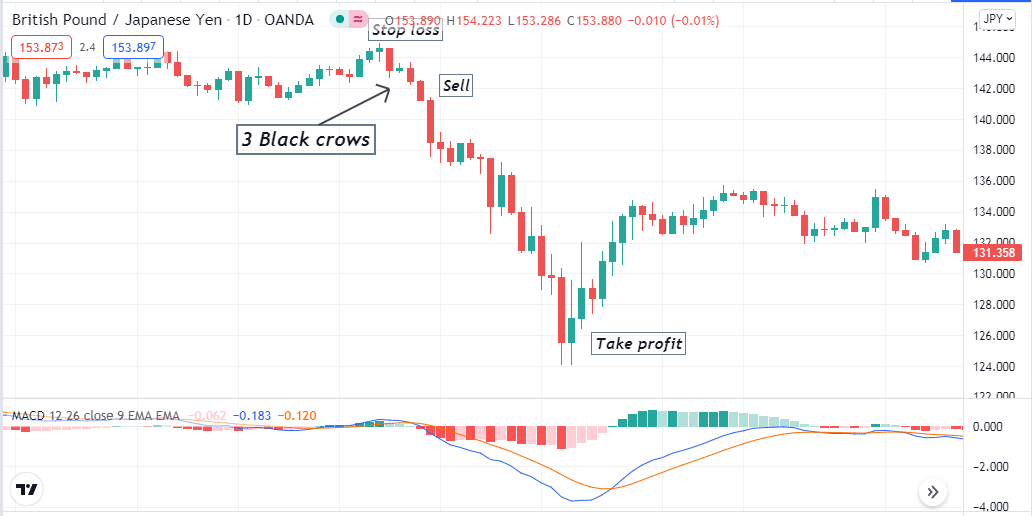
Entry
When these conditions above match your target asset chart, place a sell order.
Stop loss
Place an initial SL for your sell order above the current swing high.
Take profit
Close the sell order when:
- The dynamic blue line crosses above the dynamic red line.
- Green histogram bars take place above the central line.
Pros and cons of the pattern
| Pros | Cons |
| It applies to any trading assets. | It requires using other technical tools and indicators to create a complete strategy using this pattern. |
| You can make both long-term and short-term trading positions using it. | It can fail due to fundamental reasons. |
| Identification of this pattern is easy. | Requires specific skills and timing to execute trades using this pattern. |
Final thought
This pattern is a potential tool to execute profitable trades. We suggest combining the pattern formation with other technical and fundamental market contexts to determine the precious trading positions. Some practicing in demo charts will enable you to understand the potentiality and limitations of this pattern.