
Since its introduction, candlestick patterns have become a choosable method for market participants making trade decisions. Learning to read the candle formations enables executing the most successful trades. The Rising Three pattern is an invincible candlestick formation to catch potential profit.
However, there is no alternative to learn the formation and investors’ behavior on any pattern formation before choosing that pattern to make trade decisions. The following section will reveal trading strategies using this pattern with chart attachments.
What is the Rising Three pattern?
It is a multi candle formation of price candles that signals a continuation of the bullish trend of price movements.
This pattern contains a total of five candles to complete the entire formation, which is the exact opposite of the falling three candlestick pattern. You can identify this candle formation on an uptrend while price creates a minor retracement. The first candle will be a bullish green candle.
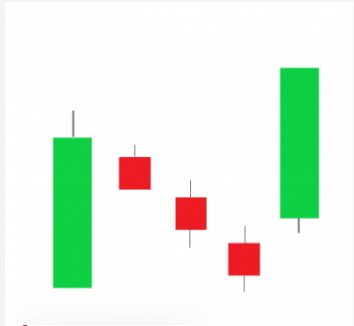
Meanwhile, the following three candles will be bearish or red, usually smaller than the first candle of this pattern. The fifth candle of this pattern will be another bullish candle that will be close above all other candles. Traders call all these candles together as a Rising Three pattern.
How to trade using the Rising Three pattern?
When you want to trade using any pattern, it requires learning the footprint.
- The first candle is bullish that represents sufficient bullish pressure on the asset price.
- The following three candles declare that the bullish pressure fades, and a little push on buying may enable sellers to enter the market that holds the price before increasing more.
- In the last candle, the buying pressure resumes, and the price rises more upward.
Trade executions can take place using this pattern by following some simple steps.
Step one
In the first step, confirm the current trend is bullish by using many trading indicators or other processes.
Step two
In the next step, mark the Rising Three patterns. Wait till the entire pattern completes formation.
Step three
When the pattern finishes, place a buy order. You can use many supportive indicators to determine the trend and buy order level.
Step four
Close the open buy position when the bullish pressure ends. Implement proper trade and money management ideas.
When you determine the most accurate entry/exit positions, many trading indicators can be useful to combine with this pattern, such as RSI, MACD, ADX, Parabolic SAR, etc., to determine the most accurate entry/exit positions.
A short-term trading strategy
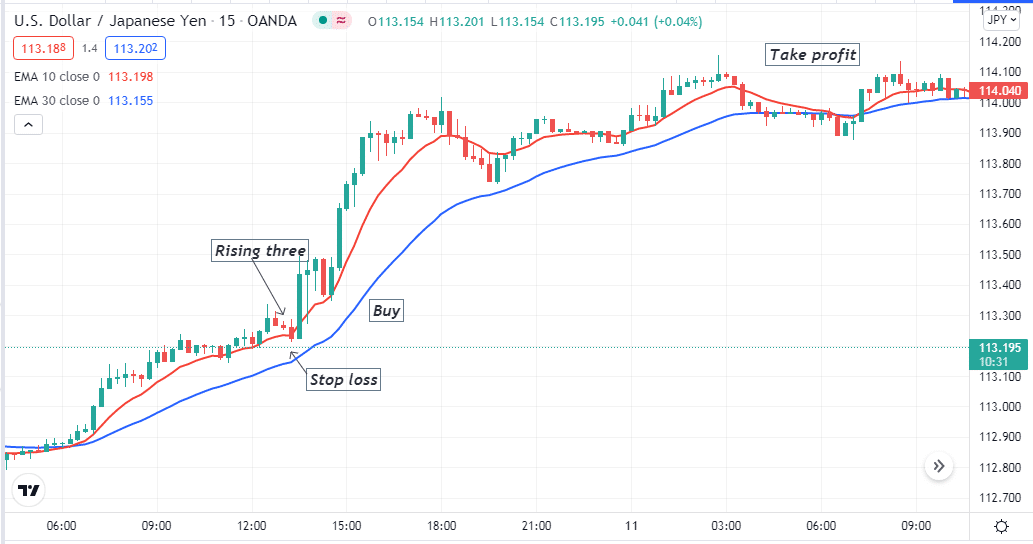
We use the EMA crossover technique to determine trends and sort out entry/exit positions of executing trades in our short-term trading method. We use 10 (red) and 30 (blue) lines.
When the red EMA crosses above the blue line on the upside, it declares the price remains on a bullish trend, and the exact opposite crossover declares the current trend shifts to be bearish. The technique is simple to determine the current trends and seek patterns to form open positions according to the market context. The 15-min chart is preferable to catch potential short-term trading positions.
Entry
Apply EMA lines, then observe the bullish crossover between these lines to seek the Rising Three patterns. Place a buy order after the pattern completes formation.
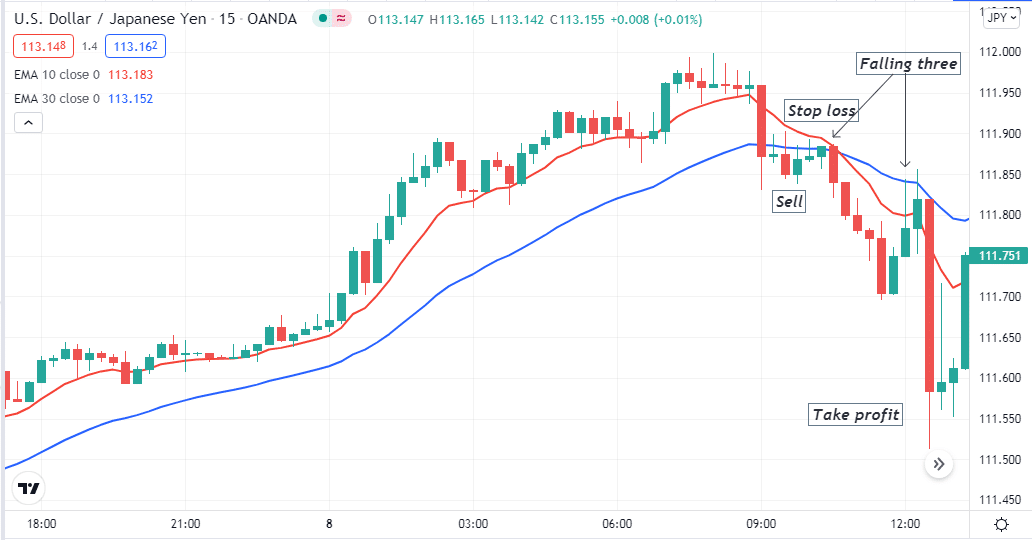
Meanwhile, open a sell order when the Falling three pattern takes place on a downward trend. In this case, the red line will be below the blue line.
Stop loss
The initial SL will be below the current swing low for the buy order. On the other hand, it will be above the recent swing high level when you open a sell order.
Take profit
The profit-taking depends on the market context. Continue your open positions till the current trend remains intact. Close your positions when the trend strength fades, or the price movement starts to make an inverse movement against your trade direction.
A long-term trading strategy
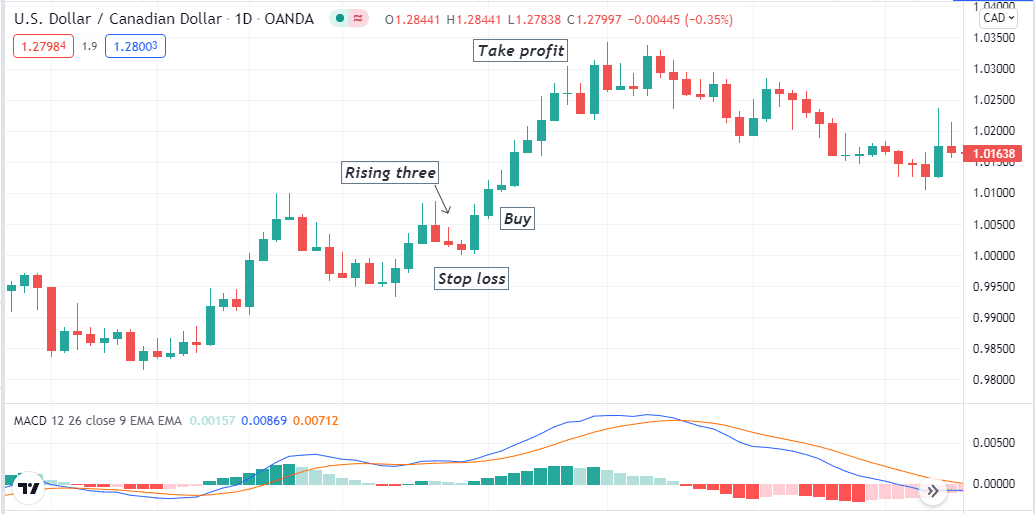
In our long-term trading method, we use a popular momentum indicator, the MACD, besides multi candles pattern formations. This trading method applies to any trading instruments on any time frame chart. We recommend using an H4 or daily chart to obtain satisfactory results to catch most potential long-term trades that you can hold for days or even weeks.
Entry
Enter a buy trade when the Rising Three pattern completes formation. Meanwhile, the dynamic blue line will cross the dynamic red line on the upside, and MACD green histogram bars will take place above the central line.
Conversely, on a downtrend, the dynamic blue line will cross the dynamic red line on the downside, and MACD red histogram bars will take place below the central line. Place a sell order after the falling three pattern completes formation.
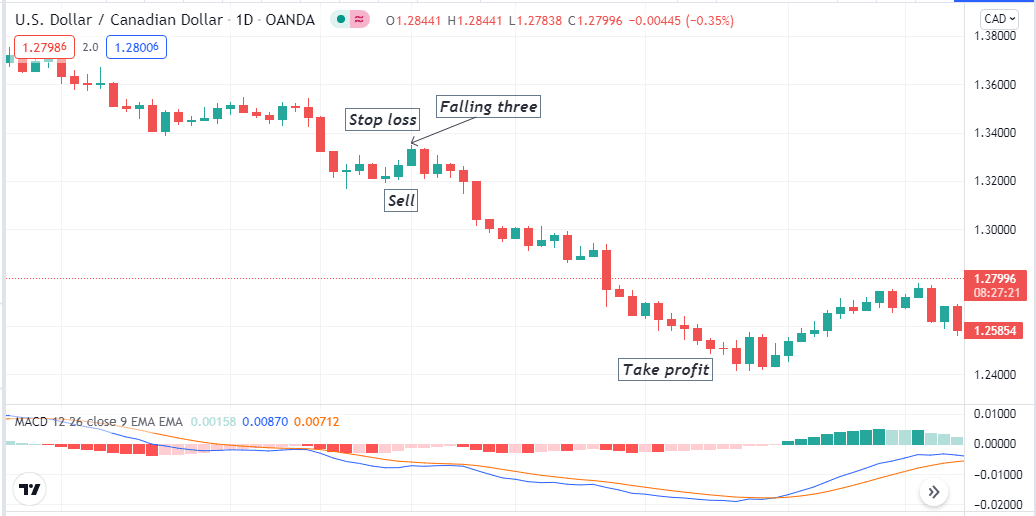
Stop loss
The SL level will be above or below the current swing levels of executing orders. It will be below the recent swing low for a buy order and above the current swing high for a sell order.
Take profit
When the market context suggests an opposite force against your order directions, close your open positions. Exit from buy trades when the current bullish trend ends or lose strengths and vice versa for sell positions.
Pros and cons of the pattern
| Pros | Cons |
| Allow making positions on the trend direction. | It is unable to suggest entry/exit points of any trade. |
| It applies to many trading assets. | Requires using other indicators or supports to trade using it. |
| It supports price action methods. | It can fail due to fundamental reasons. |
Final thought
Finally, this article introduces you to one of the most potential multi candle patterns in the financial market. You can use these trading methods above to execute successful trades on any trading instruments if you use them wisely. For short-term trading, we recommend choosing trading assets with sufficient volatility.