
If you are looking to grab profits from any crypto investment, there is no way to ignore the price pattern. You cannot buy the instrument from a random place. The best place to buy is the bottom, and you need to know where the bottom is and how to find it.
The buy from support and sell from resistance is the primary intention, but for cryptocurrencies, the excessive volatility might violate some rules. Moreover, you might have to HODL the asset by carrying losses before getting the actual profit.
If you are intended to eliminate the HODLing time and want to see the price moving towards your desired direction, you must know how to find the bottom. The following section will uncover everything about the crypto bottom strategy, including the exact way to take buy and sell trades.
What is the crypto bottom patterns strategy?
A crypto bottom strategy is a systematic approach to buying a token from the bottom and grabbing the full juice of a buy trend. This method includes using the price action and indicators to eliminate the unwanted false signals. Moreover, traders should know trends and project the aim of a token to increase accuracy.
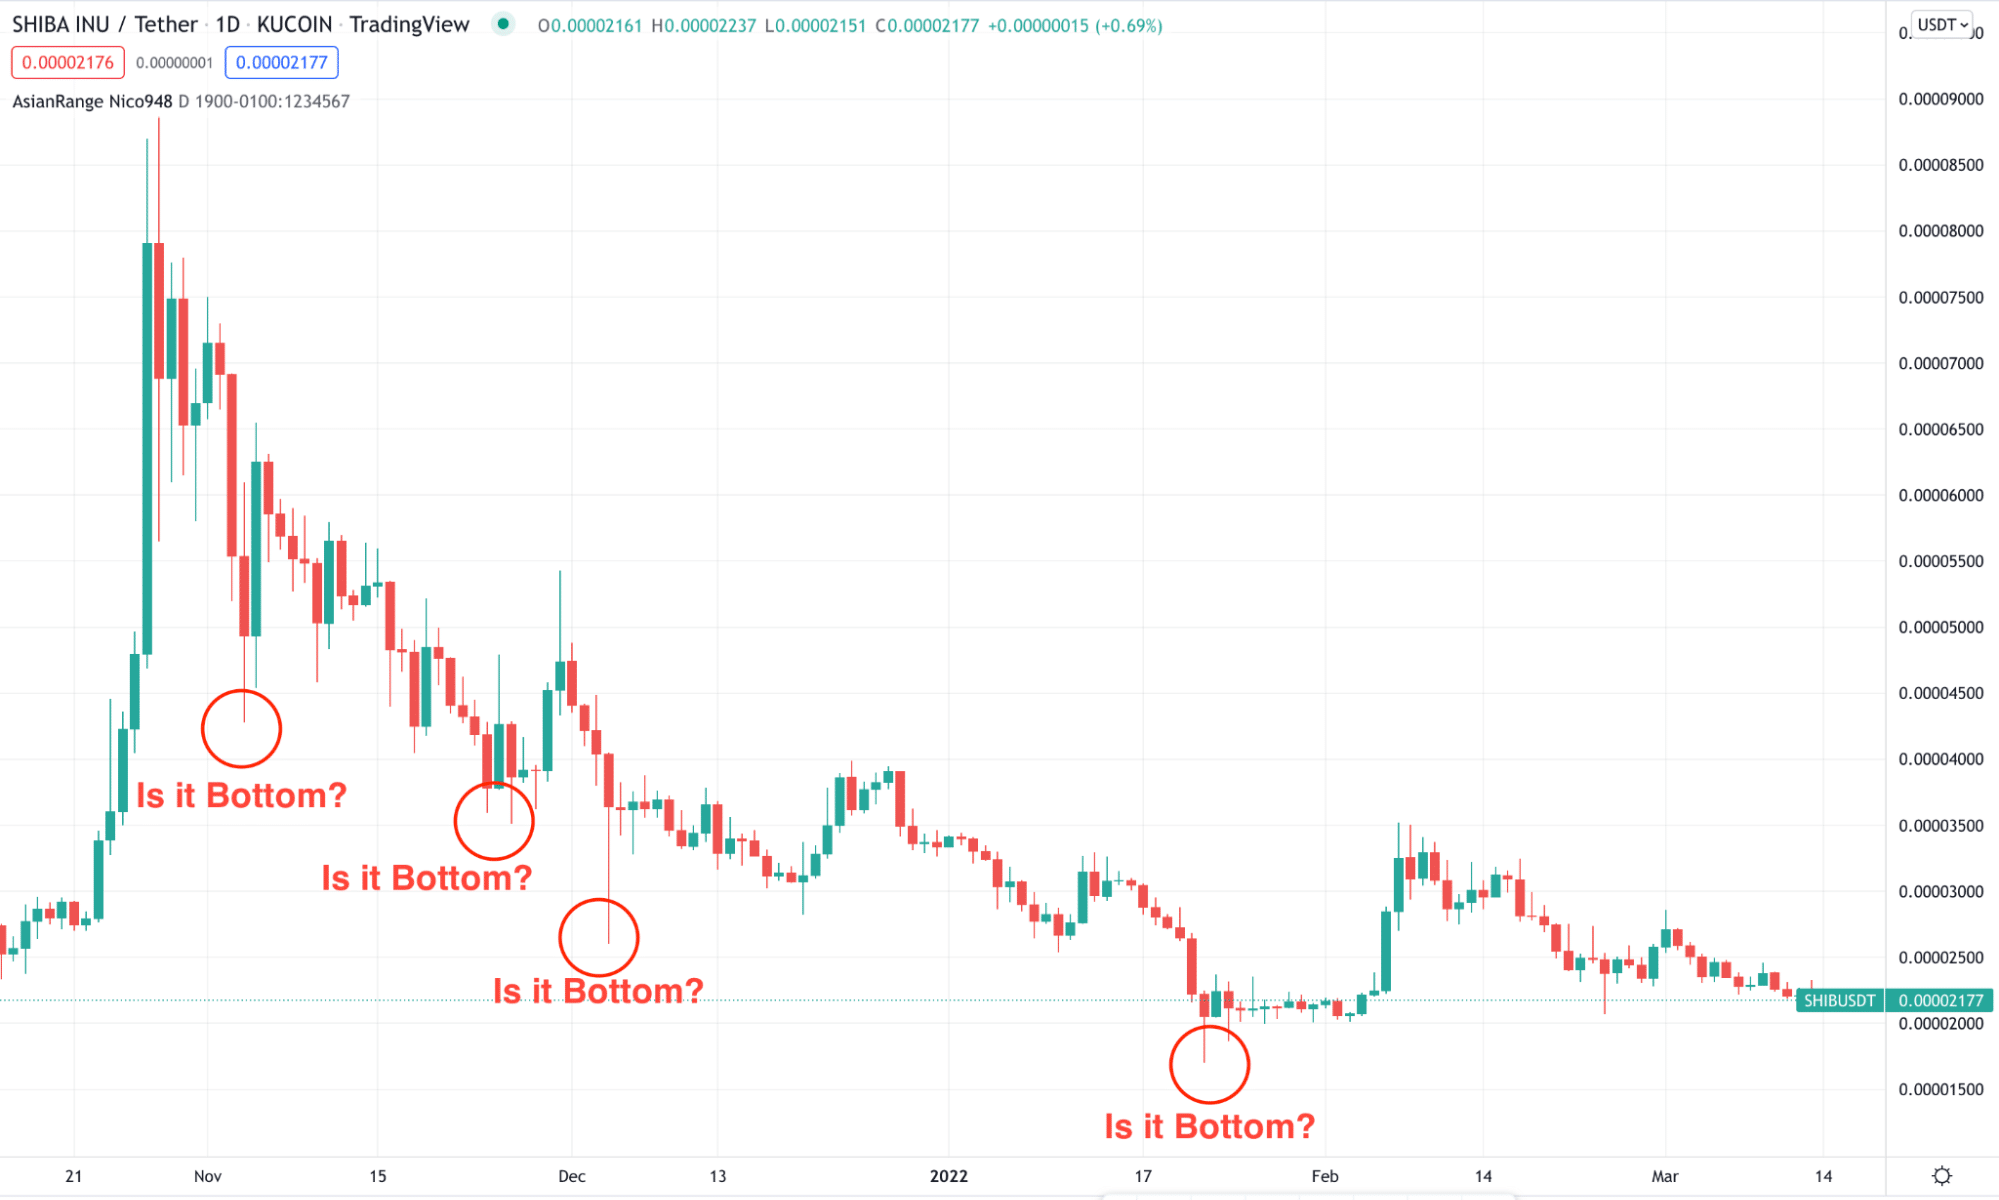
The above image shows how the SHIB/USDT price moved lower by creating lower lows. Everything the price moves higher from the swing low, it is likely to be a bottom. However, Instead of making new highs, the price moved down consecutive four times. In that case, it is difficult to find the bottom.
In the next section, we will see the best way to find the bottom using the price action.
How to trade using the crypto bottom pattern in trading strategy?
The main characteristic of a bottom is that the price should reverse from it and not make any further loss. However, there is no way to provide any guarantee on the price bottom in financial trading. However, the following steps include the way to find it in the naked chart.
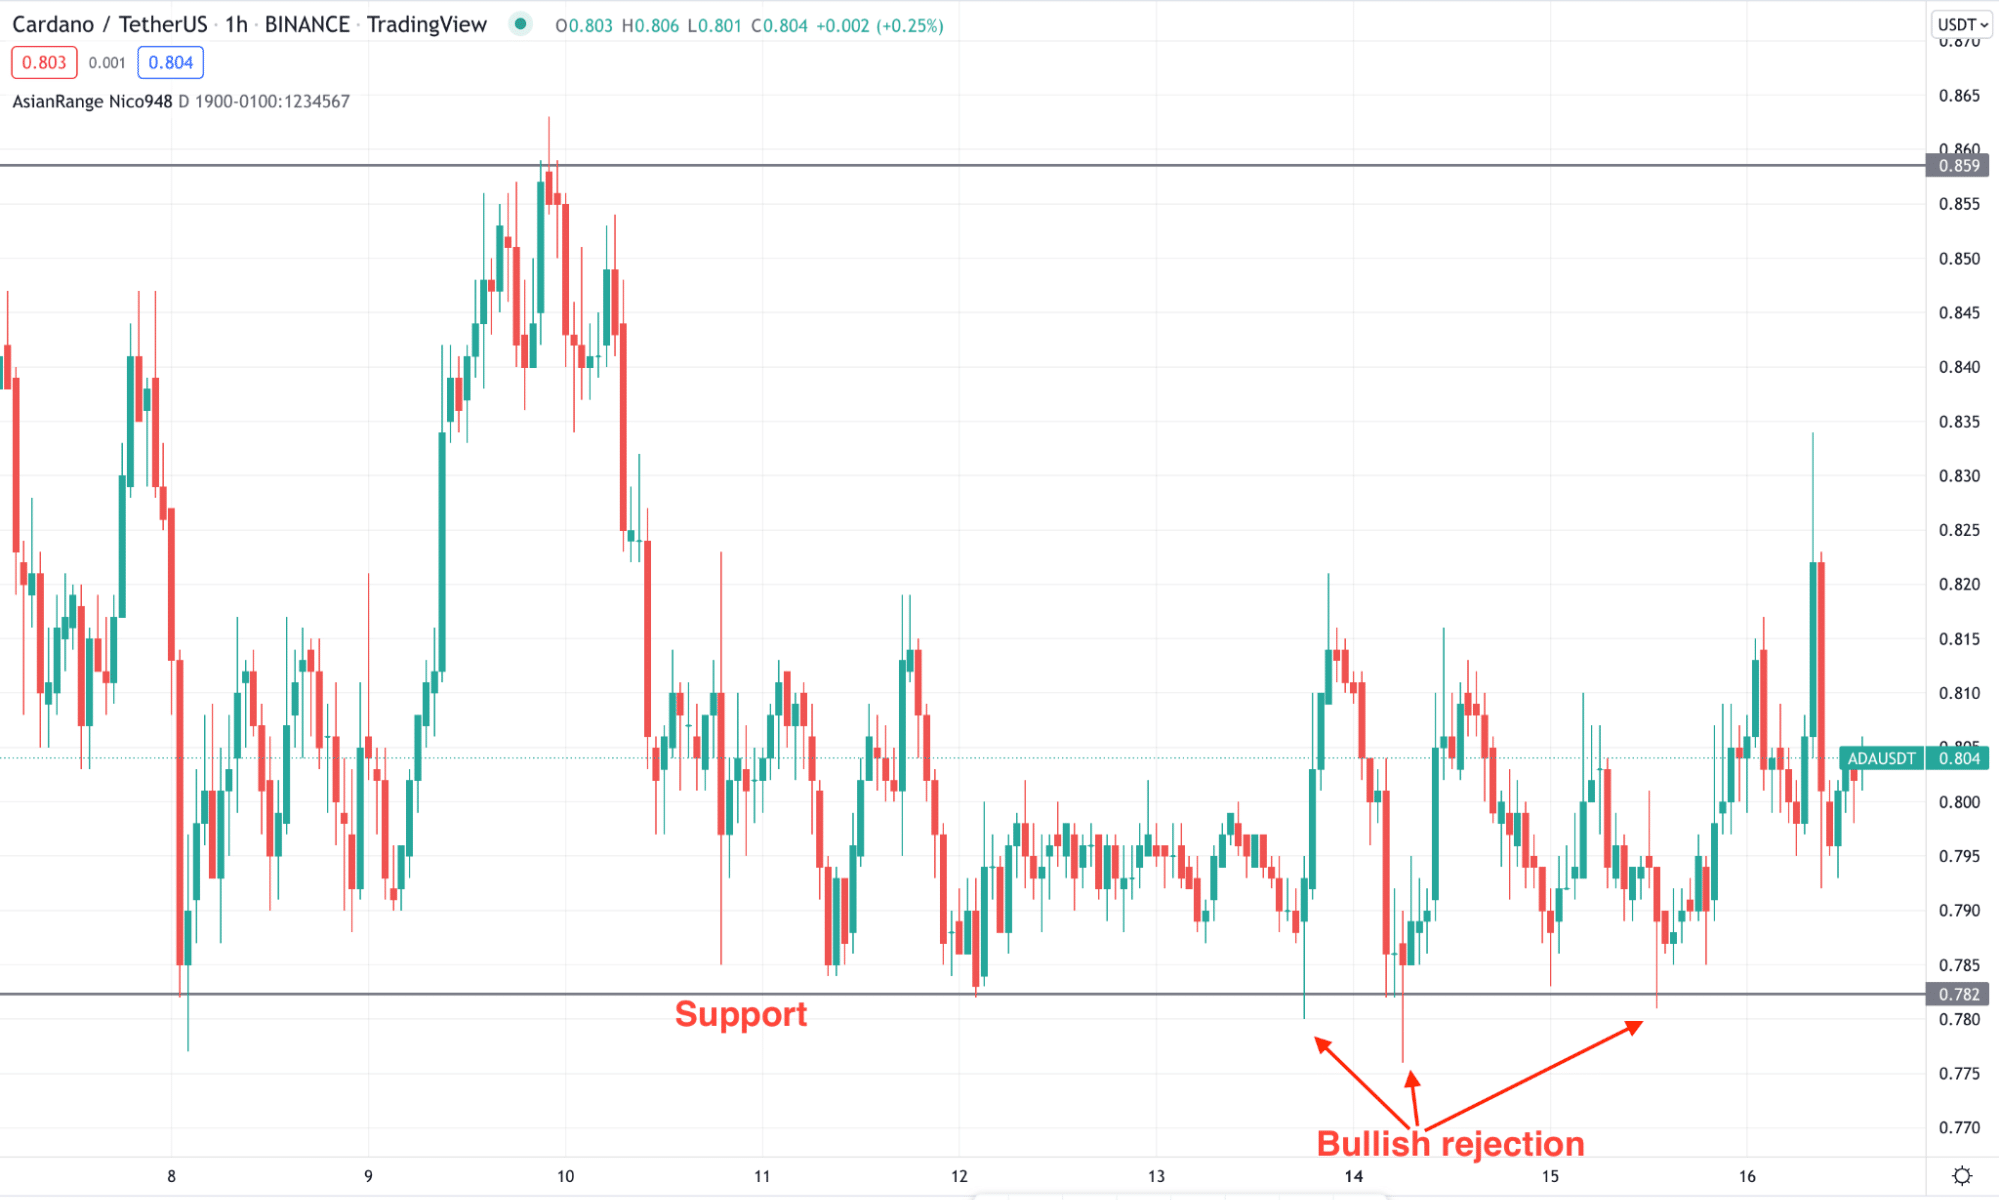
S/R or Fibonacci
After a long bearish move, there is a higher possibility of a rebound if the price reaches any support level. In that case, investors should wait for a bullish rejection candlestick to rely on the movement.
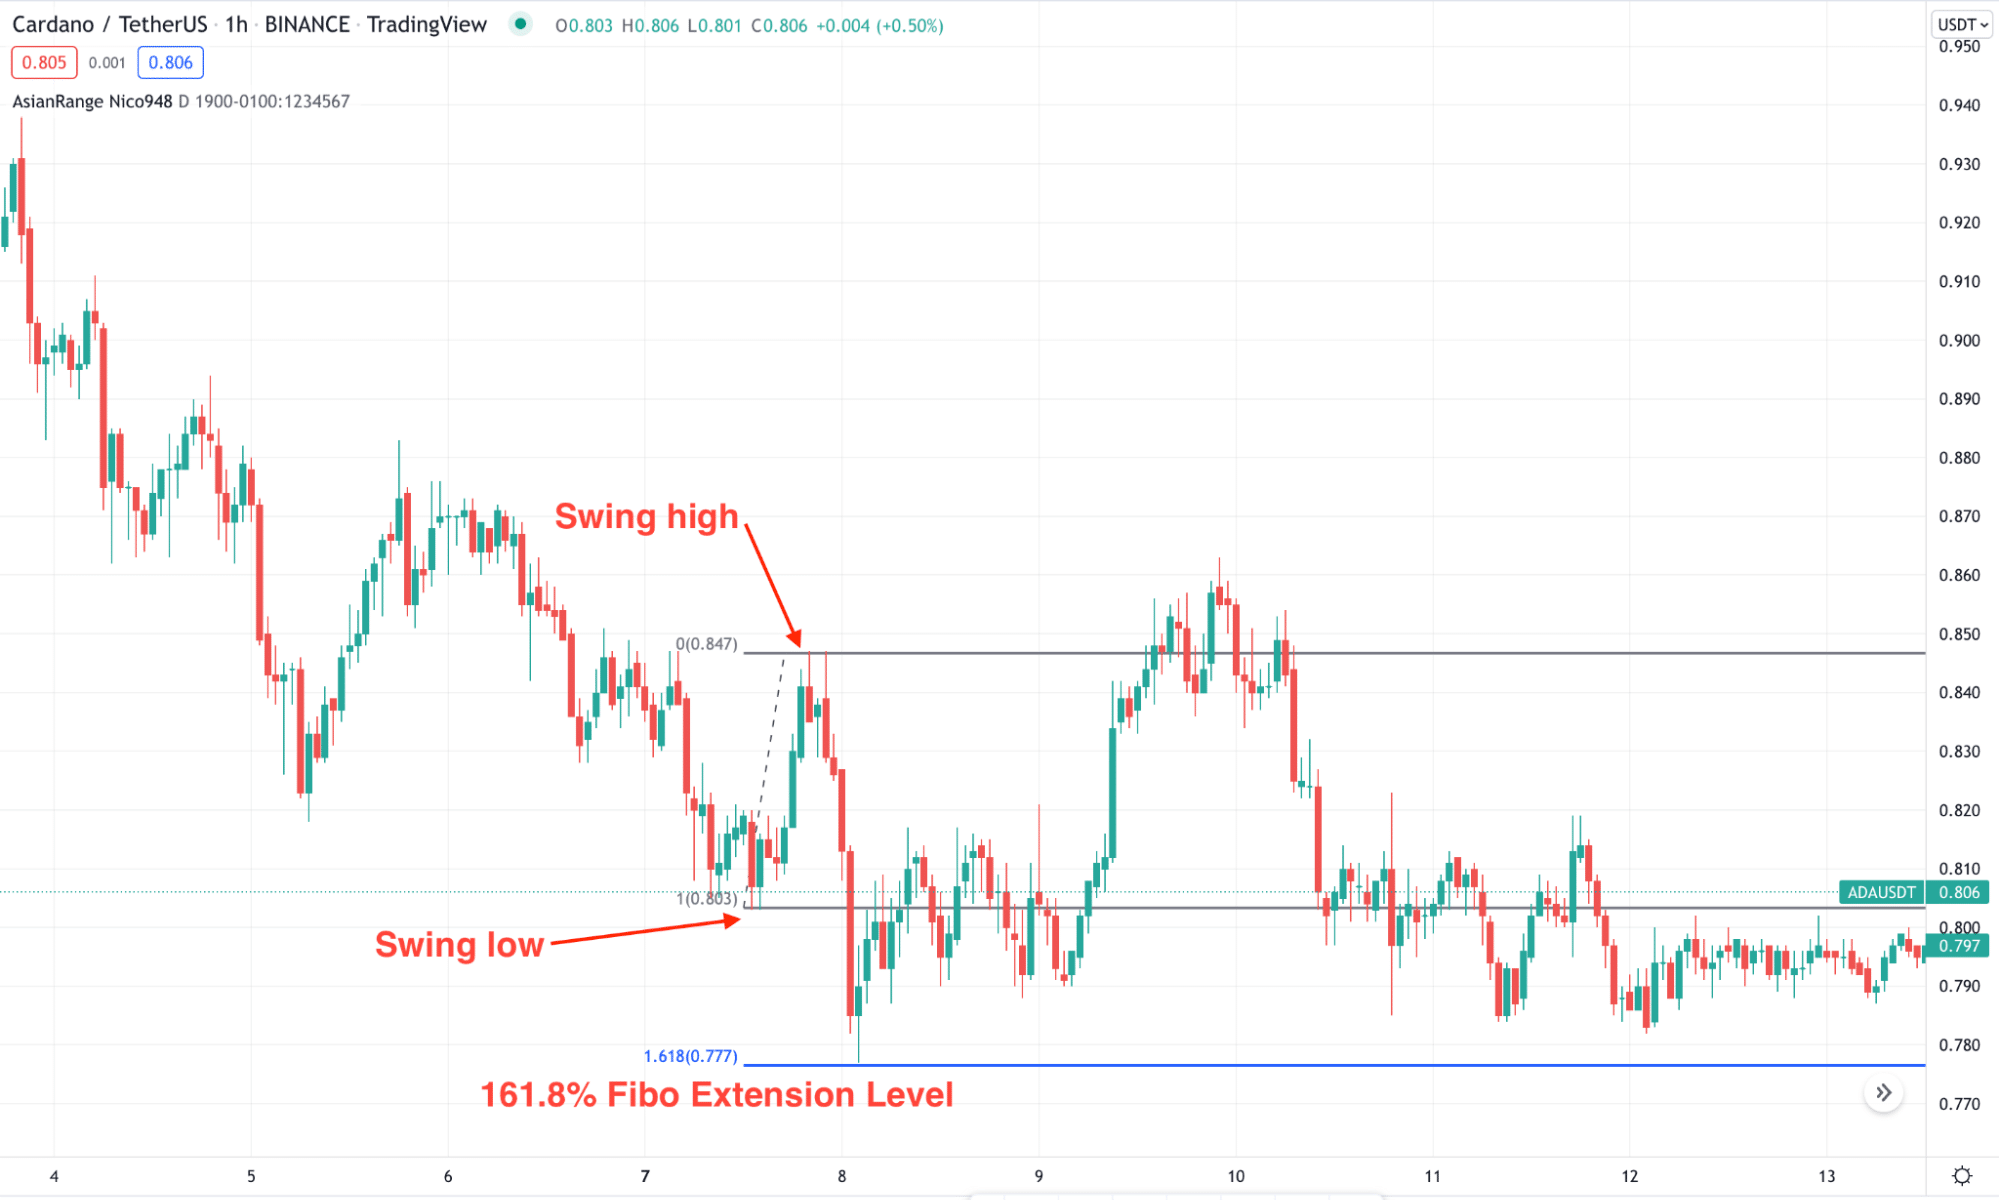
Another approach is to find the Fibonacci extension level to find the bottom. If the bearish pressure came with a 161.8% or 261.8% Fibo ext. level from swing low to swing high, the price may rebound.
Confirm the bottom
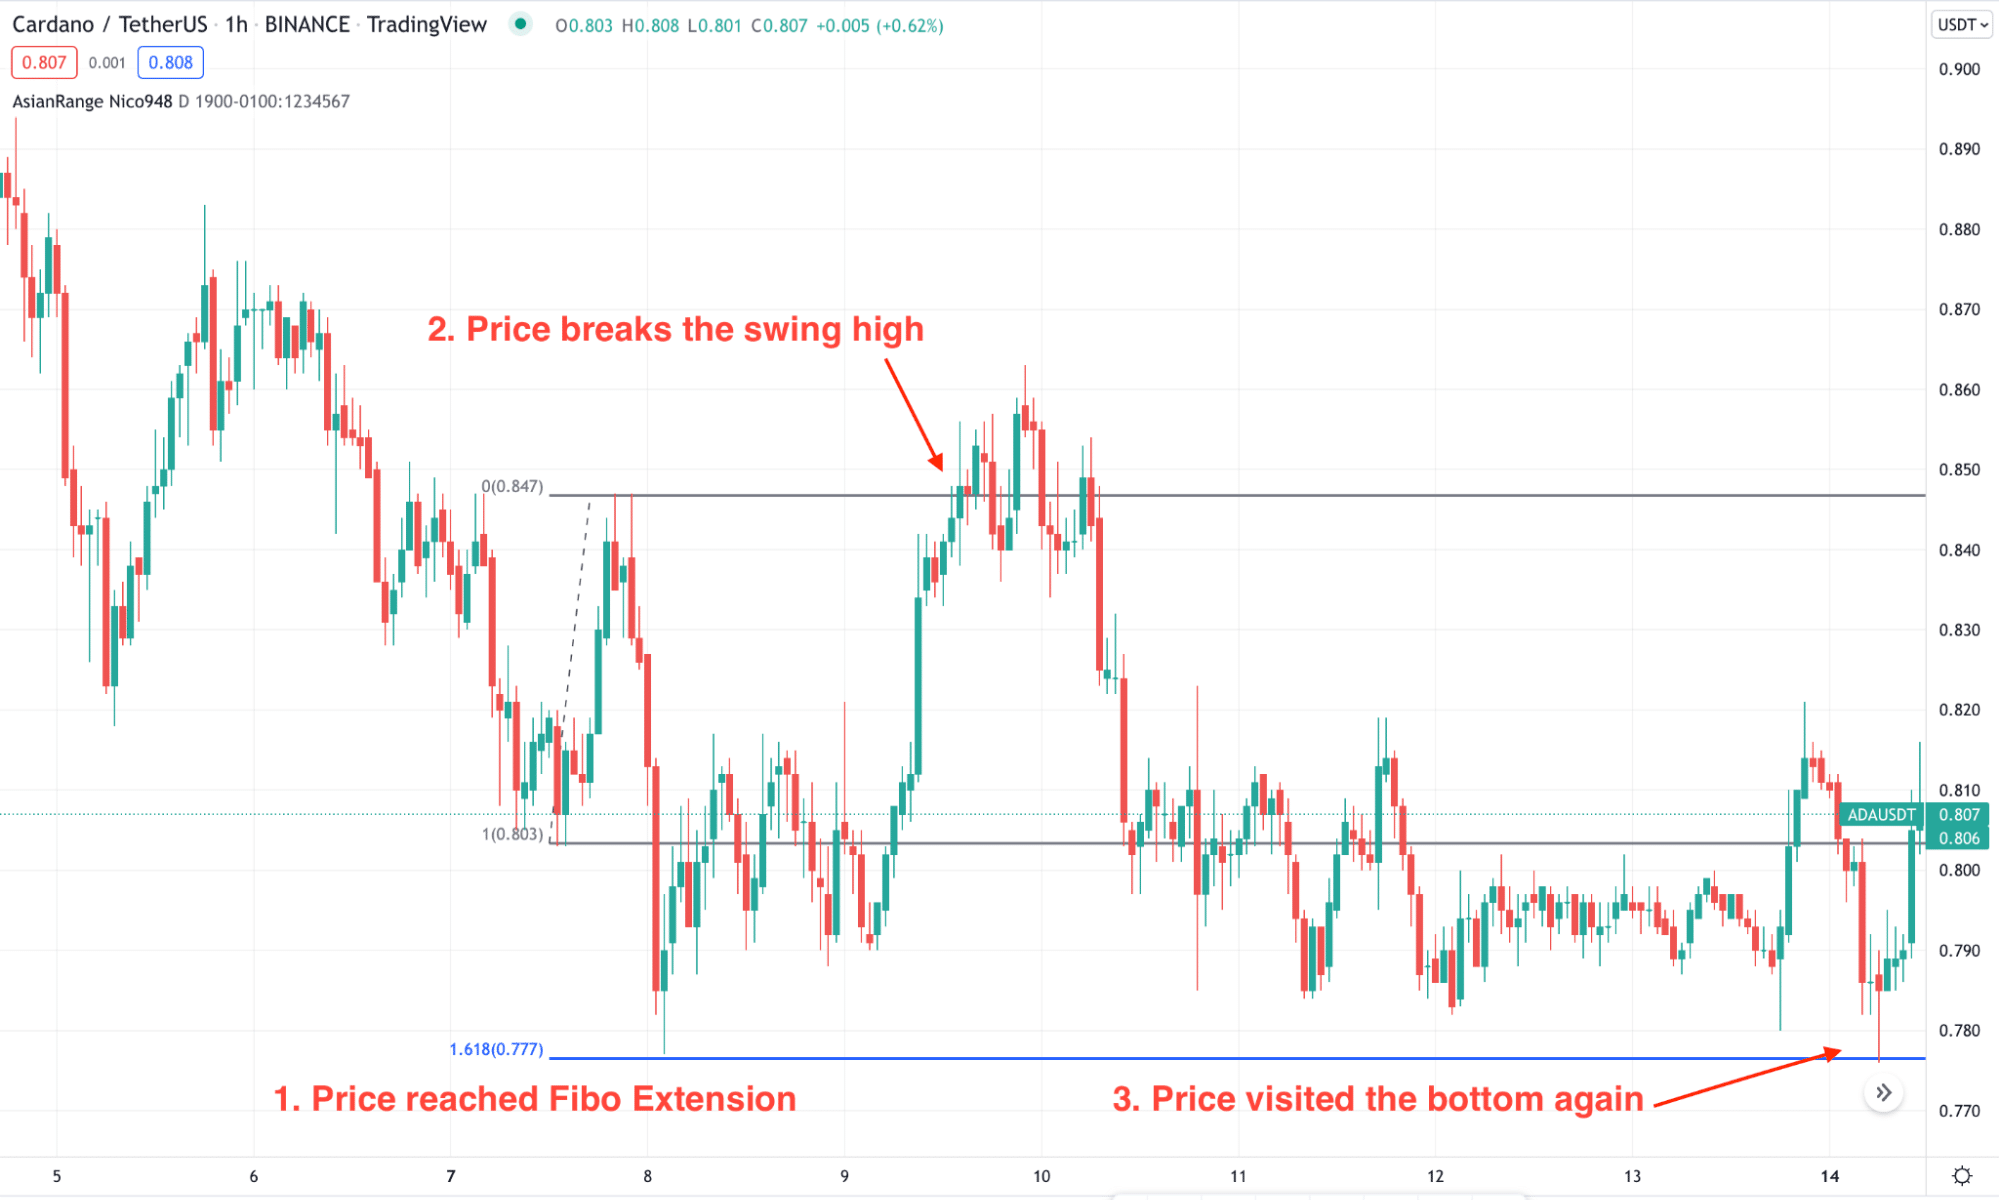
After finding the swing low based on S/R or Fibo level; it is time to consider whether we will rely on it or not. If the price moves higher and makes a new swing high, we can consider the existing bottom as the reliable bottom. Later on, we will wait for the price to come near the bottom again before taking a buy trade.

A short-term trading strategy
We will see how to open a buy trade in the intraday chart from the price bottom in the short-term trading method. As it is a lower time frame trading, investors should remain cautious about the long-term trend.
Do not take any short-term buy trade if the long-term trend is bearish. First, investors should find where the long-term trend changes direction before opening trade on the lower time frame.
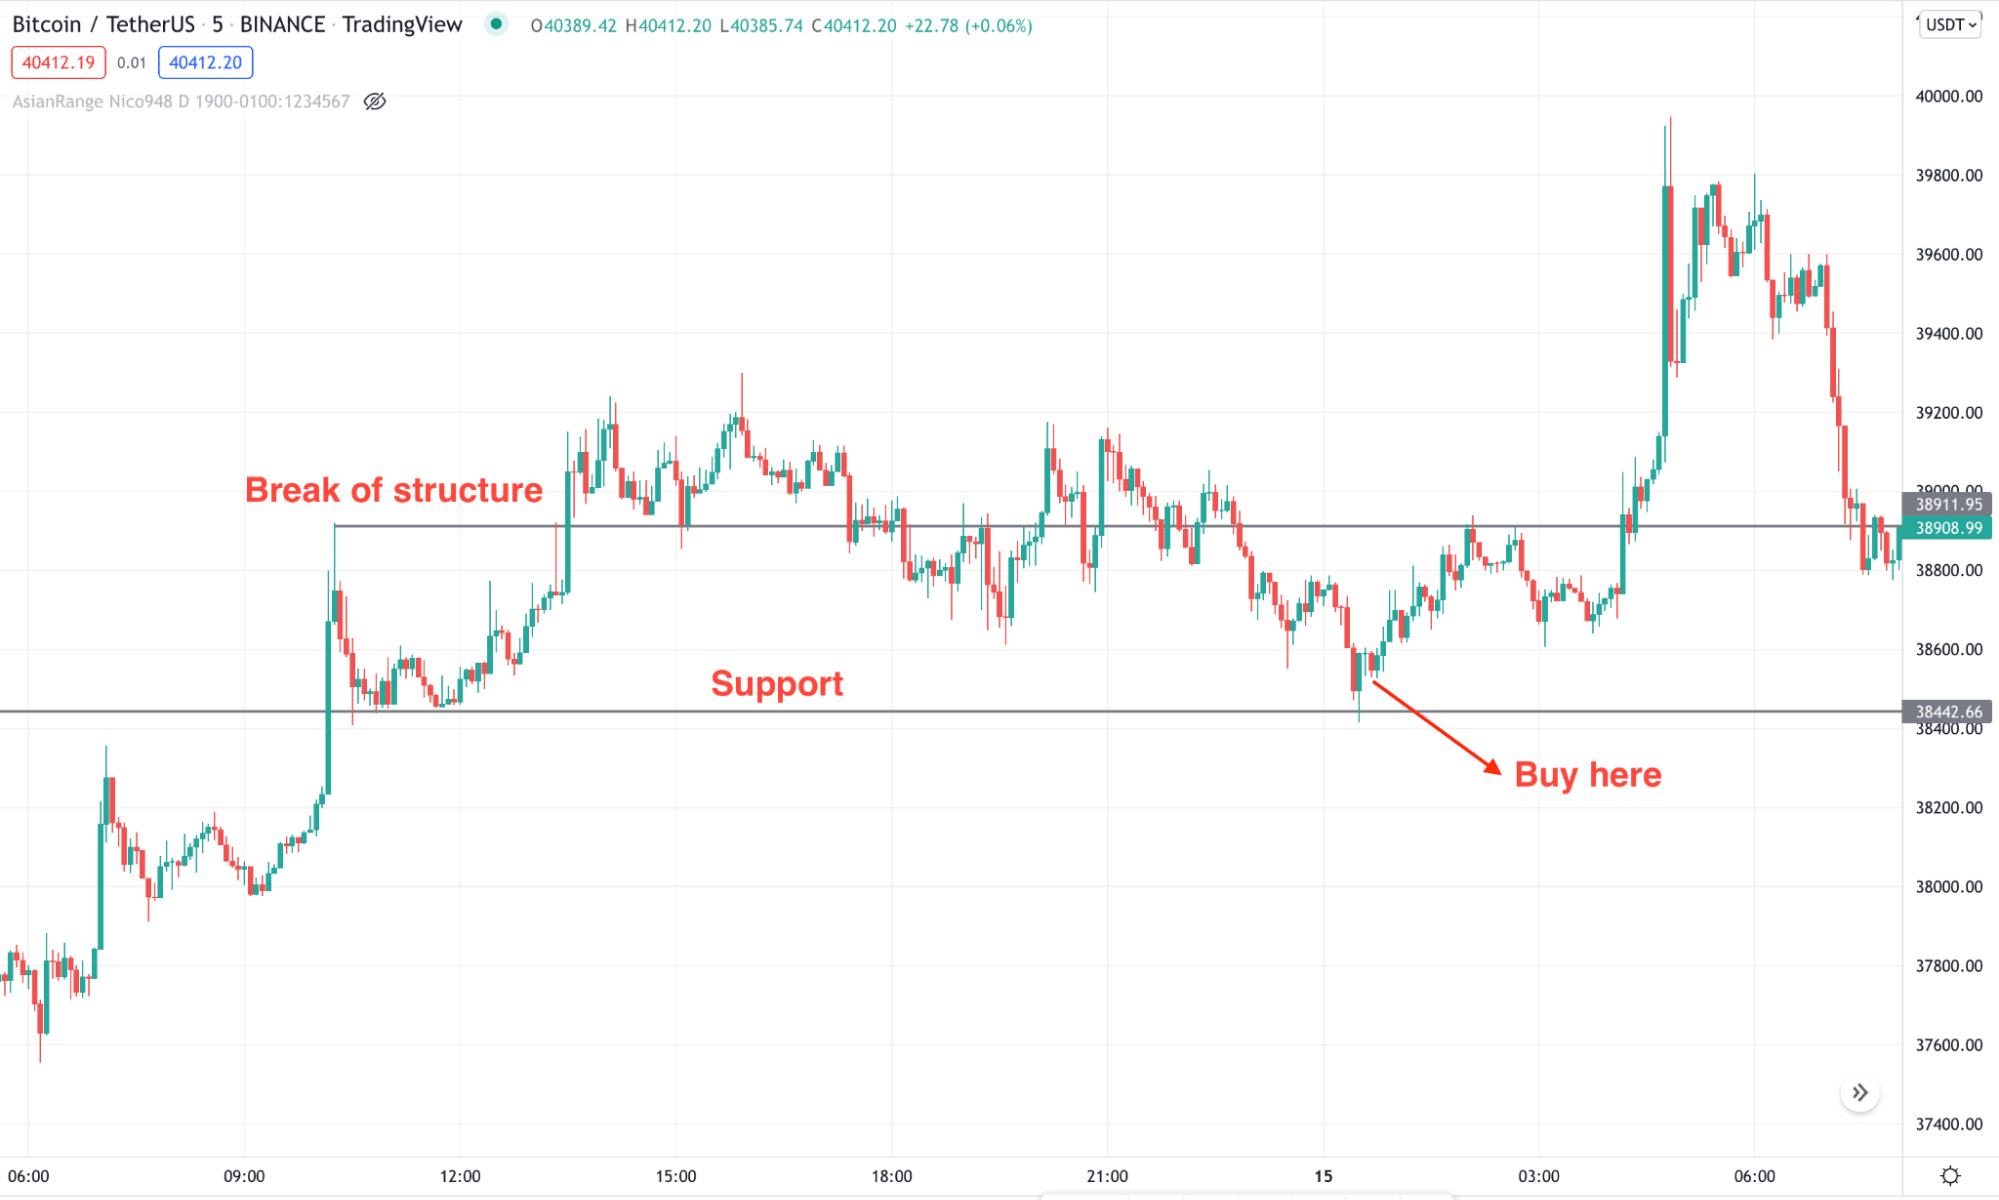
Bullish trade scenario
In the buy trade, make sure to find these conditions in the price chart:
- The long-term price trend showed a rebound from the bottom and aimed higher.
- The price reached a significant support level in the M5 or M15 chart.
- The price rebounded higher after making ground and took out the near-term swing, confirming the bottom.
- The price came back to the bottom and rejected the level with a bullish rejection candlestick, which validates the buy trade.
- The stop loss should be below the bullish rejection candle, and TP is based on the trader’s personality.
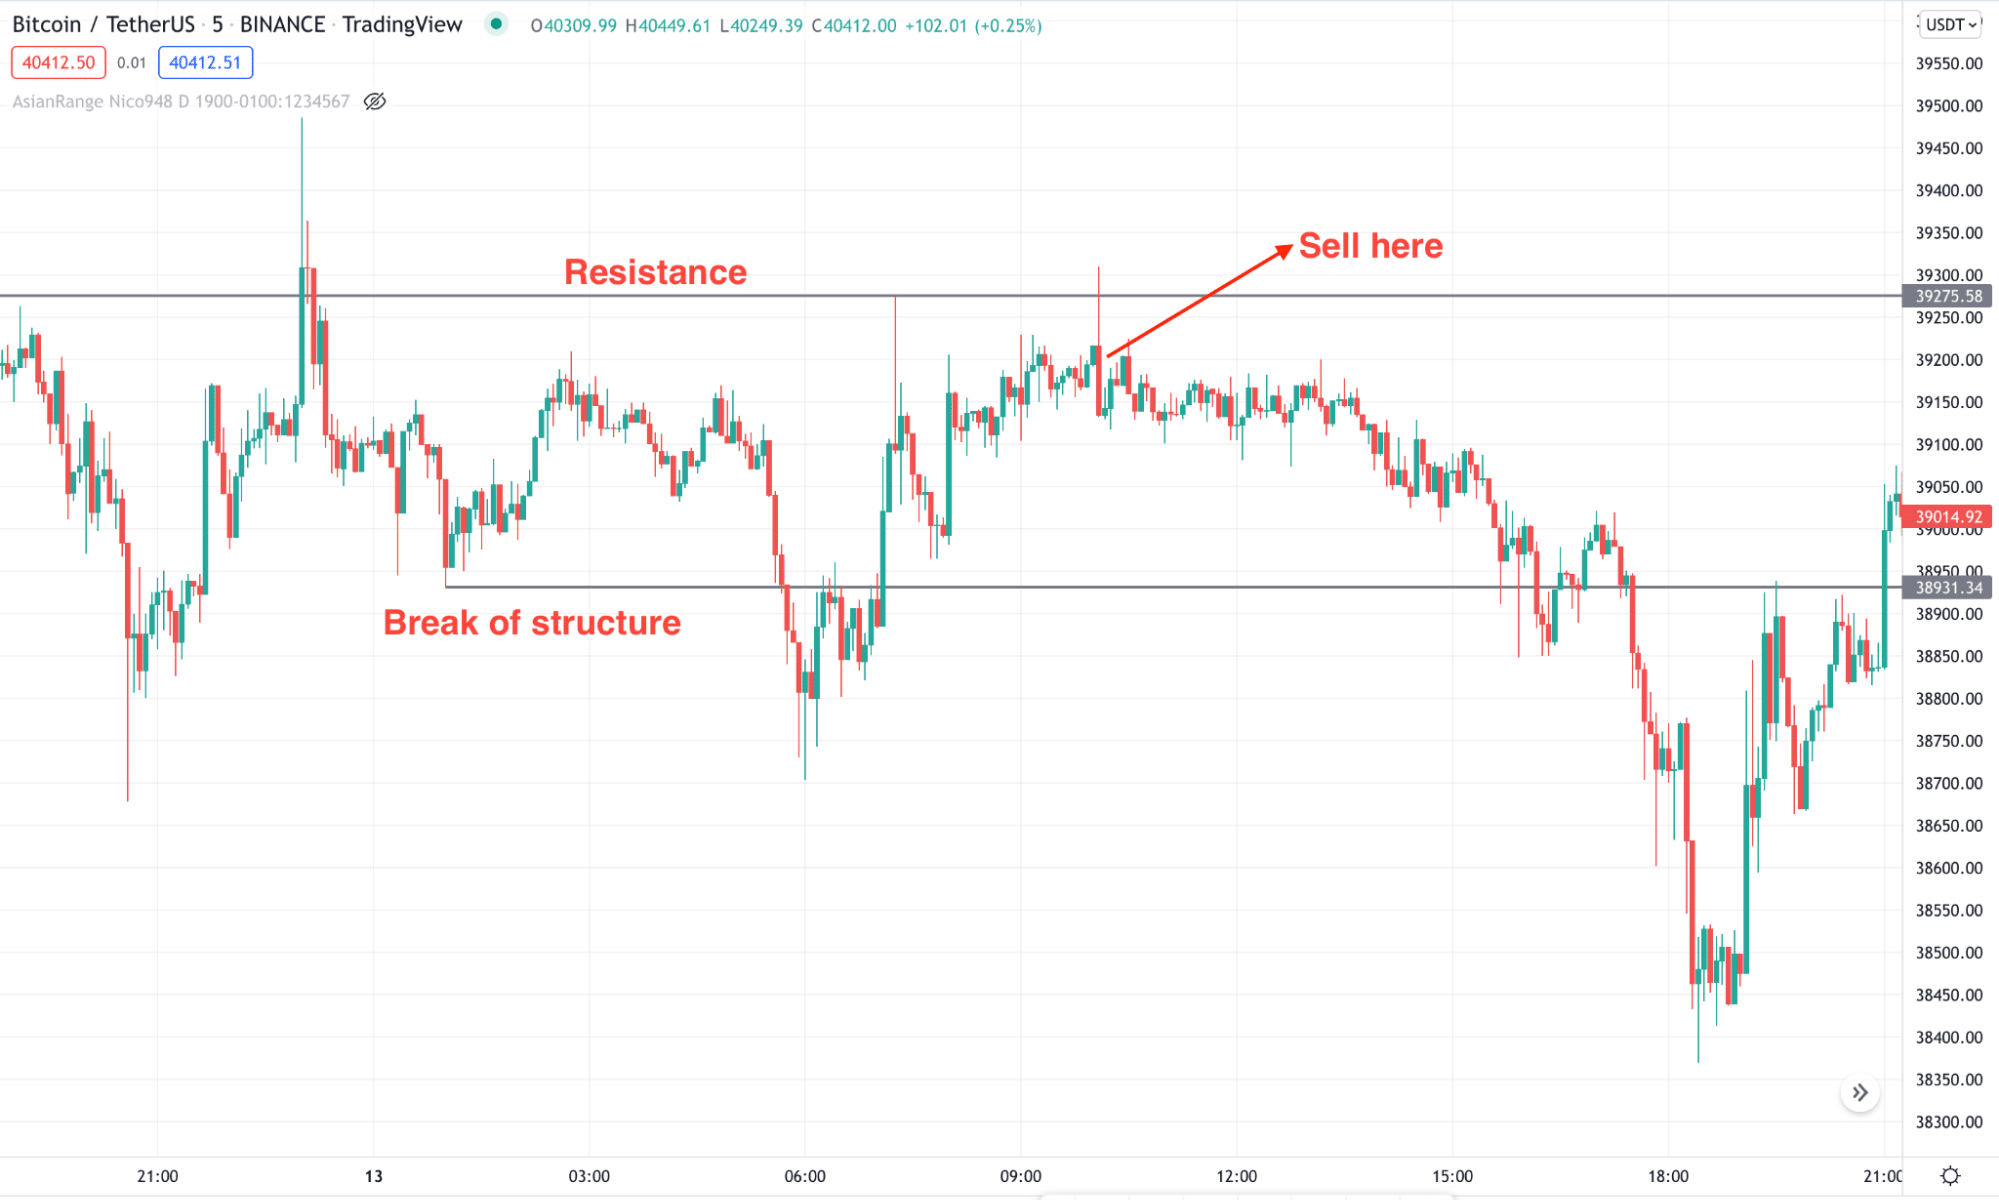
Bearish trade scenario
The bearish version is the opposite of the buy trade, which is applicable on crypto CFDs only:
- The long-term price showed bearish rejection from a significant resistance level before aiming lower.
- The lower time frame price reached a resistance level and made a swing low with a bearish rejection.
- The price revisited the bottom and showed the selling opportunity with a bearish rejection candle.
- The stop loss should be above the bearish rejection candle and TP is based on the trader’s personality.
A long-term trading strategy
Investors should not bother with what is happening in the lower time frame in the long-term method. Moreover, the higher time frame system has a higher success rate, and it is easy to follow. Investors should wait to validate the top or bottom by taking out swing levels like the short-term strategy. Later on, the entry will be possible once the price revisits the zone.
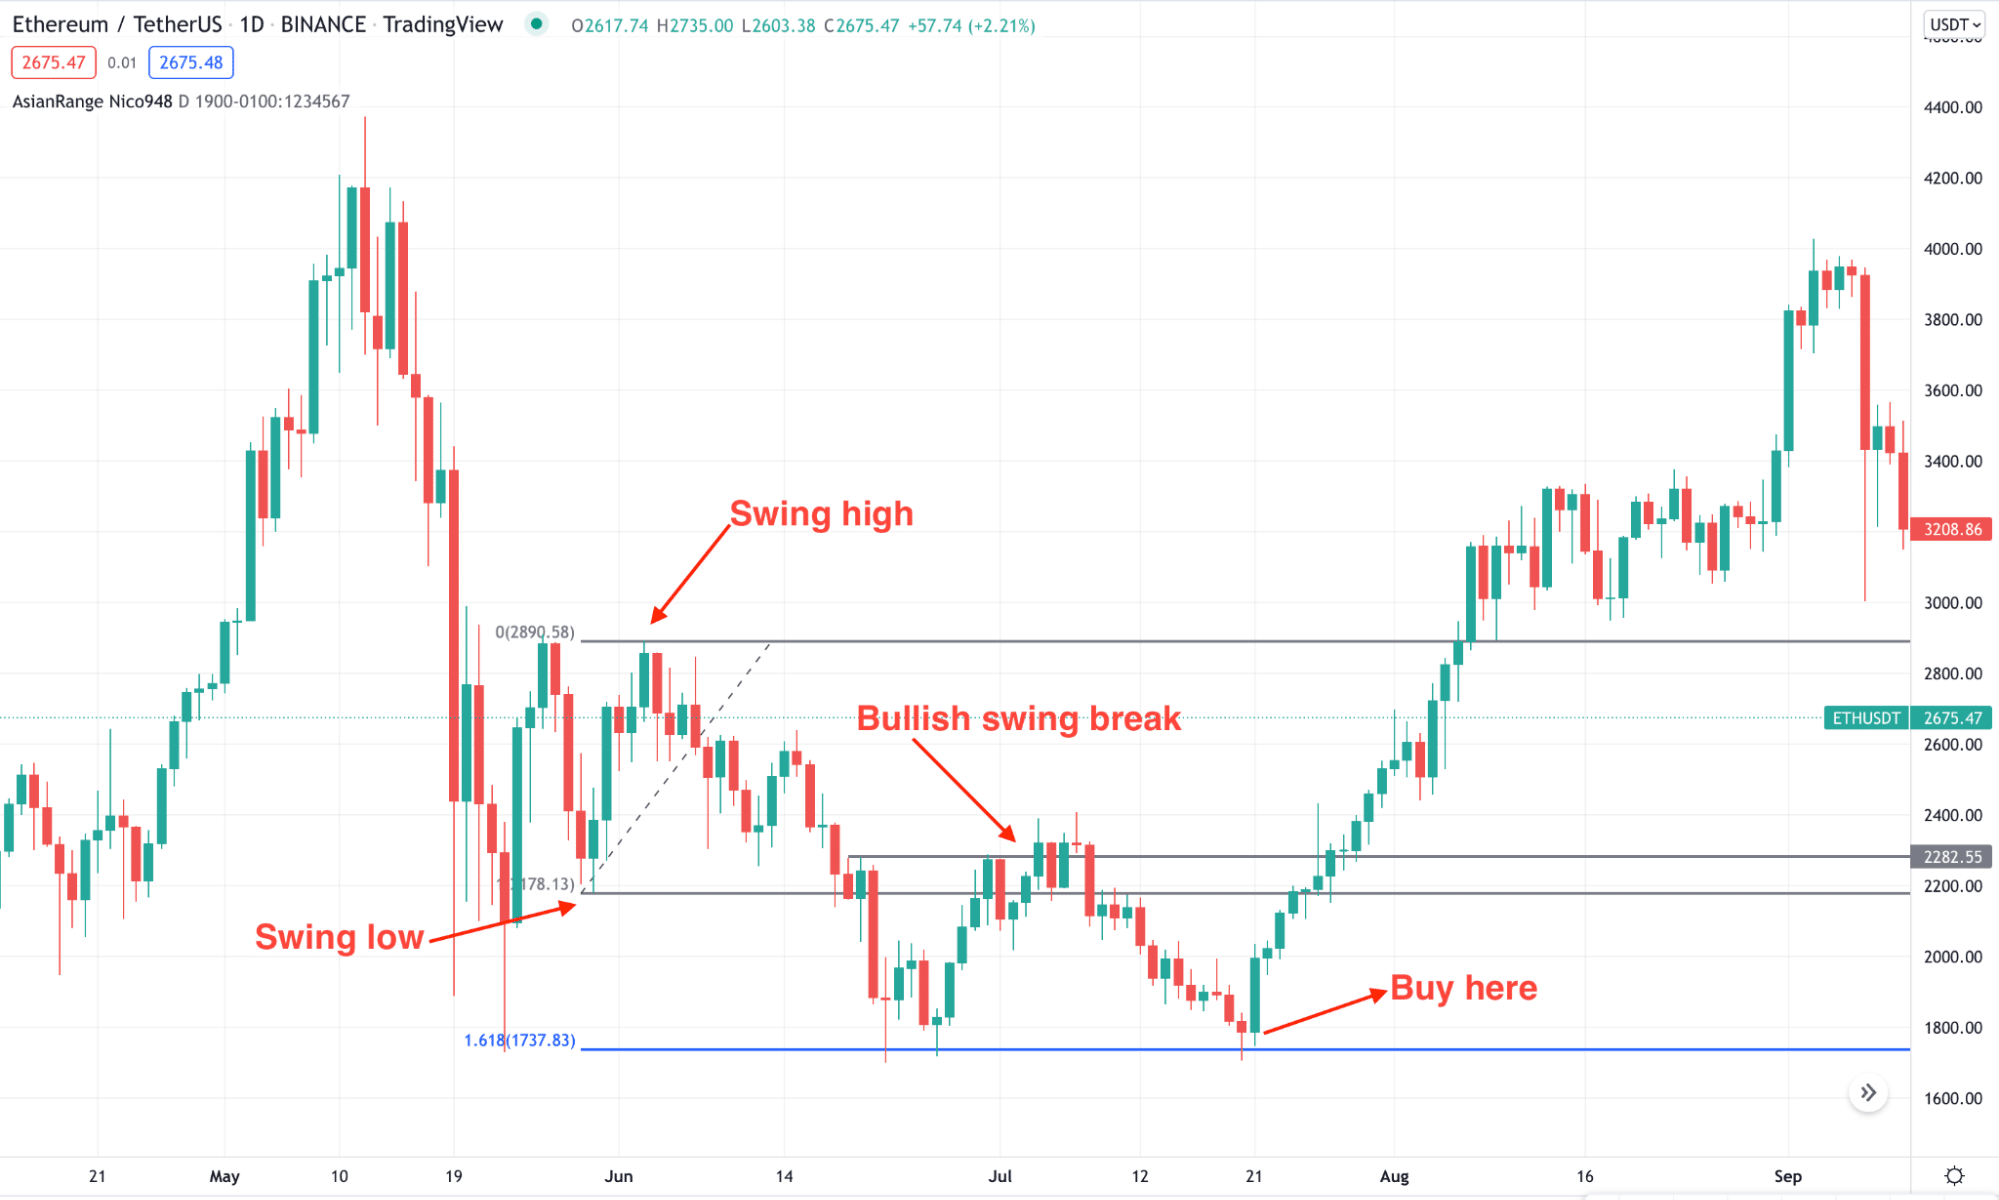
Bullish trade scenario
In the buy trade the following conditions should be present in the price chart:
- In the daily chart, the price reached 161.8% or 261.8% Fibonacci extension level of the recent swing. Another approach is finding the price at the support level, drawn with the horizontal line.
- Once the price reaches the support level we are unsure whether it will hold or not. Therefore, wait for the price to aim higher with a bullish break of structure.
- The buy trade is valid once the price comes lower to the bottom with a corrective speed and forms a bullish rejection candlestick.
Bearish trade scenario
In the sell trade, the following conditions should be present in the price chart:
- In the daily chart, the price moved higher to 161.8% or 261.8% Fibonacci extension level of recent swing high to swing low. Another approach is finding the price at the resistance level, drawn with the horizontal line.
- Once the price has reached the resistance level, we are unsure whether it will hold or not. Therefore, wait for the price to aim lower with a bearish break of structure.
- The bearish trade is valid once the price rises to the top with a corrective speed and forms a bearish rejection candlestick.
Pros & cons
| Pros | Cons |
| Finding top or bottom opens the possibility of taking high RR-based trades. | The unusual price crash often makes trading difficult in the cryptocurrency market. |
| This method is applicable in any crypto coin using the candlestick chart. | Some crypto-coins might consolidate for a long-time instead of showing an excellent movement from support/resistance levels. |
| Managing risk is easy with this strategy. | Traders need sound knowledge about technical analysis and candlesticks. |
Final thoughts
In the above section, we have seen a detailed approach to the crypto bottom strategy where it is easy to buy a crypto coin at a low and affordable price. However, investors should consider the uncertainty in the crypto market where excessive volatility needs to follow a sound risk management system. Make sure to use the stop loss at every trade to get out of the market without a significant loss.


