
The McClellan technical indicator is one of the best technical tools in the financial market. So it makes sense that this indicator can be a helpful tool to generate trade ideas for crypto assets. Using this indicator effectively enables participating in enormous profitable trades on crypto assets.
However, it is mandatory to learn the components to use any trading indicator for making trade decisions. This article will introduce you to the McClellan technical indicator and sustainable crypto trading strategies using this indicator.
What is the McClellan technical indicator?
It is a popular technical tool that detects the price movement and shows results in an independent window. The window contains a central line and a dynamic line that fills with different colors. When the dynamic line reaches above the central line, the gap fills up with green color, and when the line reaches below the central line, the gap turns red. The different colors on both sides of the central line declare different forces of price movements.
How to use the crypto McClellan technical indicator?
The tool is straightforward when applied to make trade decisions on crypto assets.
- When the dynamic line reaches above the central line, it declares a positive force on the asset price and initials of bullish momentum.
- On the other hand, when the dynamic line reaches below the central line, it indicates declining pressure on the asset price.
You can use this simple concept independently in any crypto asset. Otherwise, you can combine other technical indicators and tools with this concept to determine effective trading positions.
Short-term trading strategy
In this trading method, we use the Parabolic SAR indicator as a supportive indicator alongside the McClellan to generate trade ideas. When it signals any direction, we confirm the direction and trend switching point from Parabolic SAR indicator readings. The trade decision comes by combining both indicators readings. We recommend using this method on a 15-min or hourly chart to catch the most potent short-term trading positions.
Bullish trade scenario
When seeking to open a buy position apply both indicators to your target asset chart and observe both indicator’s readings, such as:
- The dynamic line McClellan oscillator reaches above the central line.
- The gap between the dynamic line and the central line turns green.
- The parabolic SAR indicator creates a dot below price candles.
- The parabolic SAR dots start making a series below price candles.
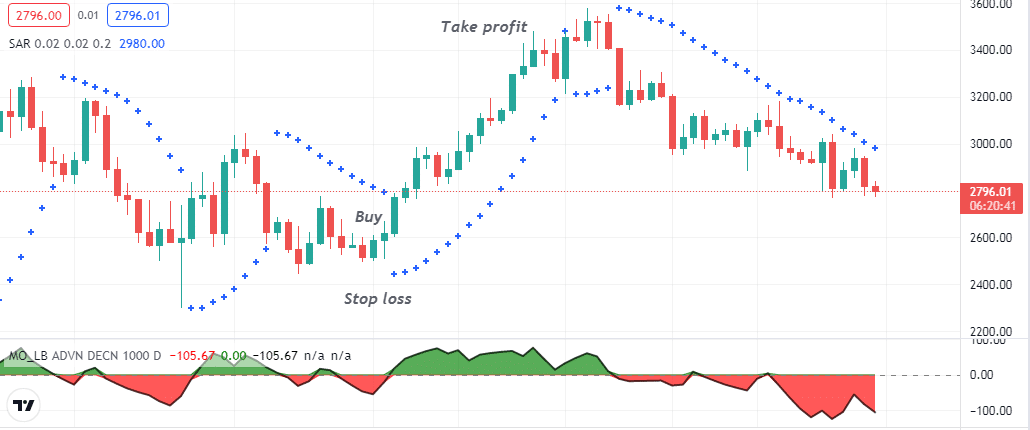
Entry
When the indicators at your target asset chart show these readings, it declares the initiation of a potential bullish momentum. Enter a buy order.
Stop loss
Place an initial stop loss below the recent bullish momentum with a buffer of 5-10pips.
Take profit
Continue the buy order till the price continues to increase. Close the buy order by checking the conditions below:
- The dynamic McClellan oscillator drops below the central line, and the color turns red.
- The parabolic SAR dot switches above price candles.
Bearish trade scenario
When seeking to open a sell position apply both indicators to your target asset chart and observe both indicator’s readings, such as:
- The dynamic line McClellan oscillator reaches below the central line.
- The gap between the dynamic line and the central line turns red.
- The parabolic SAR indicator creates a dot above price candles.
- The parabolic SAR dots start making a series above price candles.
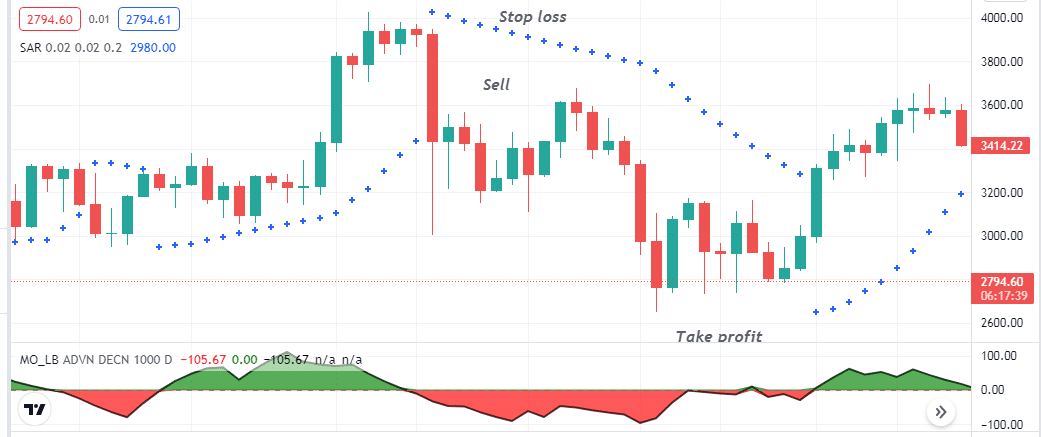
Entry
When the indicators at your target asset chart show these readings, it declares the initiation of a potential bearish momentum. Enter a sell order.
Stop loss
Place an initial stop loss above the recent bearish momentum with a buffer of 5-10pips.
Take profit
Continue the sell order till the price continues to decline. Close the sell order by checking the conditions below:
- The dynamic McClellan oscillator rises above the central line, and the color turns green.
- The parabolic SAR dot switches below price candles.
Long-term trading strategy
We use an HMA line alongside the McClellan oscillator in this trading method while making trade decisions. This trading method suits many trading instruments and different time frame charts, and we recommend using a daily or H4 chart to catch the best long-term trades. This strategy contains an HMA line of 30 periods. We know the HMA indicator reduces lags more than other MA indicators and is a simple indicator to use.
Bullish trade scenario
Set both indicators in your target asset chart. This method suggests bullish momentum while you find the readings below:
- The dynamic line of the McClellan oscillator goes above the central line.
- The price reaches above the HMA line, and it starts sloping on the upside.
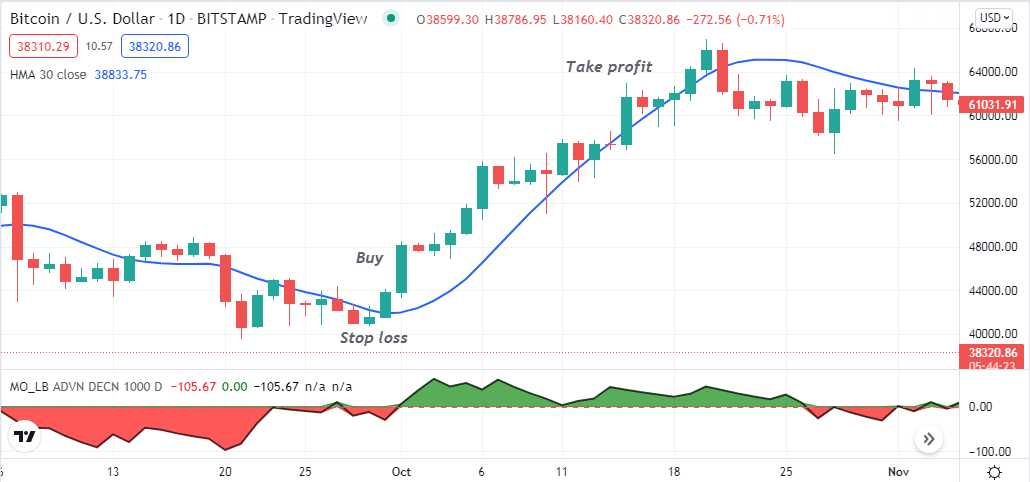
Entry
Match these conditions above and open a buy position.
Stop loss
The initial stop loss will be below the current bullish momentum. You can shift the stop loss at or above the breakeven point after the price makes a higher high when you continue your buy order.
Take profit
Close the buy order when you mark the conditions below:
- The McClellan tool turns red below the central line.
- The price reaches below the HMA line.
Bearish trade scenario
Set both indicators in your target asset chart. This method suggests bearish momentum while you find the readings below:
- The dynamic line of the McClellan tool goes below the central line.
- The price reaches below the HMA line, and the line starts sloping on the downside.
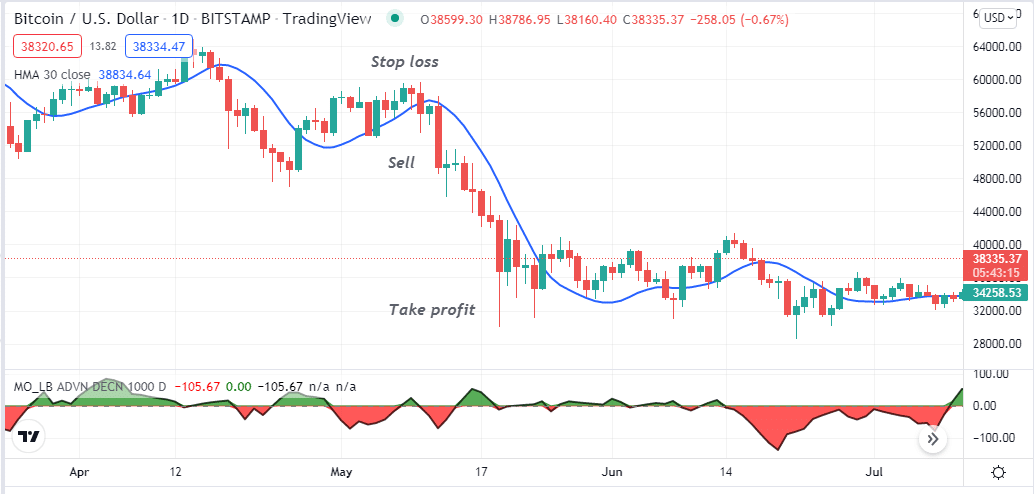
Entry
Match these conditions above and open a sell position.
Stop loss
The initial stop loss will be above the current bearish momentum. You can shift the stop loss at or below the breakeven point after the price makes a lower low when you continue your sell order.
Take profit
Close the sell order when you mark the conditions below:
- The indicator turns green above the central line.
- The price reaches above the HMA line.
Pros and cons
| Pros | Cons |
|
|
|
|
|
|
Final thought
Finally, now know all the essential info about this indicator. We suggest mastering the concept by practicing more before applying the concept in live trading.


