 In Crypto Strategy")
The Directional Trend Index is a unique technical indicator that combines different critical aspects of market movement to generate trade ideas. Financial investors choose this technical indicator for its attractive feature and effective outcome. So no wonder the DTI indicator has become an attractive technical tool to crypto investors.
However, it is not wise to start using any technical indicator for live trading before having a particular level of understanding. This article introduces the Directional Trend Index indicator alongside describing sustainable crypto trading strategies using this technical tool. Later we list the top pros and cons to enlighten the actual potentiality.
What is the Directional Trend Index indicator?
The DTI indicator is a unique technical indicator that uses the high/low momentums of price movements and calculates the increasing or decreasing momentums. William Blau described this indicator in 1995 in his book “Momentum, Direction, and Divergence.” This indicator has a dynamic line that moves beyond three static levels of different parameters.
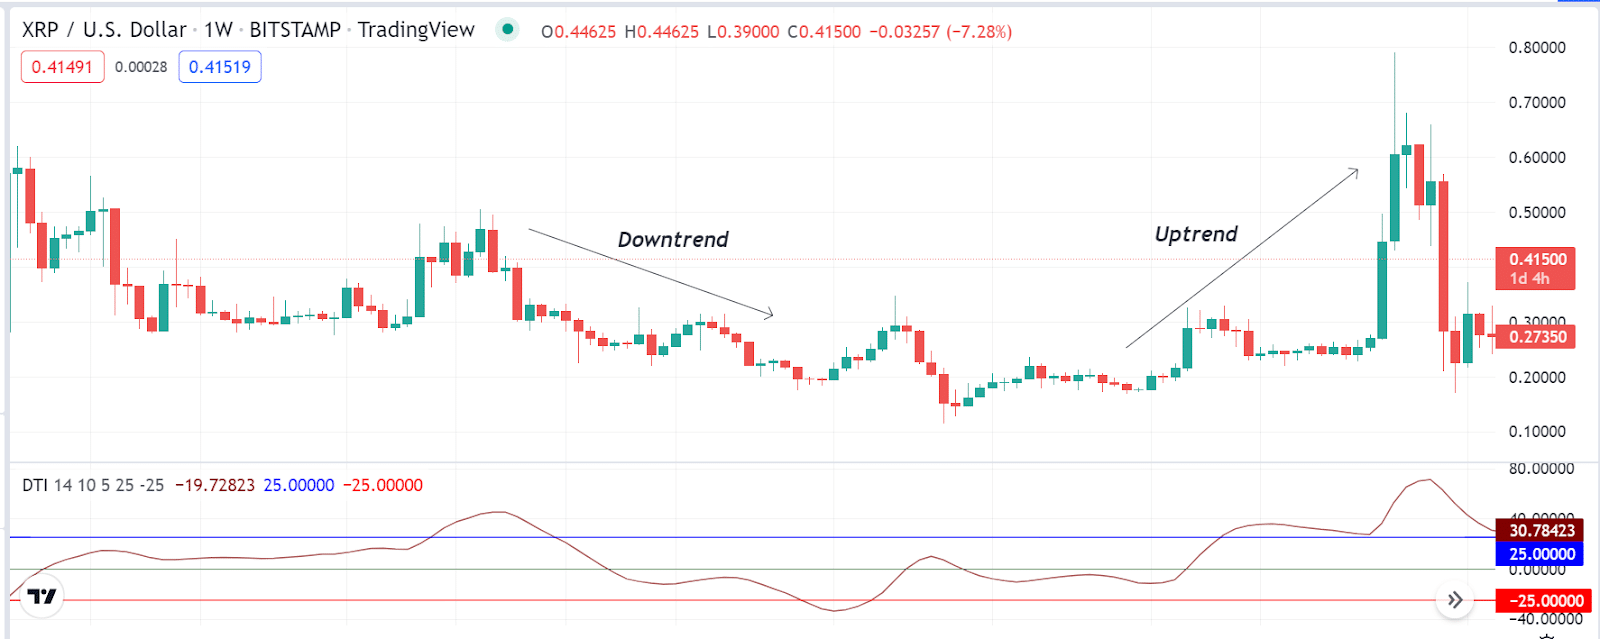
There is a mid-level (0), upper (+25), and lower (-25). The dynamic line reaches each level or beyond declaring different market contexts of any particular period. You can also use the dynamic line’s divergence to obtain the market profile. This indicator is unique as it works with the price and momentum relation.
How to use the DTI indicator in crypto strategy?
You already know the DTI indicator shows results in an independent window containing different levels and a dynamic line. When the dynamic line value gains above +10 declare sufficient bullish pressure, and above +25 indicates extreme buy pressure on the asset price. Meanwhile, they consider any reading below -10 as sufficient declining pressure, and below -25 indicates an extreme sell pressure. So the dynamic line slopes in different directions according to the market context.
Short-term trading strategy
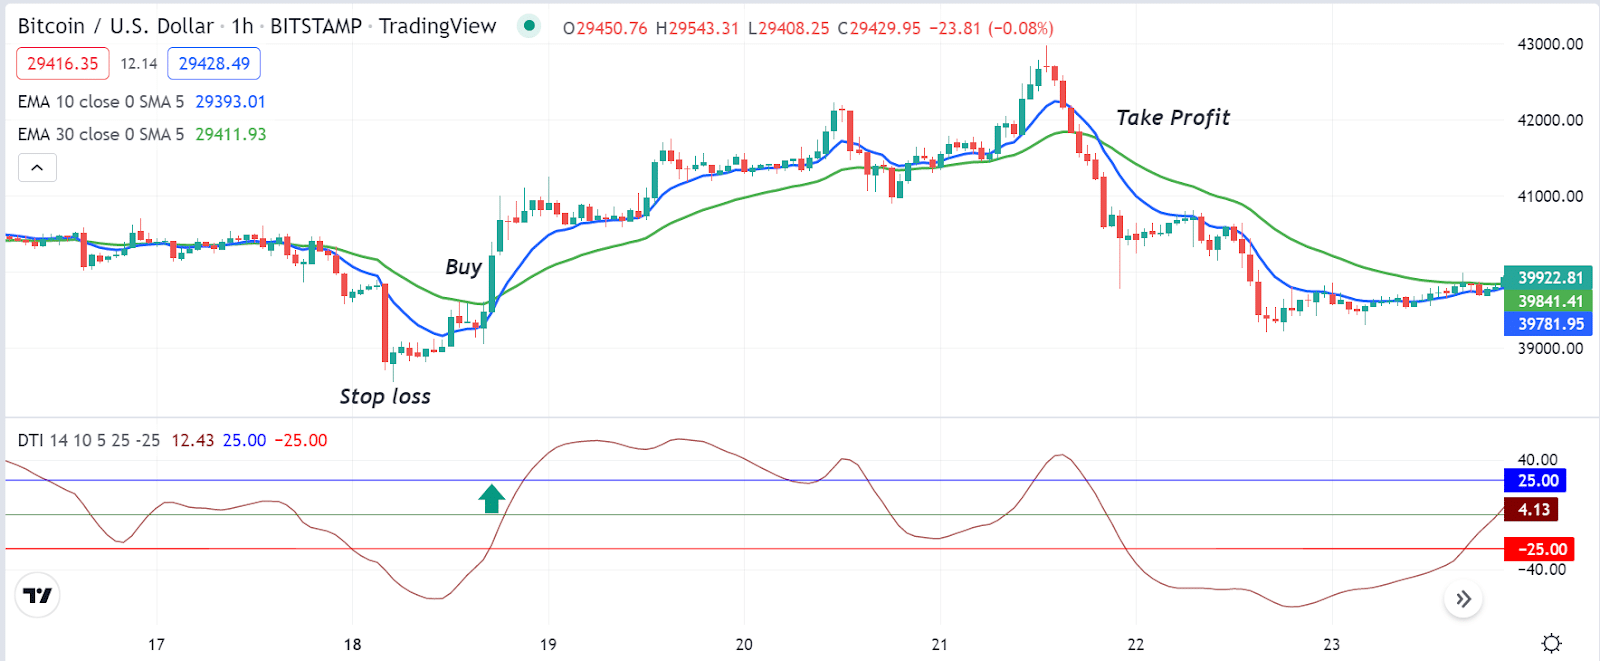
We use the EMA crossover concept alongside the DTI indicator to verify the price direction before performing any trading action in this trading method. We use EMA 10 (blue) and EMA 30 (green). When the momentum changes, these lines make different types of crossovers. Meanwhile, we check the DTI indicator window to confirm the momentum to generate trade ideas. We recommend using a 15 min or Hourly chart to get potential short-term trading positions.
Bullish trade scenario
When seeking to open buy positions, apply both indicators and match the scenarios below:
- The blue EMA crosses the green EMA on the upside.
- Both EMA lines are heading on the upside.
- The DTI value reaches above or at +10.
Entry
When these conditions above match your target asset chart, it indicates a potential bullish momentum. You may open a buy position.
Stop loss
Place your stop loss below the current swing low with a 5-10 pips buffer.
Take profit
You can continue your buy order till the price remains in an uptrend. Close the buy order by spotting the scenarios below:
- The price reaches below both EMA lines.
- The blue EMA line gets below the green EMA line.
- The DTI value surpasses near +25 or starts decreasing after getting that value.
Bearish trade scenario
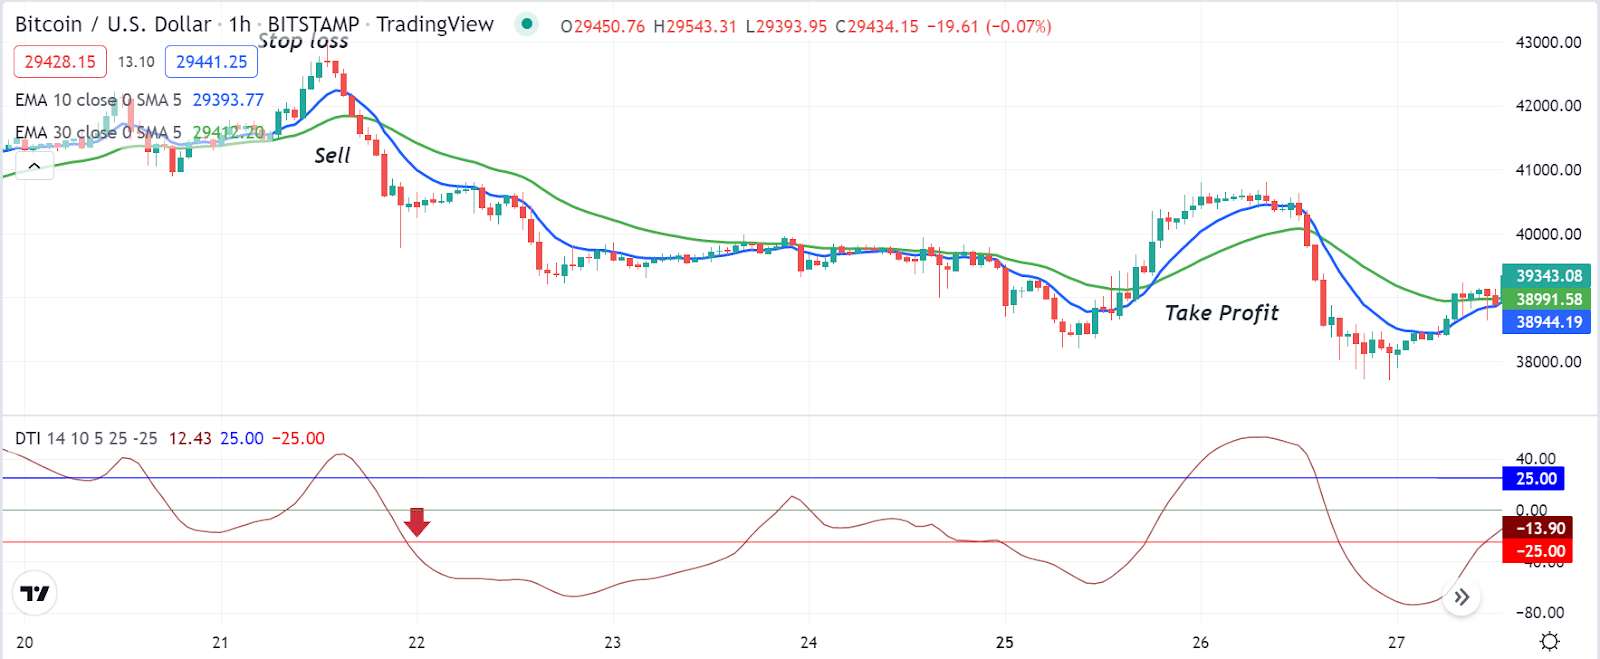
When seeking to open sell positions, apply both indicators and match the scenarios below:
- The blue EMA crosses the green EMA on the downside.
- Both EMA lines are heading on the downside.
- The DTI value reaches below or at -10.
Entry
When these conditions above match your target asset chart, it indicates a potential bearish momentum. You may open a sell position.
Stop loss
Place your stop loss above the current swing high with a 5-10 pips buffer.
Take profit
You can continue your sell order till the price remains in a downtrend. Close the sell order by spotting the scenarios below:
- The price reaches above both EMA lines.
- The blue EMA line gets above the green EMA line.
- The DTI value surpasses near -25 or starts increasing after getting that value.
Long-term trading strategy
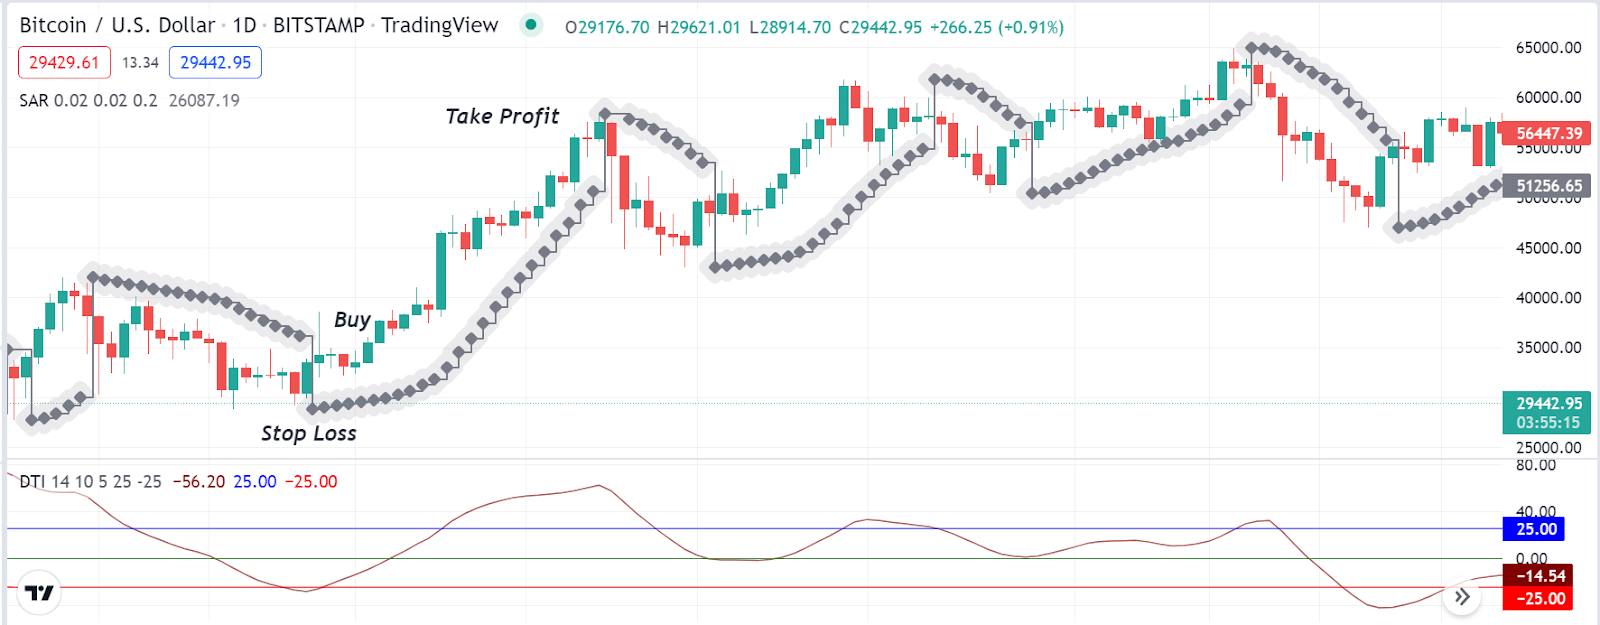
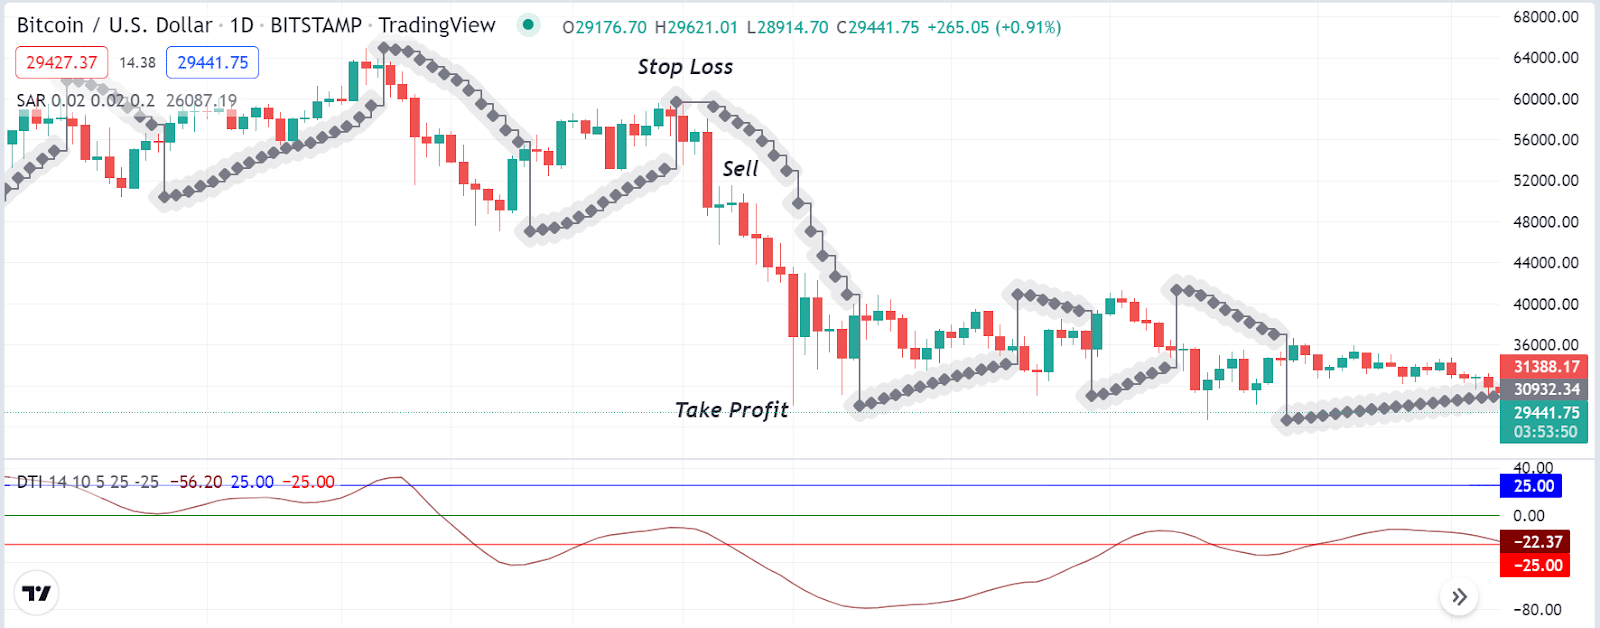
This trading method combines the DTI indicator and the parabolic SAR to obtain the market context. According to participants’ actions, the parabolic SAR creates dots on both sides of price candles. Meanwhile, we match the DTI indicator info to verify the trend and momentum before executing trades. This trading method suits many trading instruments; we recommend using a daily or H4 chart to mark the best long-term trades.
Bullish trade scenario
Match these conditions below when seeking to open long positions:
- The DTI value rises to +10 or above.
- The parabolic SAR dot starts making a series on the bottom side of price candles.
Entry
Open a buy order by matching these conditions above.
Stop loss
The initial stop loss will be below the current bullish momentum. If you continue the buy order, you can shift your stop loss at or above the breakeven when the price movement creates a new higher high as a part of trade management.
Take profit
Close the buy order by observing these scenarios below:
- The DTI value reaches +25 or above and declines near the central level.
- The parabolic SAR dots flip on the upside of price candles.
Bearish trade scenario
Match these conditions below when seeking to open short positions:
- The DTI value rises to -10 or below.
- The parabolic SAR dot starts making a series on the top side of price candles.
Entry
Open a sell order by matching these conditions above.
Stop loss
The initial stop loss will be above the current bearish momentum. If you continue the sell order, you can shift your stop loss at or below the breakeven when the price movement creates a new lower low as a part of trade management.
Take profit
Close the sell order by observing these scenarios below:
- The DTI value reaches -25 or below and rises near the central level.
- The parabolic SAR dots flip on the downside of price candles.
Pros and cons
| Pros | Cons |
|
|
|
|
|
|
Final thought
Finally, now you have a basic understanding of the DTI indicator. You can use these trading methods to execute constant trading positions in crypto assets by mastering the concepts.


