
Dynamic levels are price levels in the forex chart that work as support and resistance but change with the price level. In forex trading, investors should consider appropriate support and resistance levels from where the price may reverse. Therefore, in any trading strategy, the success depends on how investors are utilizing these levels.
When we speak about support and resistance levels, we mean a specific horizontal line or a zone in the price chart. When the price reaches that zone, we will wait for appropriate candlesticks and enter the trade. But the main drawback of the static level is that it is fixed and does not move with the price. On the other hand, the dynamic level is not fixed. So let’s have a look at how it works.
What is dynamic level?
It is a support and resistance level that moves with the price. For an uptrend, the support level remains below the price and moves up. Similarly, in a downtrend, the dynamic resistance remains above the price and moves lower. In this way, we can see how long the price may move by measuring the strength of dynamic level and static level.
One of the most significant examples of this level use is the moving average — the average price of the last candles. So, for example, if you set the previous number of candles as 20, the moving average will show the average price of the previous 20 candles.
In the price chart, as long as the price remains above the moving average, we can say that buyers are vital at a price. Later on, if the price comes to the dynamic level and shows some rejection, the moving average will act as a support level.
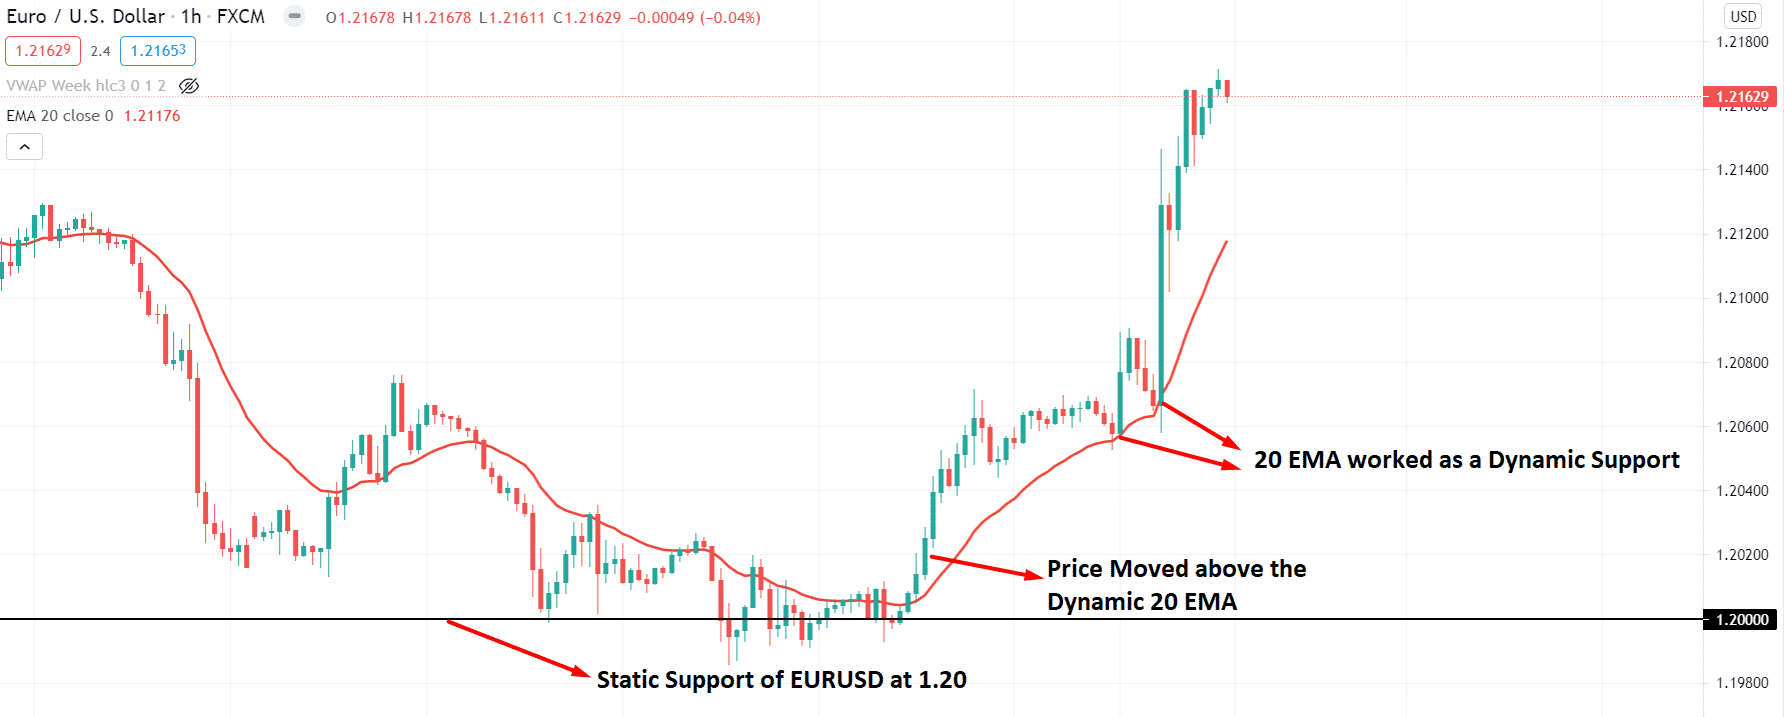
Here we can see the hourly chart of EUR/USD where the price reached 1.20 critical support level. Later on, the price became very corrective and showed buyers interest as soon as it moved above the dynamic 20 EMA. After the price correction, 20 EMA worked as support to the price.
The same scenario applies to the bearish market, as shown in the image below:
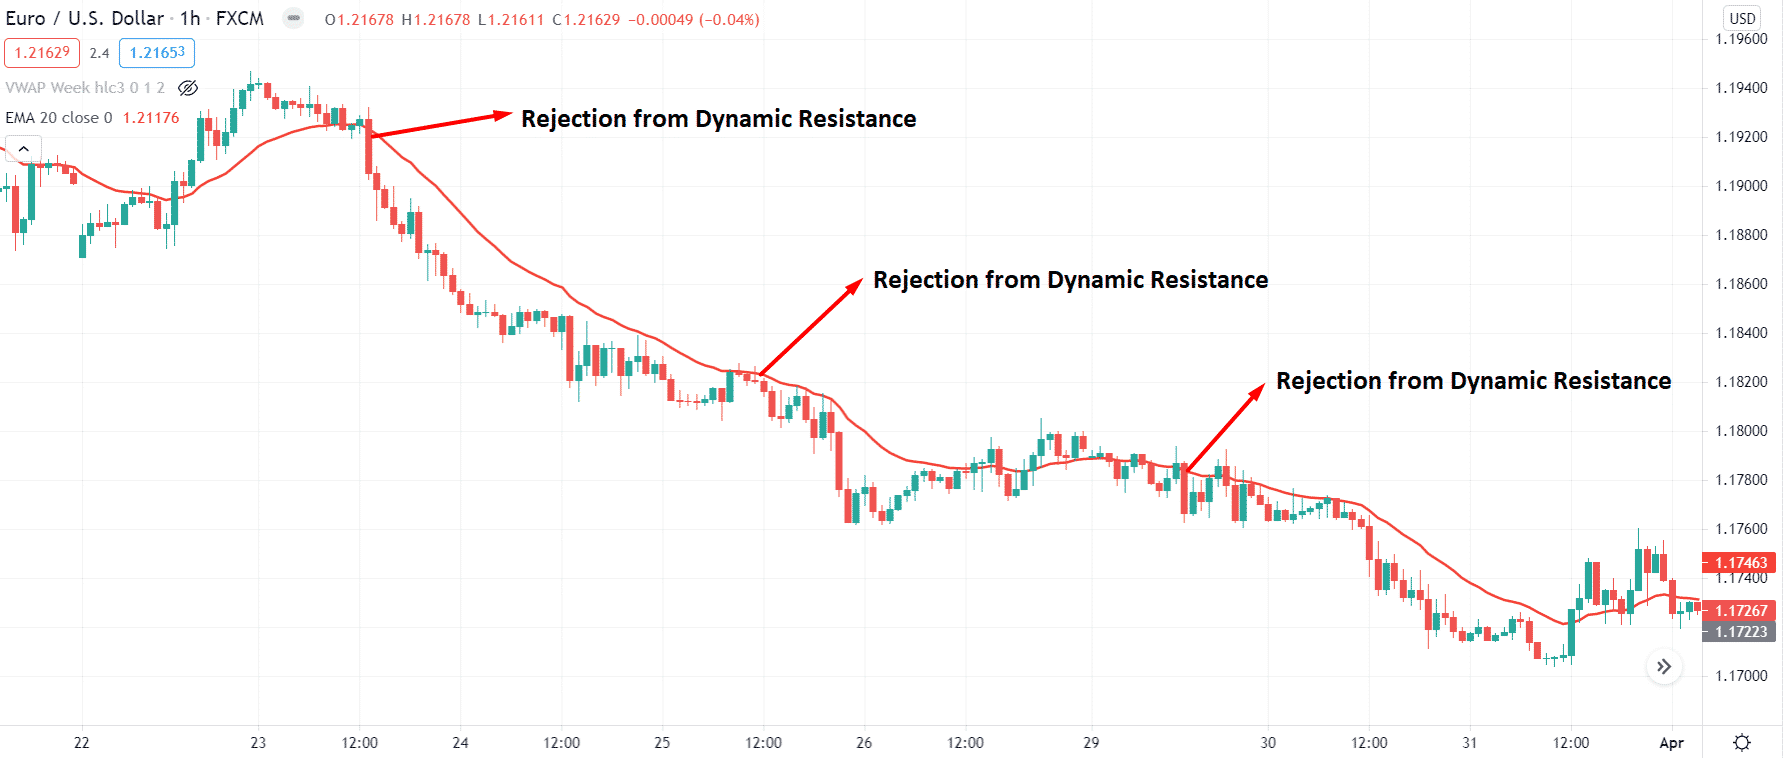
Here we can see that the price is moving lower, and the selling pressure increased after the rejection from dynamic 20 EMA.
Dynamic vs. static level: major differences
Many traders confuse the dynamic and static levels, while many argue that static levels are more critical dynamic levels. If you know some fundamental differences between static and dynamic levels, you can generate better trading analysis. Let’s have a look.
| Dynamic level | Static level |
| Dynamic level moves with the price. | The static level remains in a specific zone. |
| It would help if you used indicators to spot dynamic levels. | You don’t need any indicators to spot static levels. |
| It works well in trend continuation. | Static level works well in a trend reversal. |
| One of the significant examples of a dynamic level-based trading strategy is Golden Cross. | Static levels are substantial in price action trading. |
| This level shows the most recent price action. | This level is fixed, and investors can anticipate the price without knowing the most recent price action. |
Despite the differences, investors should use both of them to get the ultimate output. When the price action supports both dynamic and static levels, it will provide more reliable results.
The essential use of dynamic levels in forex
This section will see some essential use of dynamic levels that may enrich your trading expertise. There are many trading strategies with dynamic levels, and from them, we have picked some best use:
Dynamic and static level together
As we have discussed in the above section, the best use of dynamic levels is with static levels. Our main aim is to anticipate the price direction we should predict most of the time in trading. Therefore, we often use multiple confirmations from different strategies or indicators, and this system is the same.
Let’s have a look at a practical example regarding how to use these levels together:
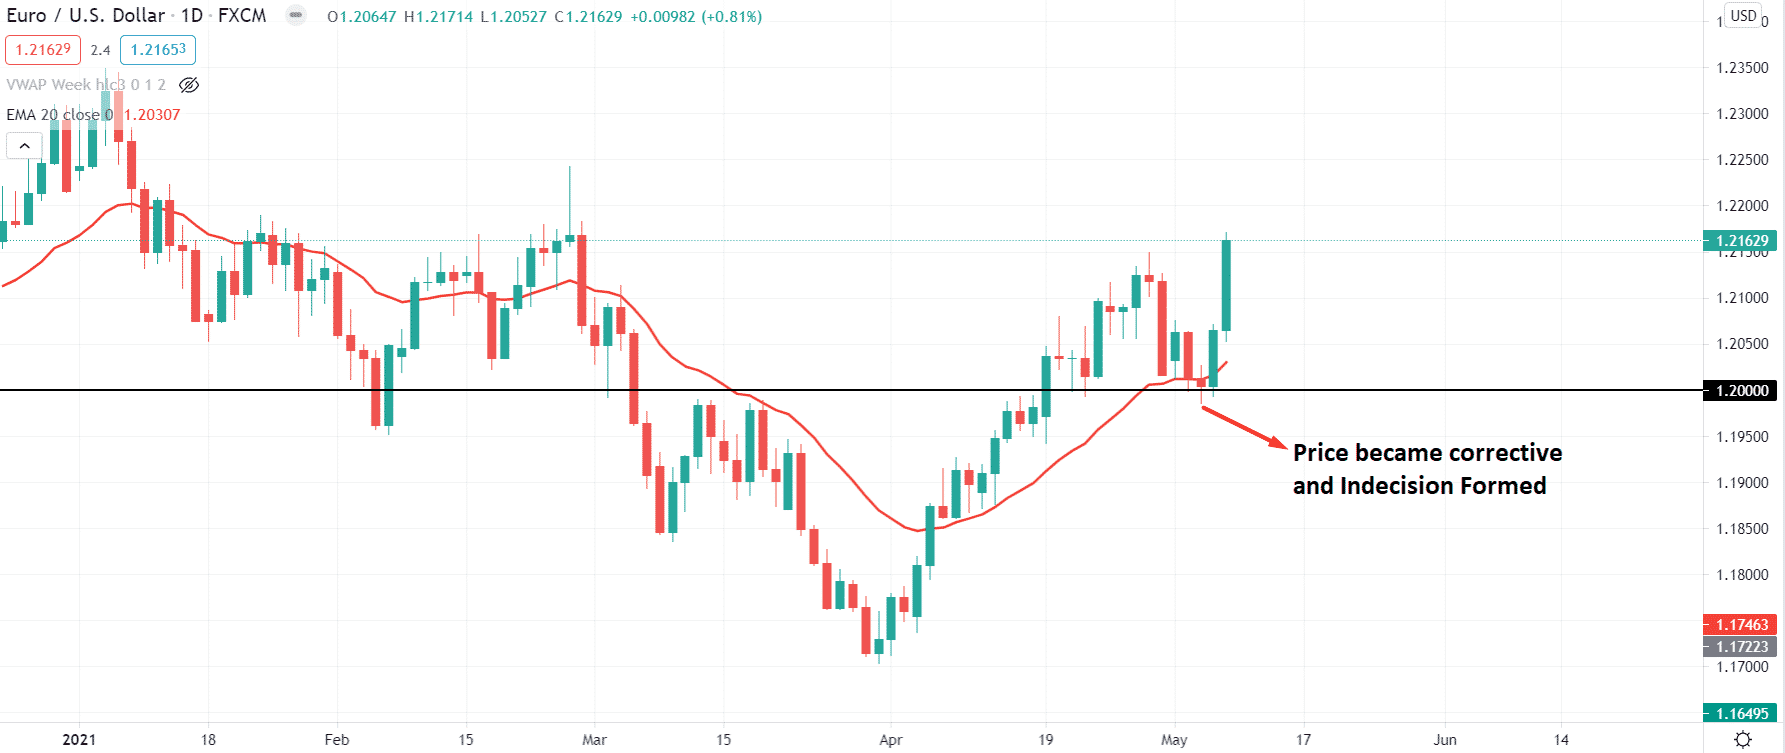
Here we can see that the price corrected lower to the static support level and indecision formed. It means sellers become weaker as the price reaches the support level. In this situation, we will consider only buy trades, and to take buy trades, we will use dynamic 20 EMA.
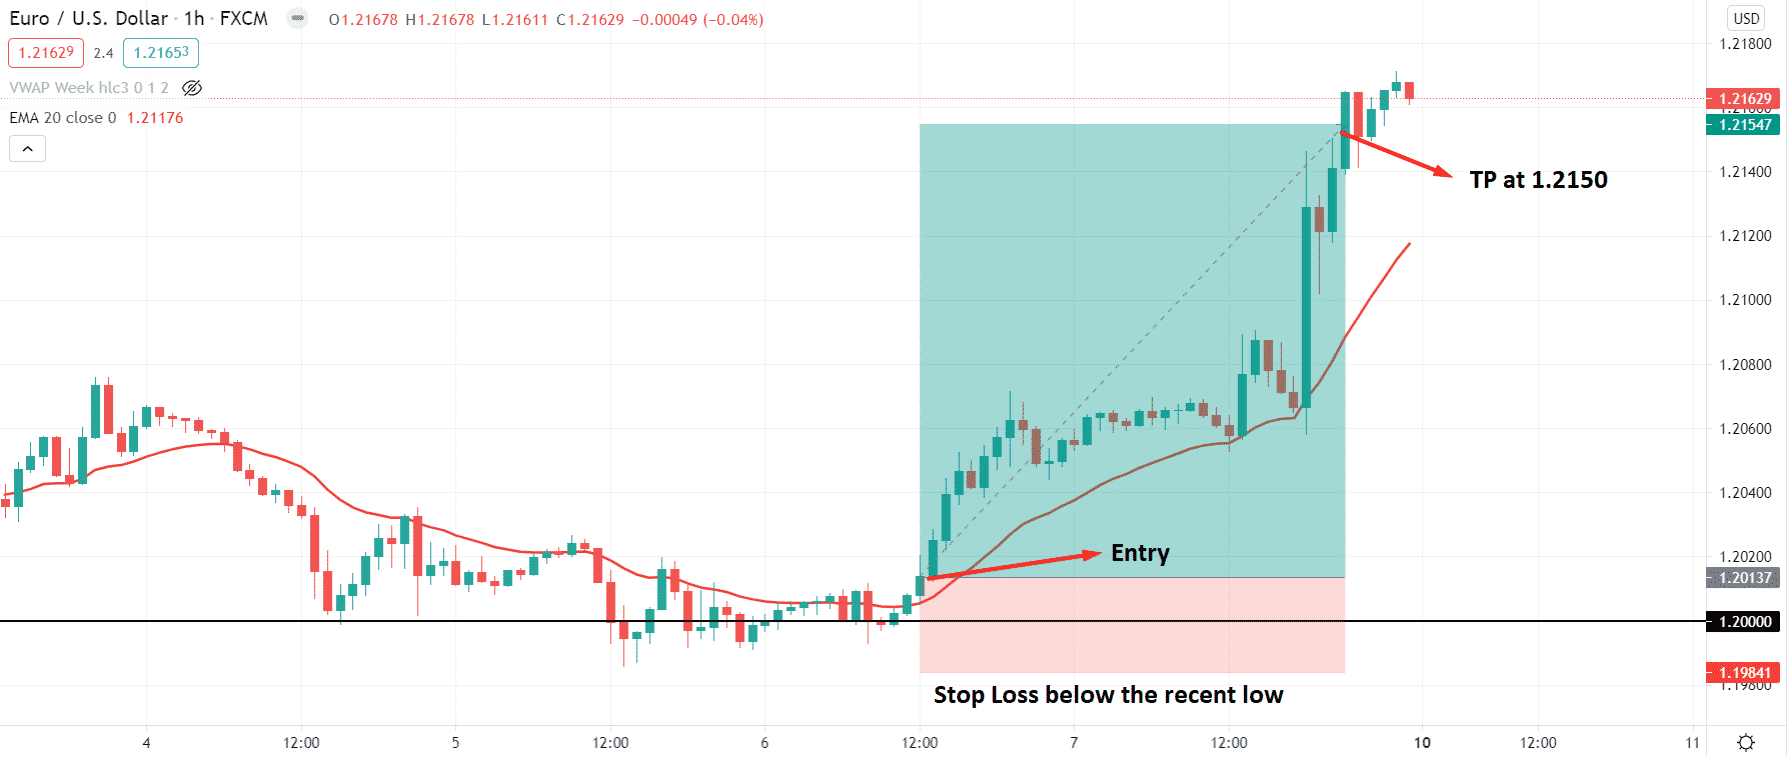
When a candle moves above the dynamic level, the trader should move to the H1 timeframe and open a buy position. The stop loss level is below the most recent low and takes profit at the next static resistance level.
Mean reversion technique
In an uptrend, the price moves up by creating higher highs, and in a downtrend, the price moved down by creating lower lows. We can anticipate the strength of the trend by observing its speed. Any impulsive movement will make an aggressive higher high or lower low in the chart. On the other hand, the price moves like a ZigZag, where there are corrections after every strong movement.
How can we make profits from a correction?
When the price moves up/down with impulsive pressure, it will create a gap between the dynamic and price levels. This is because the dynamic level does not want to stay away from the price in the long term.
In this situation, if the price moves aggressively to any static support/resistance level, we can expect that it will reverse towards the dynamic level as a mean reversion.
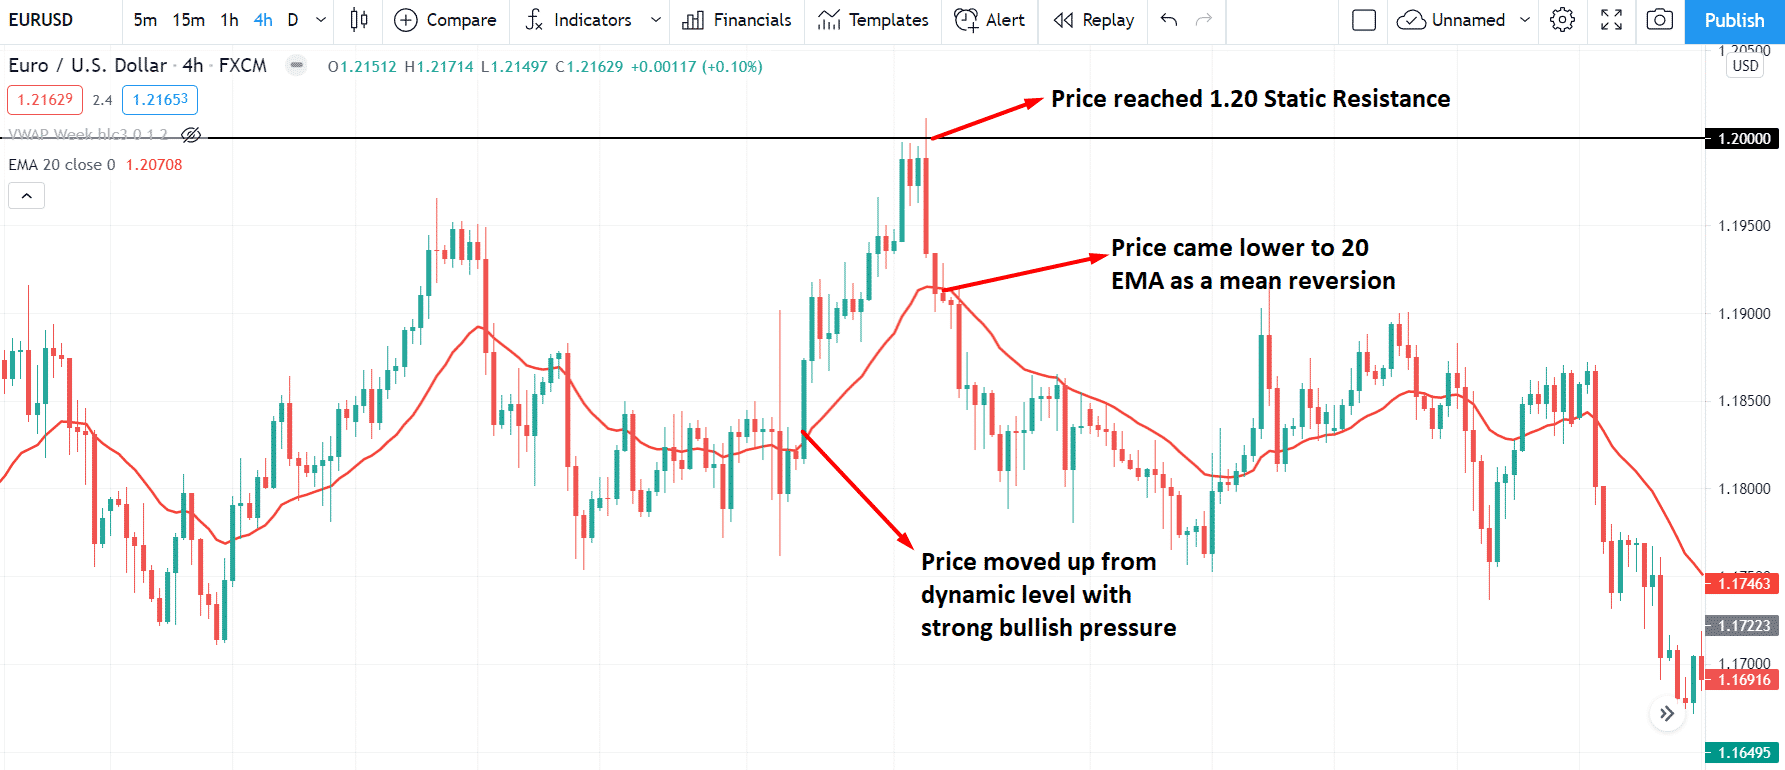
The above image showed how the price moved above the dynamic level and reversed as a mean reversion.
Dynamic level carry
When the price moves within a long bullish or bearish rally, it will carry by the dynamic 20 EMA. So as long as the price gets support/resistance from dynamic levels, you can hold your trade or add more positions.
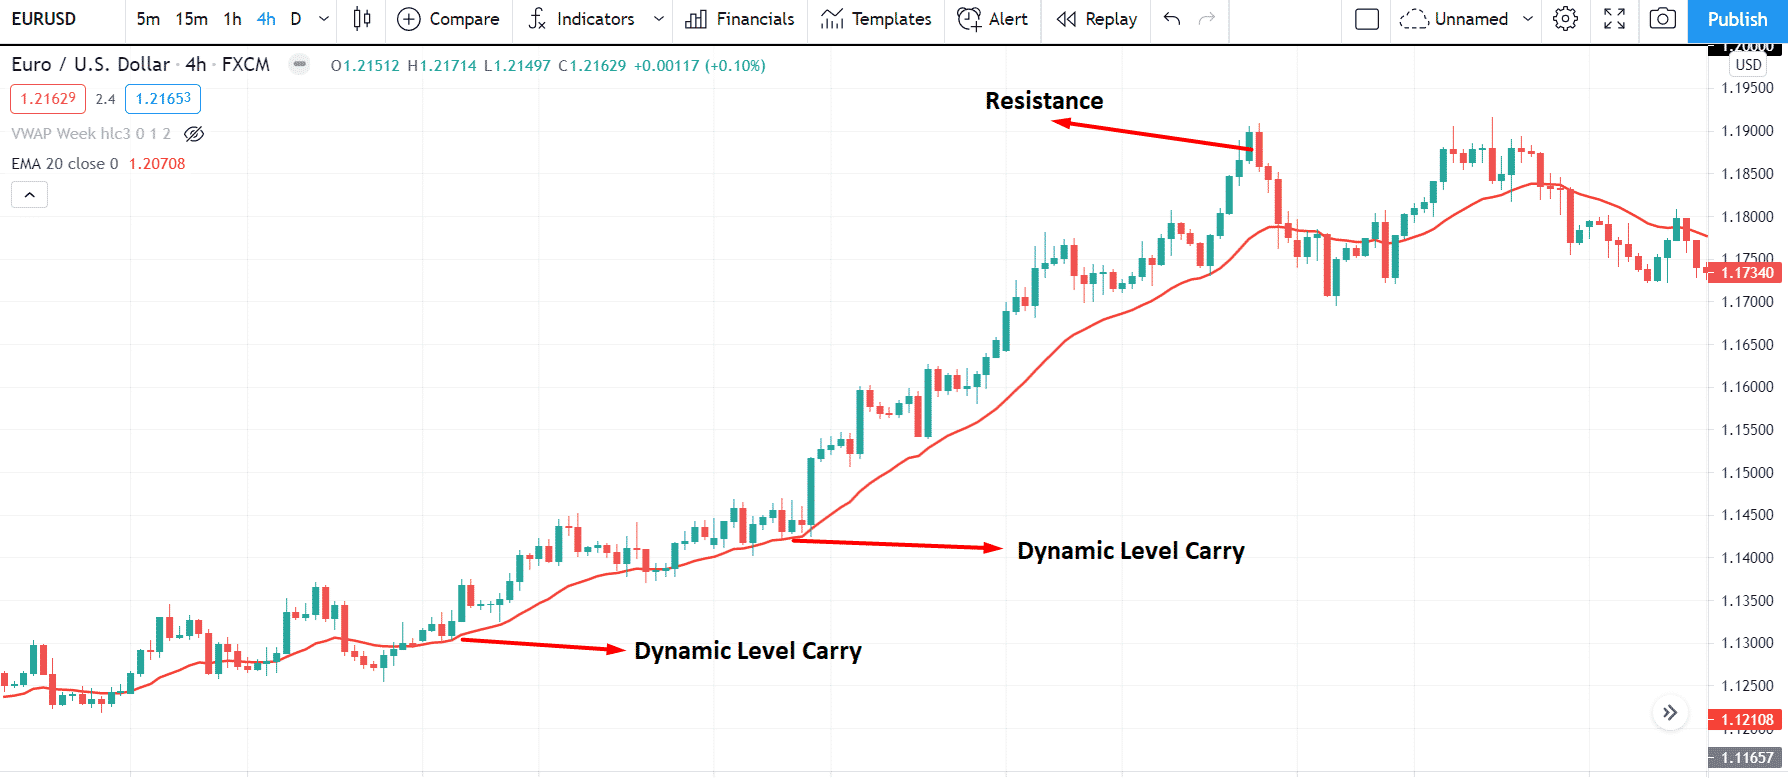
In the above image, we can see how the dynamic level carries the price until it reaches the resistance level.
**Special note: in these examples, we have used 20 EMA as a dynamic level as it works well at a price. However, you can use Bollinger Bands, Parabolic SAR, Tenkan & Kijun Line as dynamic.
Summary
After the above discussion, it is time to make a decision. If you want to build a trading strategy using dynamic levels, you should include static levels for a better result. Moreover, you have to monitor the price action, candlesticks, economic releases, etc., to get a better output.
Besides, there is no alternative to using strong money management in every trading strategy. There are no trading tools that can guarantee you profits. Therefore, you have to manage your trades every time to sustain in the market.