
The forex market operates 24-hours a day during any trading day of the week. Therefore, it enables opportunities for traders to make profits from the marketplace by participating in trades in many durations. Forex traders often seek methods to finish all trading activities during the trading day to avoid overnight holding tensions.
However, there are hundreds of trading methods to apply in day trading, all of them aren’t potent in the same way. Additionally, intraday trading techniques involve scalping, swing trading, chart trading, price action trading, etc. This article will introduce the daily forex chart trading strategies and explanations with chart attachments.
What is the FX daily chart trading strategy?
When you seek to make a career in financial trading as an individual trader, it is mandatory to learn chart patterns. Charts show the price movement over a period, and some standard formations occur in the financial market, repeatedly signaling the exact future prediction about future price movement.
Following those patterns or trading methods that contain using those patterns enable traders to execute constant profitable trade. There are three types of charts that financial traders use: Line chart, bar chart, and candlestick chart. The widely acceptable type is the candlestick chart.
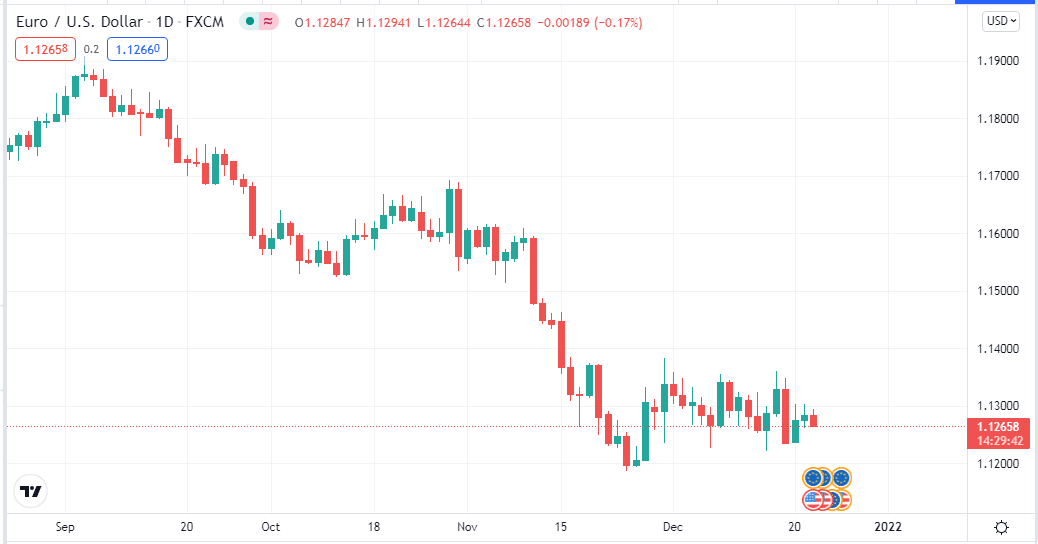
Each price candle contains info about participants’ actions during a particular period. It is easy to obtain market context using chart patterns to traders who know how to read charts or explanations of candle formations. An intraday trading method that uses chart patterns, candle formations, or technical analysis is a forex daily chart trading strategy.
How to identify and trade using chart patterns
When you are observing chart patterns, it is a relatable fact with time frames. Different traders choose different time frames to conduct analysis and execute trades. So standard time frames are available in most trading platforms such as 5min, 15min, 1hour, 4hour, daily, weekly, etc.
You can determine chart patterns by connecting common price points of price candles such as opening, closing, highs, or lows. For example, a scalper may choose a one min chart to seek entry/exit points. Meanwhile, an intraday swing trader may choose a 5-min or 15-min chart. Chart patterns can be as simple as trend lines or complex as double head and shoulder patterns.
Price action traders frequently consider many candlestick formations such as triangle patterns, rectangle patterns, engulfing patterns, double bottom/top patterns, etc., while making trade decisions. Additionally, you can use many technical indicators to participate in most potential trades.
A short-term strategy
This short-term trading method uses three exponential moving averages to determine entry/exit positions. The MA crossover is an easily applicable trading method for many trading instruments. This trading method contains:
- EMA 20 (red)
- EMA 50 (green)
- EMA 100 (blue) lines, and crossovers between these lines generate trade signals.
This trading method suits any currency pair between time frames 1min-hourly. We recommend using a 5minor 15min chart and applying this method on volatile or major currency pairs to get the best results.
Bullish trade setup
Apply those EMA indicators at your target asset chart and seek to place a buy order when:
- The red EMA line crosses above the green EMA line.
- The green EMA line crosses above the blue EMA line.
- The red and the green EMA lines cross above the blue EMA line.
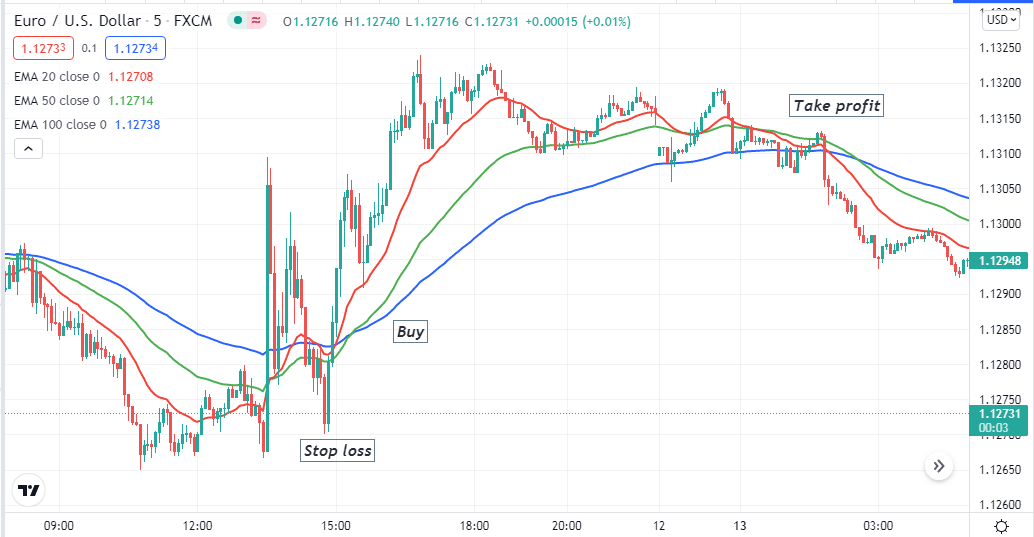
Entry
When these crossovers above occur between those EMA lines, open a buy position.
Stop loss
Place an initial stop loss below the current swing low of those crossovers.
Take profit
Close the buy order when the red EMA crosses below the green EMA, or the green EMA crosses below the blue EMA line.
Bearish trade setup
Apply those EMA indicators at your target asset chart and seek to place a buy order when:
- The red EMA line crosses below the green EMA line.
- The green EMA line crosses below the blue EMA line.
- The red and the green EMA lines cross below the blue EMA line.
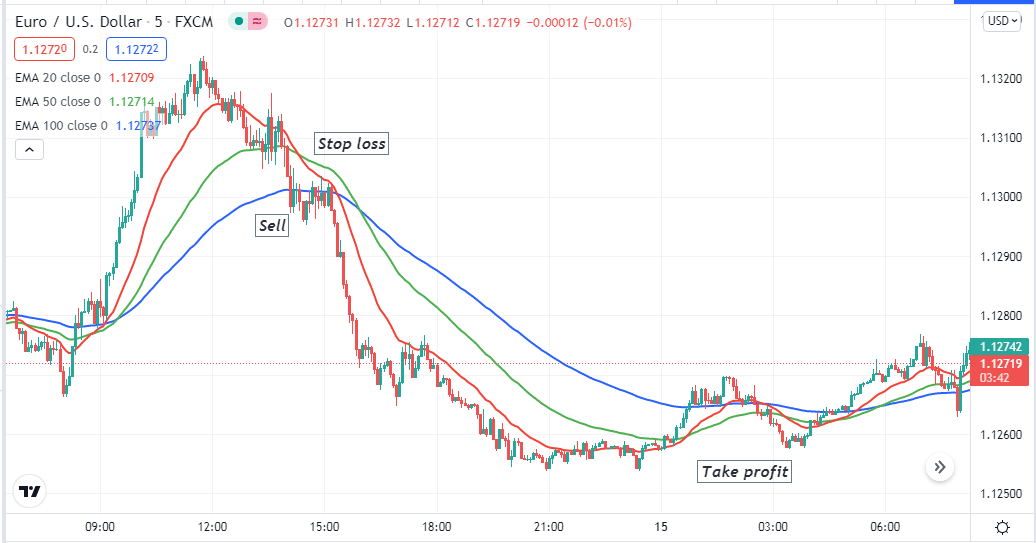
Entry
When these crossovers above occur between those EMA lines, open a sell position.
Stop loss
Place an initial stop loss above the current swing high of those crossovers.
Take profit
Close the sell order when the red EMA crosses above the green EMA, or the green EMA crosses above the blue EMA line.
A long-term strategy
It is a famous trading method, 50-pips a day trading method. You don’t need to use any technical indicator in this trading method. Any currency pair that moves an average of 70-80 pips daily, such as EUR/USD, GBP/USD, etc., suits this trading method. Use an hourly chart to execute trades. Follow the steps below:
- Identify the 7 am GMT candle in your trading instrument chart.
- You can identify that chart by searching on google or asking your broker to sync that with your local time.
- Wait till the 7 am candle completes the formation.
- Place a pending buy and sell above or below the 7 am candle,
- Wait till any of those pending orders are active.
- When any one of your pending orders is active, immediately close the other one.
Bullish trade setup
Confirm the current trend is bullish from upper time frame charts, then wait till the 7 am GMT candle finish formation and place pending buy/sell above and below 2pips that candle.
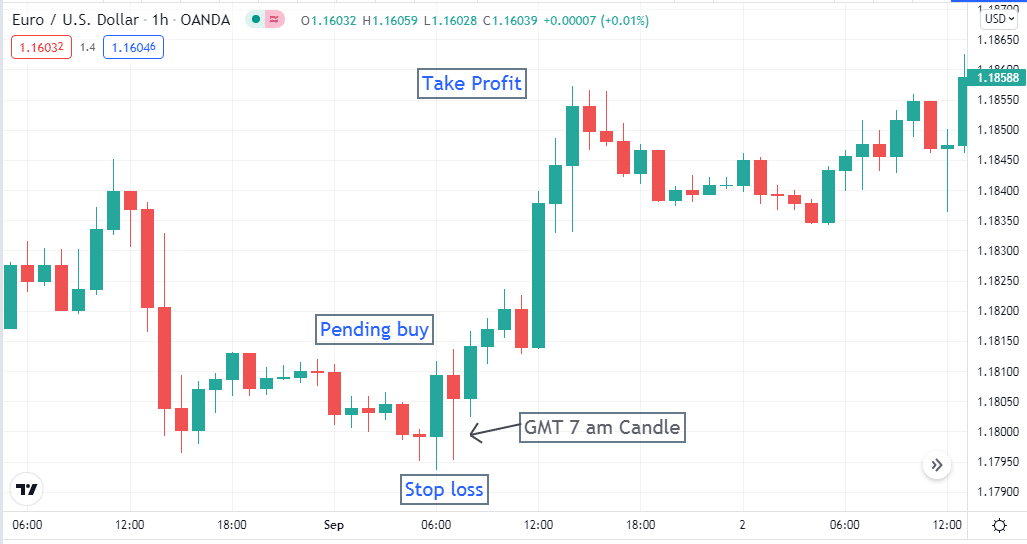
Entry
When the pending buy order is active, immediately close the other pending order.
Stop loss
Place a stop loss below 5-10 pips of the 7 am GMT candle.
Take profit
The initial profit target will be 50 pips above the buy order. Continue the buy order according to the market context, till be bullish pressure remains intact on the asset price.
Bearish trade setup
Confirm the current trend is bearish from upper time frame charts, then wait till the 7 am GMT candle finish formation and place pending buy/sell above and below 2pips that candle.
Bearish setup
Entry
When the pending sell order is active, immediately close the other pending order.
Stop loss
Place a stop loss above 5-10pips of the 7 am GMT candle.
Take profit
The initial profit target will be 50 pips below the sell order. According to the market context, continue the sell order until bearish pressure remains intact on the asset price.
Pros and cons
| Pros | Cons |
| No overnight holding tension. | It is a time-consuming trading process. |
| It allows making frequent trades. | You can lose more than you earn on the previous day. |
| It applies to many currency pairs. | Multiple transaction fees apply to day trading. |
Final thought
There are hundreds of trading methods available on the internet for day trading. Choose the appropriate method according to your trading style, return expectations, capital size, etc. Mastering chart patterns involves achieving some skills to identify and good practicing before applying on live trading.