
The Russell 2000 index represents the small and medium-sized companies from the US, including housing, fin-tech, consumers, finance, and many more. This index shows a clear view of the US economy, and it is said that the Russell 2000 index is the barometer for the US economy.
However, many people wonder how this index has a connection with the US economy. The small-cap industries represent the economic activity within the US. Therefore, any surge in this section indicates an improved domestic economy.
If you are a financial market trader, you should know how the US economy moves and what key factors are working as vital economic drivers. Let’s discuss everything you need to see regarding the Russell 2000 index and the US economy.
Russell 2000: basics
The Russell 2000 includes 2000 smaller companies by market cap from the parent, Russell 3000 index. Moreover, Russell 1000 is another index that tracks another 1000 companies.
Small-cap companies have a tiny share in the US stock market compared to larger caps. In particular, the Russell 2000 index represents only 10% of the US economy in terms of market capitalization, while the Russell 1000 represents more than 90% of the US economy.
FTSE Russel group analyzes company data to determine which company should include in the Russell 2000 index. Moreover, they evaluate the performance in May each year to regroup Russell indexes. The company’s size and business operation play an important role while determining and placing positions in indexes.
Based on annual ranking, companies go public through Initial Public Offering (IPO) and qualify their position to remain at the Rissell 2000 index quarterly. As a result, you may see more than 2000 companies in the Russell 2000 index.
Small-cap vs. large-cap: key differences
Investors can distinguish the large-cap and small-cap through market capitalization or the market value. The large-cap represents shares in substantial companies, while small-cap stocks represent companies with lower market capitalization.
Although both of these shares represent the ownership of businesses, the difference came from the company size that directly affects the trading portfolio. Let’s see some key differences.
| Small-cap companies | Large-cap companies |
| Market value is between $250 million to $2 billion | Market value is above $10 billion |
| Less stable and high volatile | Less volatile and more stable |
| Highly potential for future growth | Have less potential for future growth |
| Usually, pay dividends | Not likely to pay dividends |
How Russell 2000 indicates the US economy
Growth engine
Most of the company’s involvement in this index covers an extensive breadth of stock, not “micro-cap.” Therefore, these companies have many potentialities that allow analysts’ to do better and effective forecasting.
The New York Stock Exchange (NYSE) and NASDAQ focused on the technology sectors that missed the small and medium-sized companies. Therefore, the Russell 2000 index’s rise represents that day-to-day business has increased throughout the US.
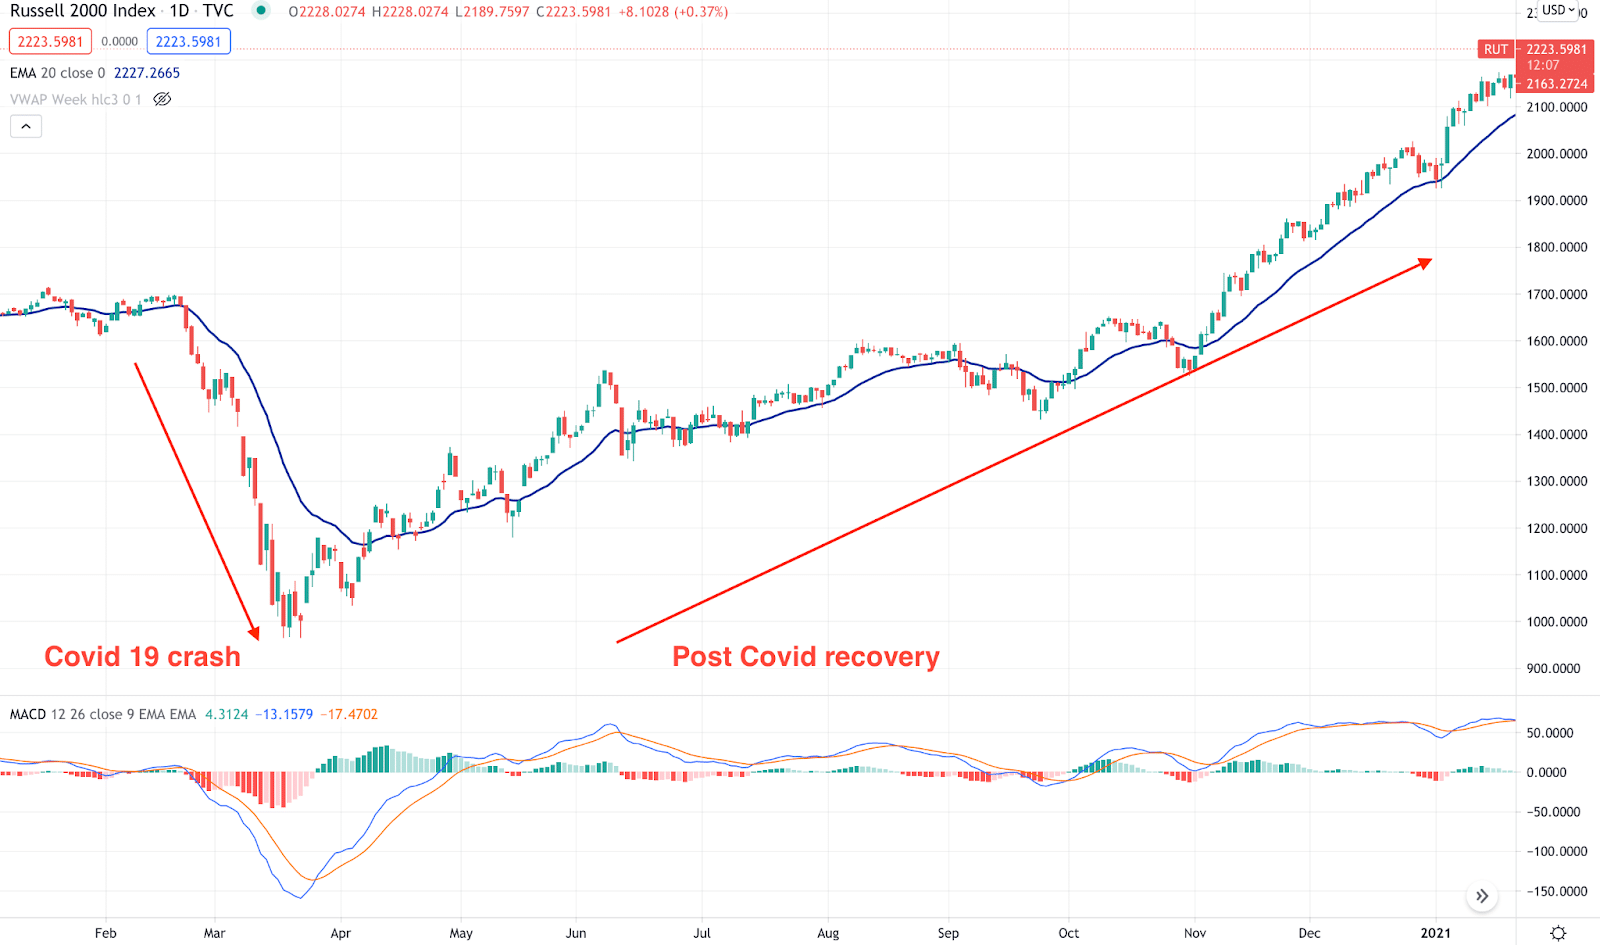
The above image is the perfect example of how the Russell 2000 index indicates the economic activity within the US. During the Covid-19 pandemic, most of the US indexes moved low, including all Russell indexes. However, after making the bottom, prices started to move up and already made new highs.
Russell 2000: correlation with GDP
The index has a strong relationship with the US GDP. If the GDP expands, the index starts to outperform large-cap stocks. Moreover, you can see this outperformance every quarter while the contract period ends. Conversely, you may see Russell 2000 move lower with the falling GDP.
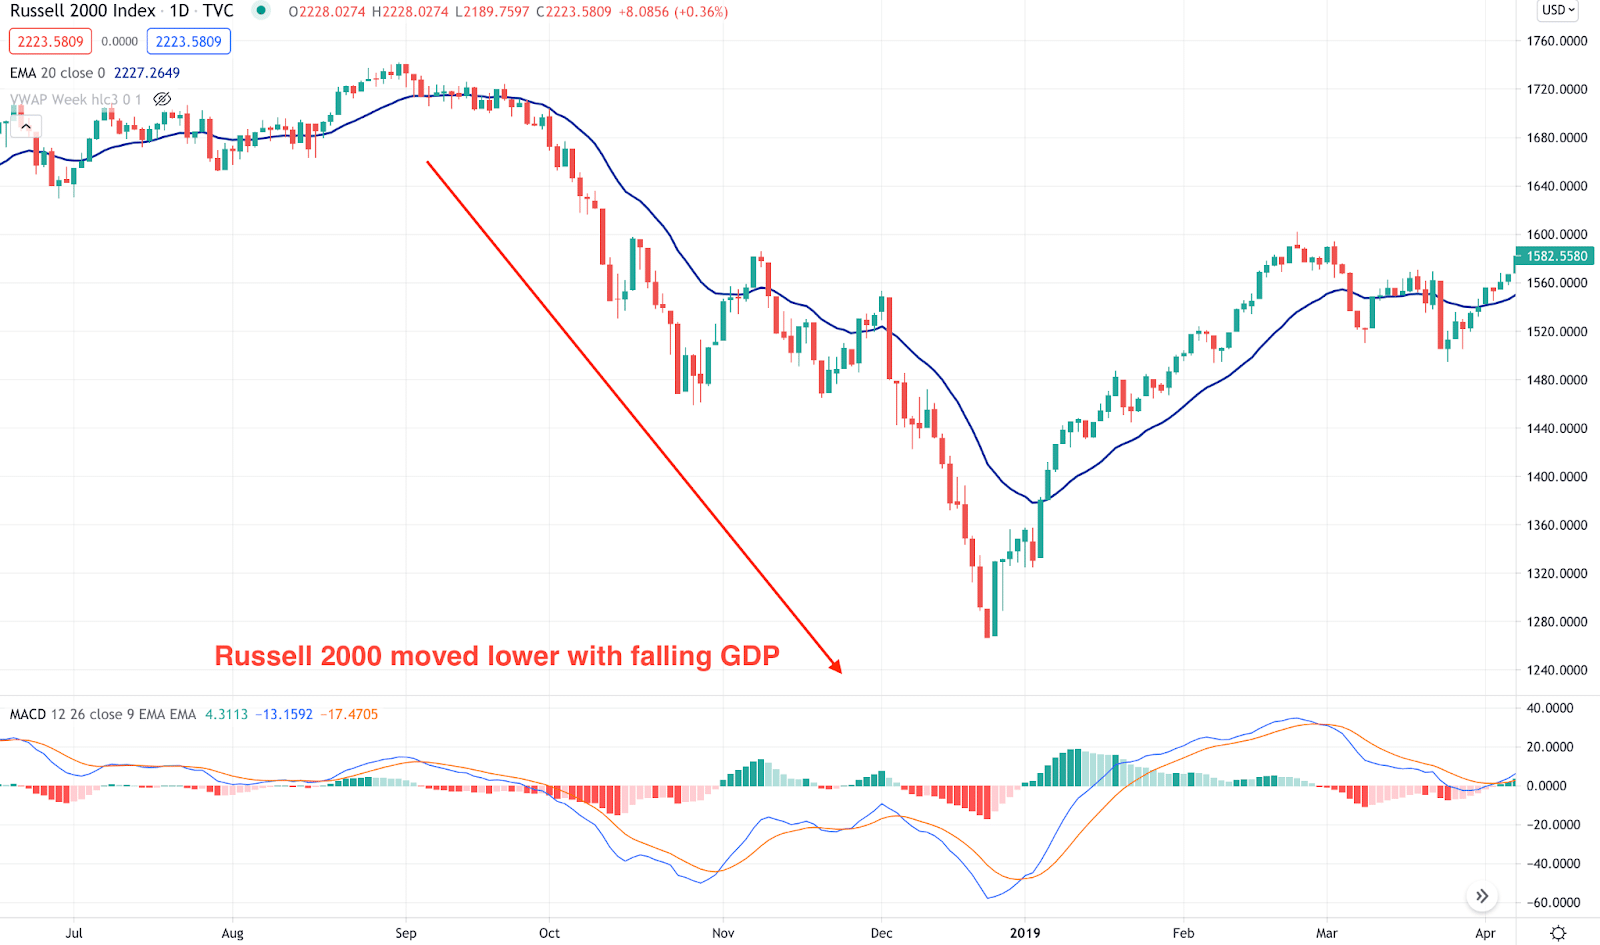
The above image shows how the index moved lower with two consecutive falling GDPs in 2018.
Furthermore, there is another correlation between the large-cap and small-cap indexes. When the large-cap index moves aggressively higher, investors focus on small caps to increase the “beta” to maximize returns.
Access through futures
Investors can access the Russell 2000 index in CME Group so that they can trade the small-cap companies. Moreover, there is an opportunity of investing in micro E-mini futures, which is 1/10th of the E-mini contract. If you have less cash, you can quickly join and start trading in the E-mini Russell 2000 contract with a lower margin.
The broader acceptance of the index may make it a perfect barometer for the US economy. Moreover, it will help the index respond to regular fundamental releases, like interest rate, GDP, etc.
Pros and cons of trading in Russell 2000
Now we will see some benefits and drawbacks of this index that may help you taking trading decisions:
Pros
- Small-cap companies have more room to grow, and they may outperform large-cap companies.
- The small-cap investment provides a return of roughly 10% in a year.
- The index perfectly correlates with GDP. Thus, any surge in the GDP puts buying pressure on the index. Similarly, a weaker GDP harms small-cap companies.
- The index works as a barometer to the US economy. Therefore, investors closely look at this index to understand the domestic US economy.
Cons
- Not all Rusell-2000 companies are highly potential.
- Company information is not publicly shown, which makes analysis often tricky.
- Small-cap companies are not famous and are well-known among investors.
- Investment in small-cap is riskier than large-cap.
Final thoughts
This index works as an essential economic barometer to the US economy. Moreover, there is the opportunity of gaining more than double or triple in a year from small-cap investment. Besides, there are some risks that you should consider before investing in indexes like Russell 2000.
The best approach is to diversify the trading portfolio in both large-cap and small-cap. First, invest in some large-cap companies to ensure a potentially high profit from the market. Later on, move to small-cap companies to find the opportunity to earn better, with proper risk management.

