
Technical indicators help traders to learn the market info. Implied volatility is a unique factor and popular among crypto-traders for using this concept while making trade decisions. So no wonder traders use many technical indicators to obtain the market data and predict the future price movements of trading instruments.
However, without learning the components of any indicator, it is hard to create any sustainable strategy using it. This article will introduce you to the Implied volatility indicator and remarkable trading methods using it. Later, we will list this indicator’s top three pros and cons to understand its potential.
What is Implied volatility?
Volatility is simply the amount of asset price that fluctuates and doesn’t bother about the direction of the price movement. Traders usually consider two types of volatilities while making trade decisions:
- Historical volatility (HV)
- Implied volatility (IV)
As the textbook says, the historical volatility measures or annualizes the standard deviation of historical price movement for any trading instrument. Meanwhile, the implied volatility is what the marketplace “implies” that the price will be in the future depending on the price change of a trading asset.
It also shows results as the historical volatility on an annualized basis. The central fact makes the Implied volatility more attractive to the retail options traders than the historical volatility for its forward-looking feature. The IV depends on the supply-demand concept of any asset, and the reading usually increases on declining price movements and decreases on bullish price movements. Implied volatility qualifies the uncertainty and sentiment by depending solely on price movement while ignoring all other fundamental facts.
How to identify trading points through IV?
Investors use the implied volatility to predict the future direction of price movement as it estimates future price fluctuations depending on several predictive factors of market context. It typically expresses the market context using the standard deviation and percentages over a particular time horizon.
This indicator doesn’t predict the direction of the price movement. For instance, high volatility means significant price swings on the upside or the downside. Meanwhile, low volatility means an unpredictable change or consolidation phase of the price movements. You can use this concept in crypto trading. When the IV detects significant volatility, use other supportive indicators to determine the direction and enter the market according to the price direction.
A short-term trading strategy
In this method, we use a unique custom indicator, “Implied volatility suit,” that uses four different types of data:
- Implied volatility
- Implied volatility percentile
- Implied volatility rank
- Skew index
When the IV rank is high, or the line is green, it indicates that the future volatility will decrease, and conversely, when the line becomes red, or the rank reading is low, it assumes that the future volatility may increase.
Calculation occurs in two ways:
- Model-based
- VixFix
You can change or modify the parameters according to your desire. We use the Parabolic SAR as a supportive indicator in this method. We recommend using a 15-min or hourly chart to obtain the most potent short-term trading positions through this trading technique.
Bullish trade scenario
This method suggests opening a buy position when:
- The IVS line becomes red and slopes upside near the green zone.
- The Parabolic SAR dot starts making series on the bottom of price candles.
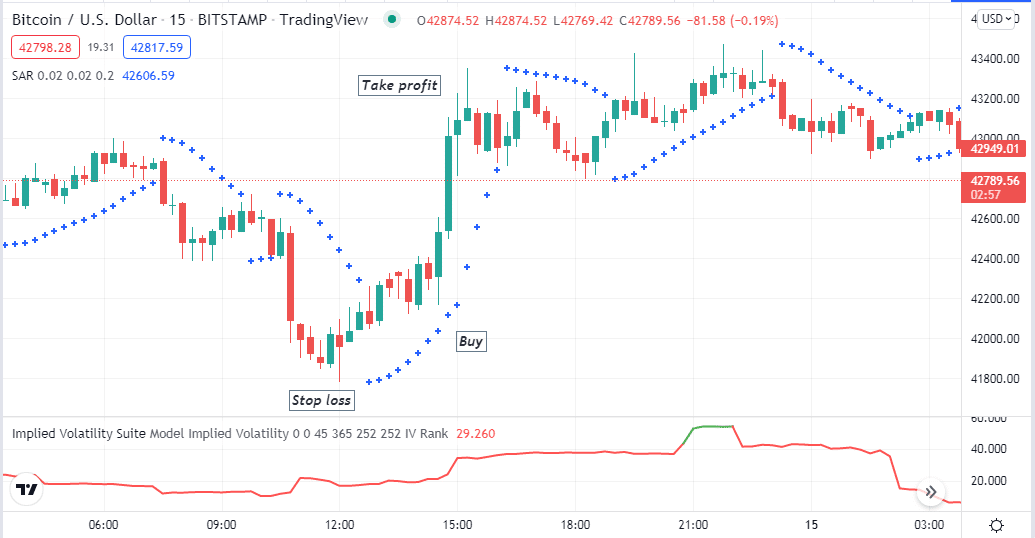
Entry
When these conditions match, it declares a bullish pressure on the asset price and signals opening a buy order.
Stop loss
Place an initial stop loss below the recent swing low with a buffer of 5-10pips.
Take profit
Close the buy order when:
- The IVS line becomes green after reaching near upside.
- The Parabolic SAR dots switch above the upside of price candles.
Bearish trade scenario
This method suggests opening a sell position when:
- The IVS line becomes green and slopes on the downside near the red zone.
- The Parabolic SAR dot starts making series on the top of price candles.
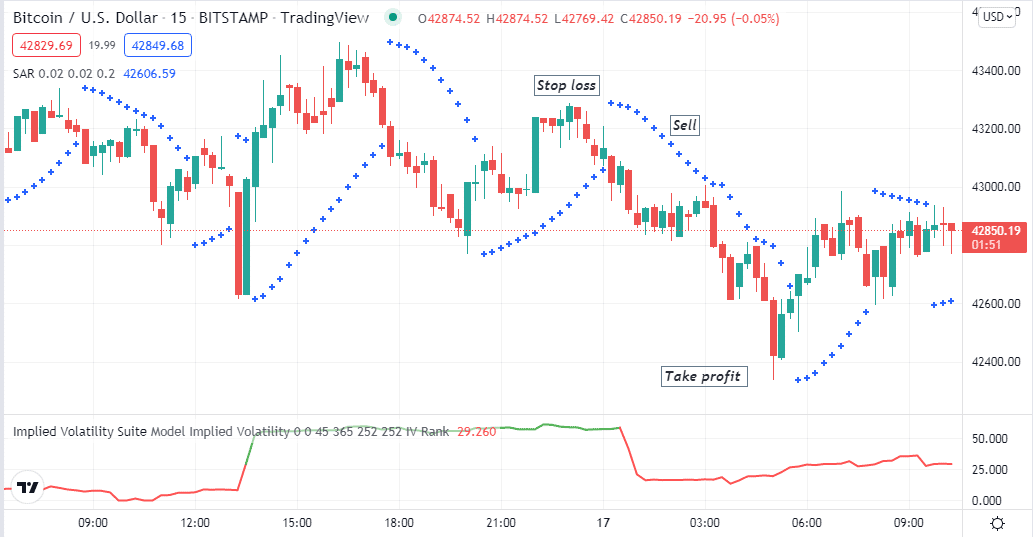
Entry
When these conditions match, it declares a bearish pressure on the asset price and signals opening a sell order.
Stop loss
Place an initial stop loss above the recent swing high with a buffer of 5-10pips.
Take profit
Close the sell order when:
- The IVS line becomes red after reaching near downside.
- The Parabolic SAR dots switch below the downside of price candles.
A long-term trading strategy
In this strategy, we use a custom-made indicator IVP that measures the Implied volatility in this trading method. It shows reading on an independent window that contains two dynamic lines.
The green line is the IV rank, and the yellow line is the % of days. The calculation of this indicator depends on the daily return of the price using a standard deviation. The green line or the IV rank depends on high/low volatilities over a specific period. The default parameter is 252, the number of total trading days in a year. After that, it calculates the IV by comparing highs and lows.
If you are not interested in looking back at the whole year’s data, you can change the parameter. We use EMA 10 (red) and EMA 20 (blue) crossover alongside the IVP indicator. It is a suitable method that suits a D1 or above time frame chart.
Bullish trade scenario
Seek to open buy positions when:
- The red EMA crosses the blue EMA on the upside.
- Both dynamic lines of the IVP window are near the top and start moving on the downside.
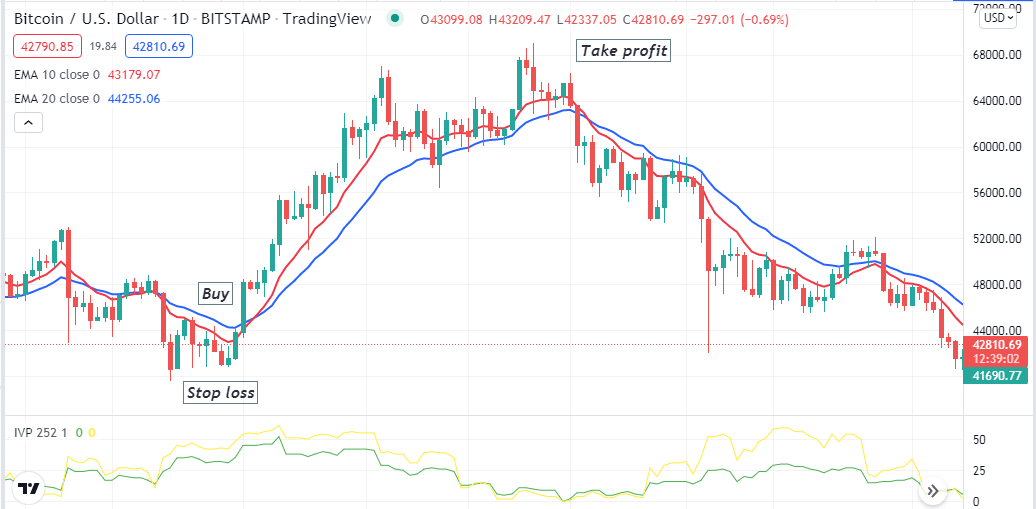
Entry
When these conditions above match your target asset chart, it declares potential bullish pressure on the asset price to open a buy position.
Stop loss
Place a reasonable stop loss below the bullish momentum.
Take profit
Close the buy order when:
- The red EMA crosses below the blue EMA.
- The dynamic lines reach near the bottom side of the IVP indicator window.
Bearish trade scenario
Seek to open sell positions when:
- The red EMA crosses the blue EMA on the downside.
- Both dynamic lines of the IVP window are near the bottom and start moving on the upside.
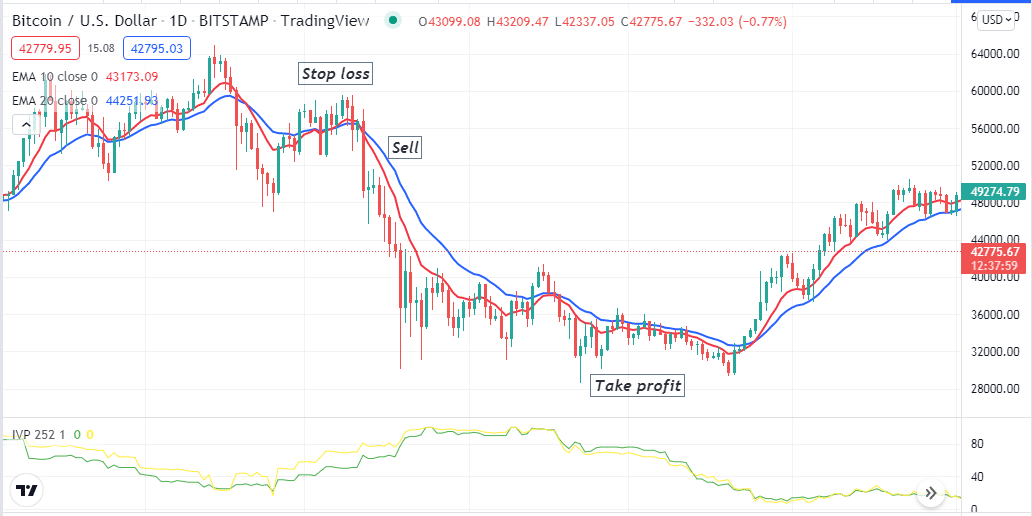
Entry
When these conditions above match your target asset chart, it declares potential bearish pressure on the asset price to open a sell position.
Stop loss
Place a reasonable stop loss above the bearish momentum.
Take profit
Close the sell order when:
- The red EMA crosses above the blue EMA.
- The dynamic lines reach near the top side of the IVP indicator window and start sloping downside.
Pros & cons
| Pros | Cons |
| It helps to set option prices. | It only depends on prices while ignoring fundamental facts. |
| It determines many trading strategies. | It is sensitive to fundamental factors. |
| It qualifies uncertainty and market sentiments. | It is helpful to predict future movement but not the direction. |
Final thought
The IV is a sensitive factor in determining profitable trading positions. When you can master the whole concept, you can avoid buying any overpriced trading instrument and selling any underpriced asset.


