 Crypto Strategy")
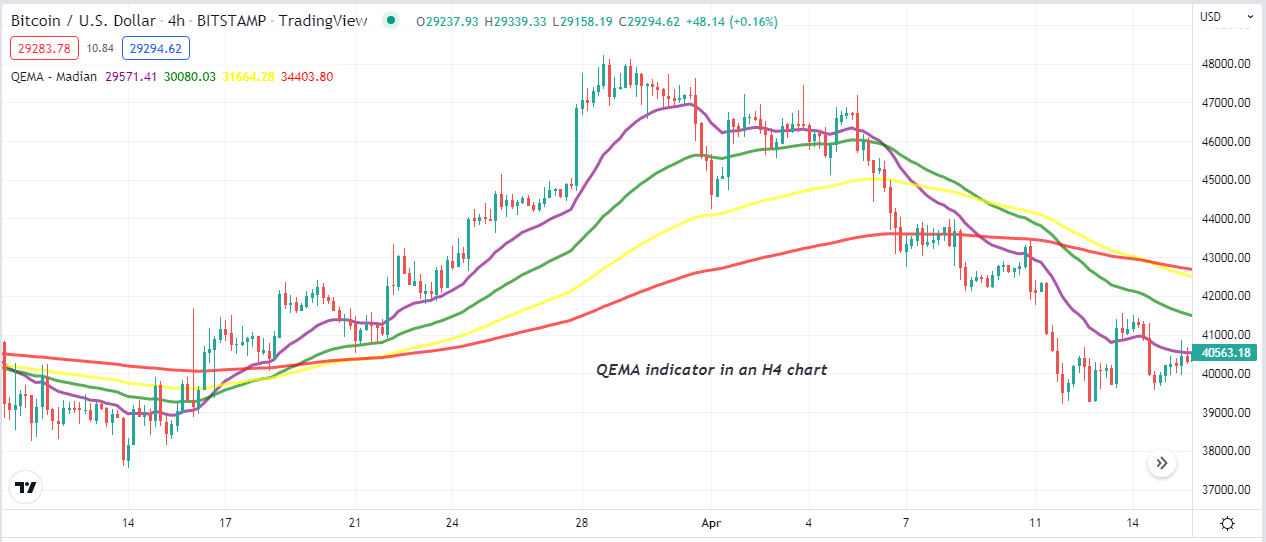
Quadruple Exponential Moving Average or QEMA is a unique indicator that calculates the percentage of some EMA lines to obtain the market context. Financial investors frequently use this indicator for its efficient results. So it makes sense that crypto investors rely on this indicator while making trade decisions.
However, the QEMA uses a unique calculation, so it is mandatory having a particular level of understanding while utilizing this indicator in crypto trading. This article enlightens the QEMA indicator alongside describing sustainable crypto trading strategies using this indicator with chart attachments to understand better.
What is the QEMA indicator?
This tool contains four MAs, and investors use crossovers between those EMA lines to generate trade ideas:
- EMA 20 (purple)
- EMA 50 (green)
- EMA 100 (yellow)
- EMA 200 (red)
This concept is widely accepted as it can generate constantly profitable trade ideas on any trading instrument. You can find this indicator on many trading platforms or manually implement this concept.
How to use the QEMA indicator in crypto strategy?
The tool is straightforward and uses the EMA crossover concept to generate trade ideas. When the EMA line of a short period crosses an EMA line of a more significant period declares the initiation of bullish momentum and vice versa as the QEMA indicator uses four different EMA lines.
Hence, investors mark at least two crossovers to confirm the momentum before entering trades. For example, when the purple and green EMA lines cross the yellow EMA on the upside, it declares positive price pressure on the asset price and vice versa.
Short-term trading strategy
In this short-term trading method, we use the parabolic SAR indicator, a supportive technical tool alongside the QEMA indicator. First, we determine the swing points and trend direction using the QEMA indicator and then confirm the reading with the parabolic SAR before entering any trade. This strategy suits many time frame charts; we recommend using an hourly or at least 15 min chart to determine short-term trading positions.
Bullish trade scenario
Implement both indicators at your target asset chart and seek to open buy positions when the scenarios below appear:
- The purple EMA line crosses above the green EMA line.
- The purple and the green EMA lines reach above the yellow EMA line.
- The purple, the green, and the yellow EMA lines cross above the red EMA.
- The Parabolic SAR dot takes place below price candles and starts making a series.
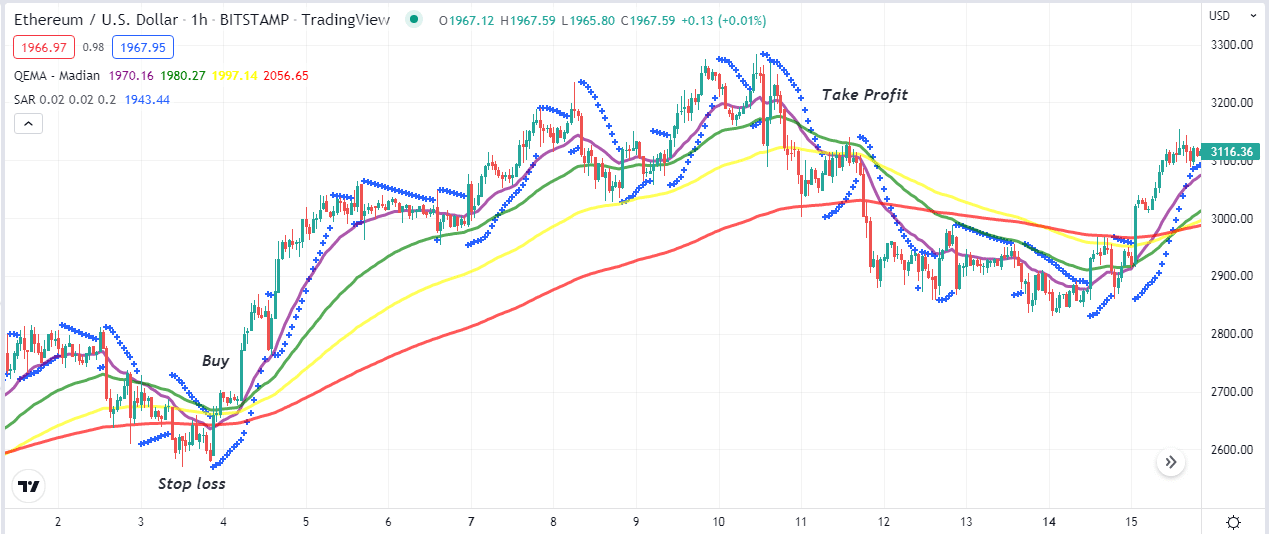
Entry
When these conditions above match, your target asset chart usually indicates a potential bullish momentum. Enter a buy order.
Stop loss
Set an initial stop loss below the current swing low with a buffer of 5-10pips.
Take profit
Close the buy order matching the conditions below:
- The purple EMA line crosses below the green EMA line.
- Both the purple and green EMA lines reach below the yellow EMA line.
- The parabolic SAR dots switch above price candles.
Bearish trade scenario
Implement both indicators at your target asset chart and seek to open sell positions when the scenarios below appear:
- The purple EMA line crosses below the green EMA line.
- The purple and the green EMA lines reach below the yellow EMA line.
- The purple, the green, and the yellow EMA lines cross below the red EMA.
- The Parabolic SAR dot takes place above price candles and starts making a series.
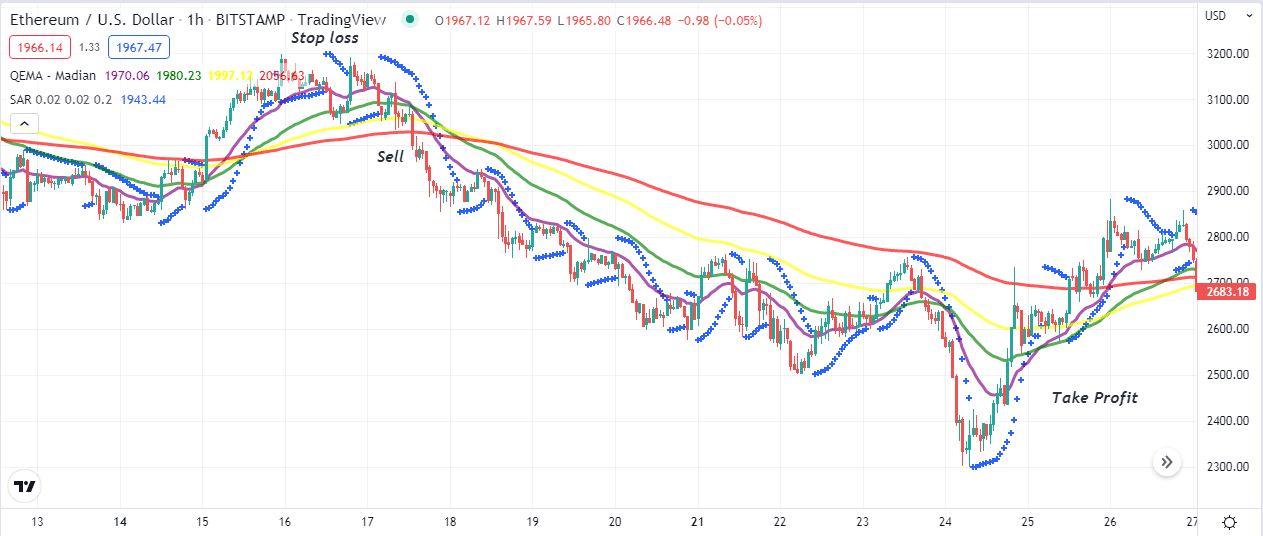
Entry
When these conditions above match, your target asset chart usually indicates a potential bearish momentum. Enter a sell order.
Stop loss
Set an initial stop loss above the current swing high with a buffer of 5-10pips.
Take profit
Close the sell order matching the conditions below:
- The purple EMA line crosses above the green EMA line.
- Both the purple and green EMA lines reach above the yellow EMA line.
- The parabolic SAR dots flip below price candles.
Long-term trading strategy
This trading strategy combines the QEMA and MACD indicators to generate trade ideas. The MACD indicator results in an independent window containing two dynamic signal lines, a mid-level, and histogram bars of different colors on both sides of the central line. We recommend using this trading method on an H4 or D1 chart to catch the most potent long-term trades.
Bullish trade scenario
Match the scenarios below when opening a buy order:
- Both the green and purple EMA lines come above the yellow EMA.
- The dynamic blue line gets above the dynamic red line at the MACD indicator window.
- MACD green histogram bars take place above the central line.
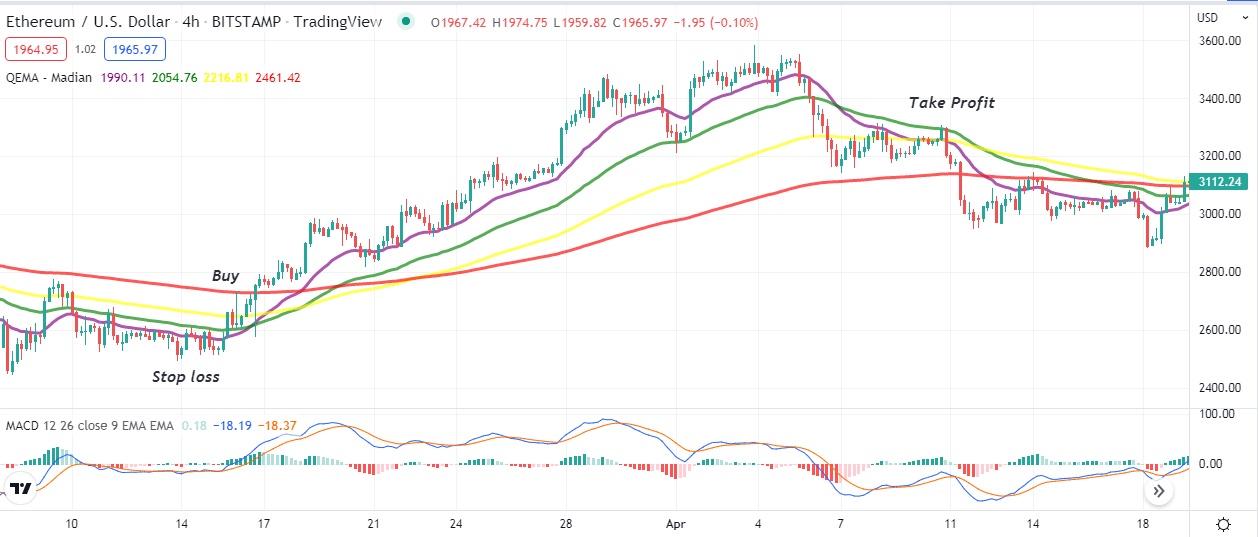
Entry
Match these conditions above to confirm the bullish momentum and open a buy order.
Stop loss
The initial stop loss for your buy order will be below the current bullish momentum.
Take profit
Close the buy order when the scenarios below occur:
- Both the purple and green EMA lines reach below the yellow EMA line.
- The dynamic blue line crosses below the dynamic red line at the MACD indicator window.
- MACD red histogram bars take place below the central line.
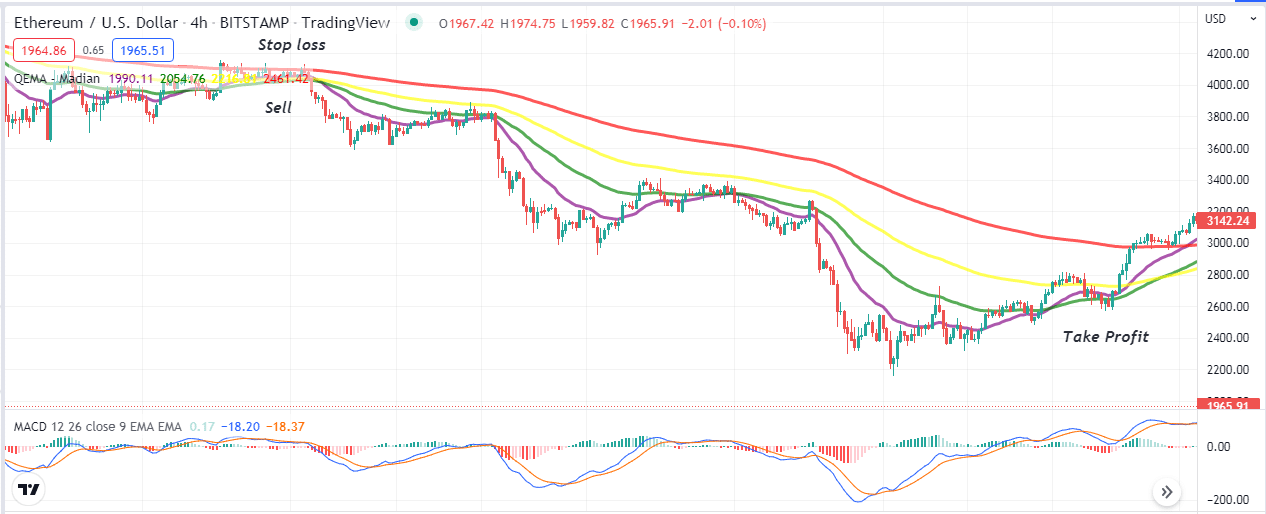
Bearish trade scenario
Match the scenarios below when opening a sell order:
- Both the green and purple EMA lines come below the yellow EMA.
- The dynamic blue line gets below the dynamic red line at the MACD indicator window.
- MACD red histogram bars take place below the central line.
Entry
Match these conditions above to confirm the bearish momentum and open a sell order.
Stop loss
The initial stop loss for your sell order will be above the current bearish momentum.
Take profit
Close the sell order when the scenarios below occur:
- Both the purple and green EMA lines reach above the yellow EMA line.
- The dynamic blue line crosses above the dynamic red line at the MACD indicator window.
- MACD green histogram bars take place above the central line.
Pros and cons
| Pros | Cons |
|
|
|
|
|
|
Final thought
Finally, the QEMA indicator is one of the most effective technical tools in the financial market. It enables the execution of constantly profitable trades in crypto assets while using it efficiently. We recommend using proper trade and money management while using this indicator in crypto trading.


