 In Crypto Strategy")
The Relative Vigor Index or RVI is a unique technical indicator that uses the oscillator concept to obtain the market context. This indicator is familiar to financial investors, and they frequently use this technical tool to generate trade ideas. So it makes sense that crypto investors also rely on this technical indicator while making trade decisions.
However, when starting to use any technical indicator for trading crypto assets, learning the indicator concept and components is better to obtain the best results. This article will introduce you to the Relative Vigor Index (RVI) indicator and effectively describe sustainable trading strategies using this technical indicator.
What is the Relative Vigor Index (RVI) indicator?
It is an oscillator indicator that calculates the price shifting and shows results in an independent window. This indicator declares the price is in an uptrend as the closing price is higher than the previous candle.
Meanwhile, the closing price is lower than the previous candle expressing declining pressure on the asset price. The indicator window contains two dynamic lines, and crossovers between these lines declare trends and momentums.
How to use the RVI indicator in crypto trading?
The RVI indicator is straightforward. Using the concept effectively, you can use this technical indicator to execute enormous profitable trades. The indicator window contains two dynamic lines: green and red lines. The green line above the red line declares positive force, and the exact opposite crossover indicates declining pressure. Investors usually enter a buy trade when the crossover occurs near the bottom level.
The green line drops below the red line near the upper level, indicating selling opportunities. Investors often use divergence of these dynamic lines to detect precious trading positions. When the divergence between these dynamic lines and price movement is opposite, the current trend may change soon.
Short-term trading strategy
We use the MACD indicator alongside the RVI indicator to generate trade ideas in this trading method. Combining both indicators readings, we get complete trade setups. You can apply this method on many trading instruments in different time frame charts; we recommend using it on at least 15 min or Hourly charts to obtain the best results.
Moreover, we suggest checking upper time frame charts or conducting multi-time frame analysis while making trade decisions to catch more efficient trades.
Bullish trade scenario
Apply both indicators in your target asset chart and observe the readings below:
- The dynamic green line reaches above the red line, and both heads on the upside at the RVI indicator window.
- The dynamic blue line reaches above the dynamic red line at the MACD indicator window.
- MACD green histogram bars take place above the central line.
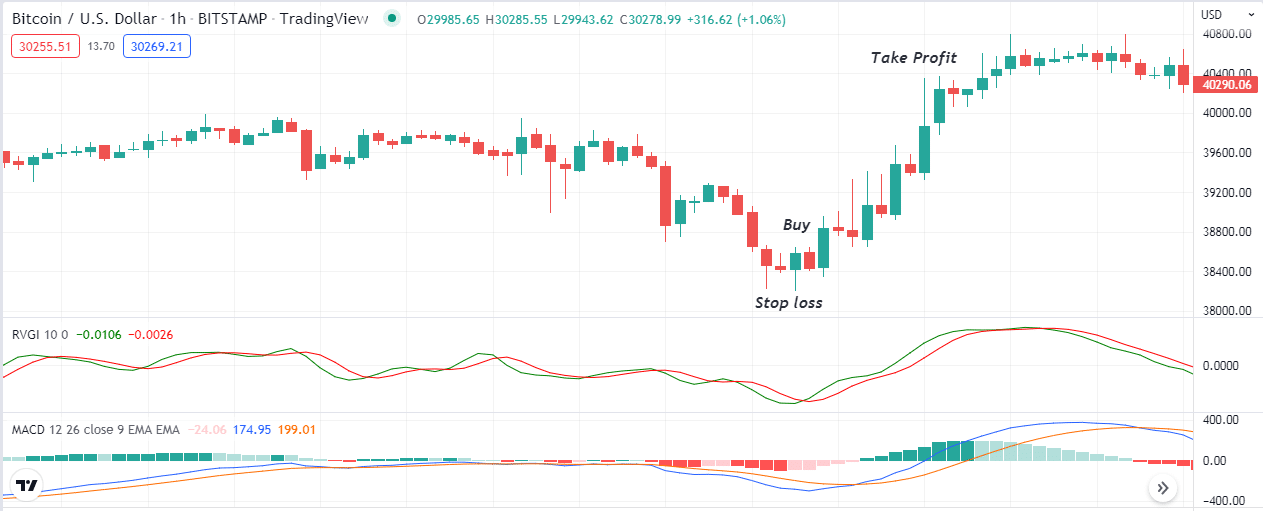
Entry
Match these conditions above and open a buy position.
Stop loss
The initial stop loss for your buy order will be below 5-10 pips of the current bullish momentum.
Take profit
Close the buy order matching the scenarios below:
- The dynamic green line reaches below the red line, and both heads are on the downside at the RVI indicator window.
- The green line reaches below the red line on the MACD indicator window.
- MACD red histogram bars take place below the central line.
Bearish trade scenario
Apply both indicators in your target asset chart and observe the readings below:
- The dynamic green line reaches below the red line, and both heads on the downside at the RVI indicator window.
- The dynamic blue line reaches below the dynamic red line at the MACD indicator window.
- MACD red histogram bars take place below the central line.
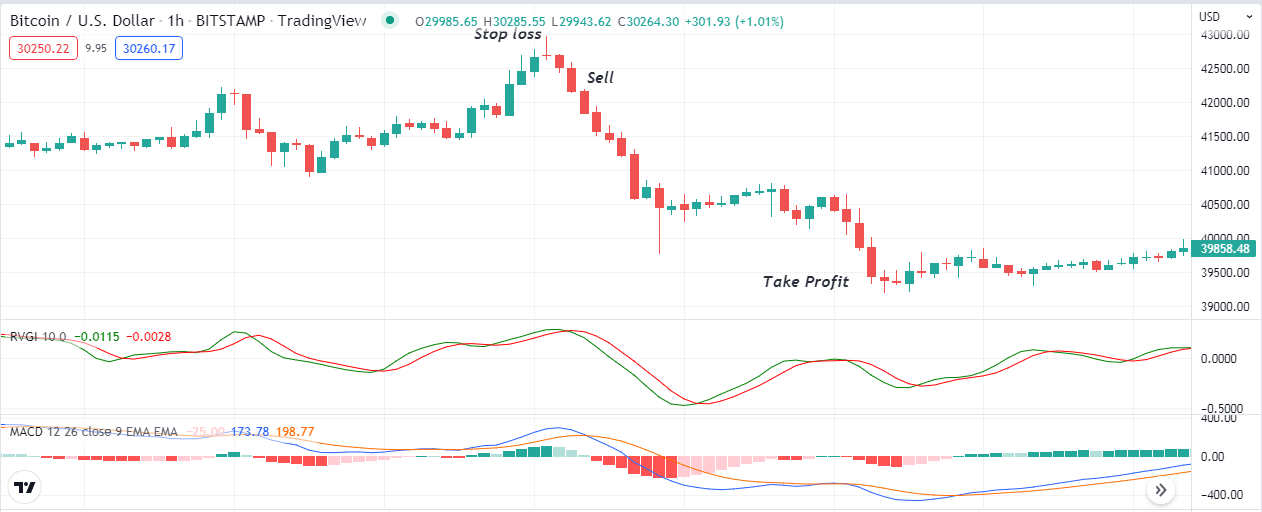
Entry
Match these conditions above and open a sell position.
Stop loss
The initial stop loss for your sell order will be above 5-10pips of the current bearish momentum.
Take profit
Close the sell order matching the scenarios below:
- The dynamic green line reaches above the red line, and both heads are on the downside at the RVI indicator window.
- The green line reaches above the red line on the MACD indicator window.
- MACD green histogram bars take place above the central line.
Long-term trading strategy
We use an HMA line as a supportive indicator beside the RVI indicator in this trading method. In this case, we seek the readings from both indicators to confirm the price direction before entering any trade. This trading method suits many trading assets, and we recommend using a D1 or H4 chart to catch the most potent long-term trades.
Bullish trade scenario
When seeking to open buy positions, match the conditions below:
- The dynamic green line reaches above the dynamic red line on the RVI indicator window.
- The price gets above the HMA line, and the HMA line starts sloping on the upside.
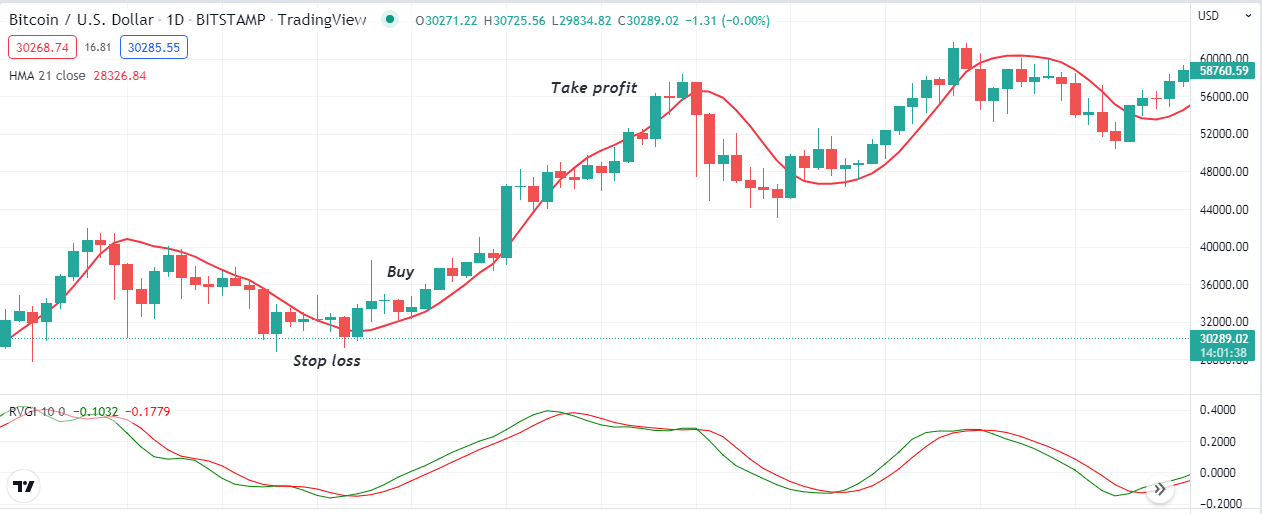
Entry
Match these conditions and enter a buy trade.
Stop loss
Place an initial stop loss for your buy order below the current swing low.
Take profit
Close the buy order by checking the conditions below:
- The dynamic green line reaches below the dynamic red line on the RVI indicator window.
- The price goes below the HMA line, and the HMA line starts sloping on the downside.
Bearish trade scenario
When seeking to open sell positions, match the conditions below:
- The dynamic green line reaches below the dynamic red line on the RVI indicator window.
- The price gets below the HMA line, and the HMA line starts sloping on the downside.
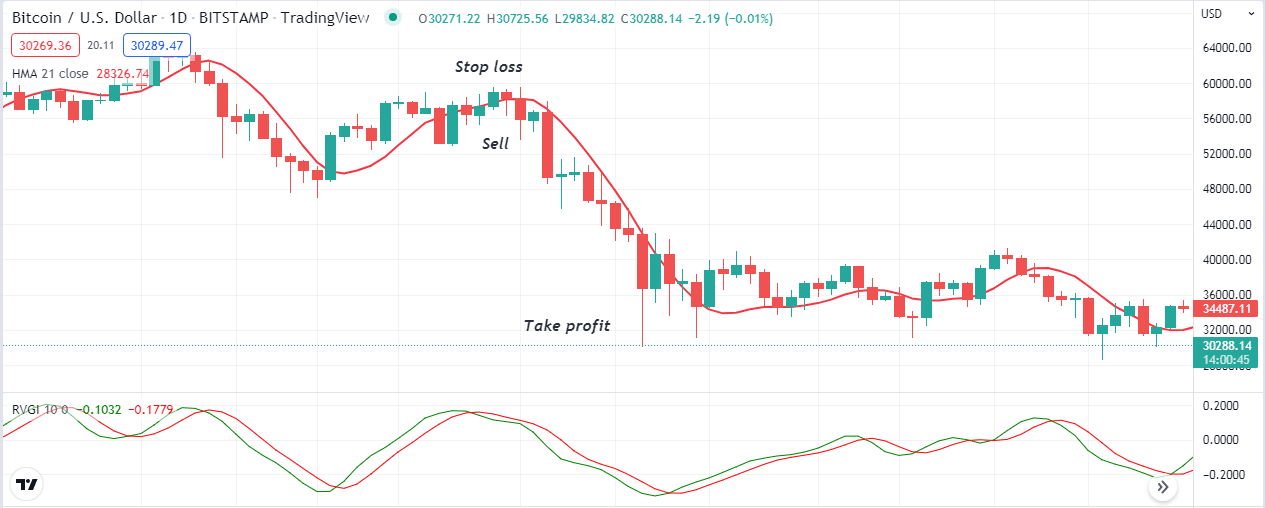
Entry
Match these conditions and enter a sell trade.
Stop loss
Place an initial stop loss for your sell order above the current swing high.
Take profit
Close the sell order by checking the conditions below:
- The dynamic green line reaches above the dynamic red line on the RVI indicator window.
- The price goes above the HMA line, and the HMA line starts sloping on the upside.
Pros and cons
| Pros | Cons |
|
|
|
|
|
|
Final thought
Finally, this article describes one of the most potential technical indicators, RVI, that you can use to generate constant profitable trade ideas on crypto assets. We suggest using other technical tools and indicators to determine the most potent trade setups.


