
Many traders find it difficult to “read” the market correctly and draw conclusions based on price action. But, if you have ever faced a similar problem, then you are on the right page. Here is a step-by-step instruction on working with RSI — an indicator that helps you enter the market as accurately as possible.
What is the RSI, how to add it to the chart and get a stable income? You will find answers to all these questions in this guide.
What is the relative strength index?
It is a momentum oscillator, usually known as RSI. Investors and traders widely use it for trend analysis. This momentum indicator generates a sell or buy signal by identifying the overbought/oversold price levels.
The working principle is that it oscillates between two extreme levels, zero to 100 and vice-versa:
- When the line graph falls towards the zero levels, it signifies that the asset is oversold.
- When the line moves towards the 100 level, it indicates the vice-versa condition.
Usually, when the line graph is below 30%, it represents the oversold condition and overbought when it is above 70%. Thus, primarily the value of the oscillator is measured over 14 days.
History of RSI
J. Welles Wilder Jr. was a mechanical engineer who became a real estate developer and commodities trader. He was interested in technical analysis and developed a few technical indicators, among them being the RSI. In 1978, the RSI indicator.
Back in 1978, there were no computers to calculate the indicators and plot them on a chart. So instead, traders manually calculated and drafted indicators on paper charts.
Calculation of the RSI indicator
We can calculate the indicator in two steps. The analysis uses 14 historical data periods for the first step.
Step 1: RSI = 100 -[1001+ average gain average loss]
The average % gain or loss over a historical period.
Step 2: RSI = 100 -[1001+previous average gain x 13+current gain (previous average loss x 13) +current loss]
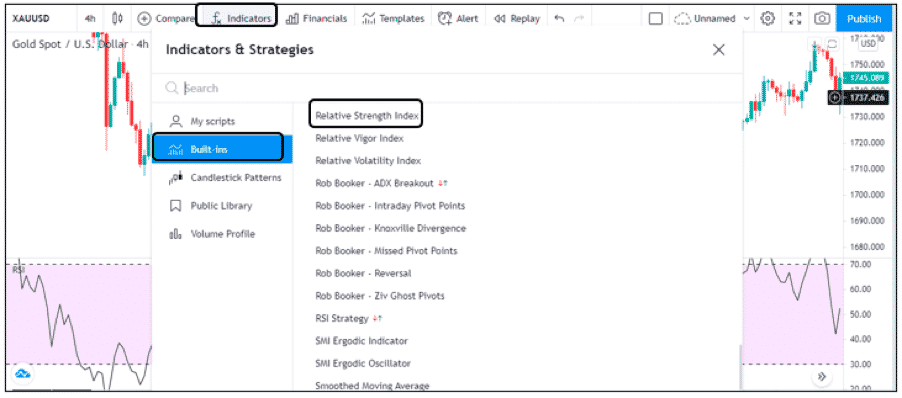
The calculated values are plotted below the currency’s price line to form the indicator. With the evolution of technology, traders do not have to manually calculate it and add it to their trading platform.
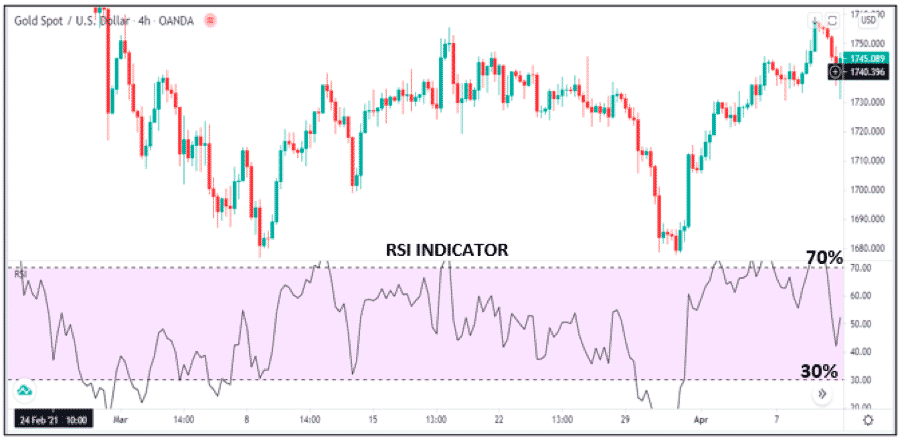
How to adjust the RSI?
Most platforms have the indicator built-in. By simply selecting it from a list, the indicator is added below the price chart. For example, the below chart displays the EUR/USD currency pair price in the daily timeframe.
The RSI line moves between two extreme levels from 0 to 100. The critical zones to consider are 70% and 30%:
- When the line goes above the 70% level, it means the currency is overbought, and traders will be looking for price reversals and selling opportunities.
- When the line touches or passes the 30% level, it means the currency is oversold, and traders will be looking for buy options or reversal in the downtrend.
Best settings for the indicator
The default setting for calculating the indicator is 14 periods. For swing traders, the 14 periods is a valuable setting. However, day traders prefer to use it on the lower time frames or reduce the RSI period.
- Day traders would opt for a setting of 9-11 periods
- Swing traders use 14 periods
- Longer-term traders would set it at 20-30 periods
The setting depends on the style and strategies of trading.
How is it helpful for traders?
Traders use the indicator to look for new trends, overbought/oversold conditions, and divergence. The indicator rises as the market strengthens and falls as the momentum decreases. Thus, when you are watching for reversals in an uptrend, it is will indicate that an overbought condition is developing and vice versa.
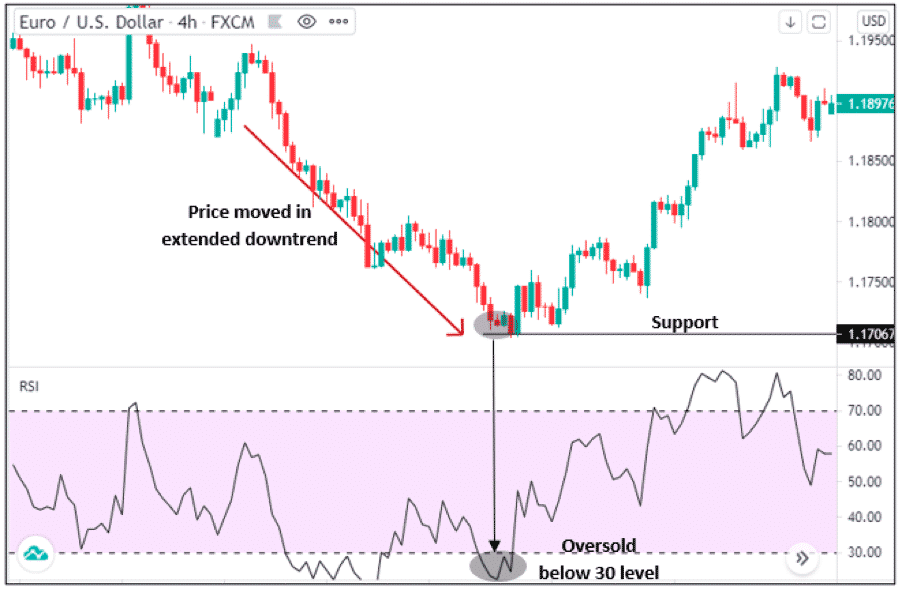
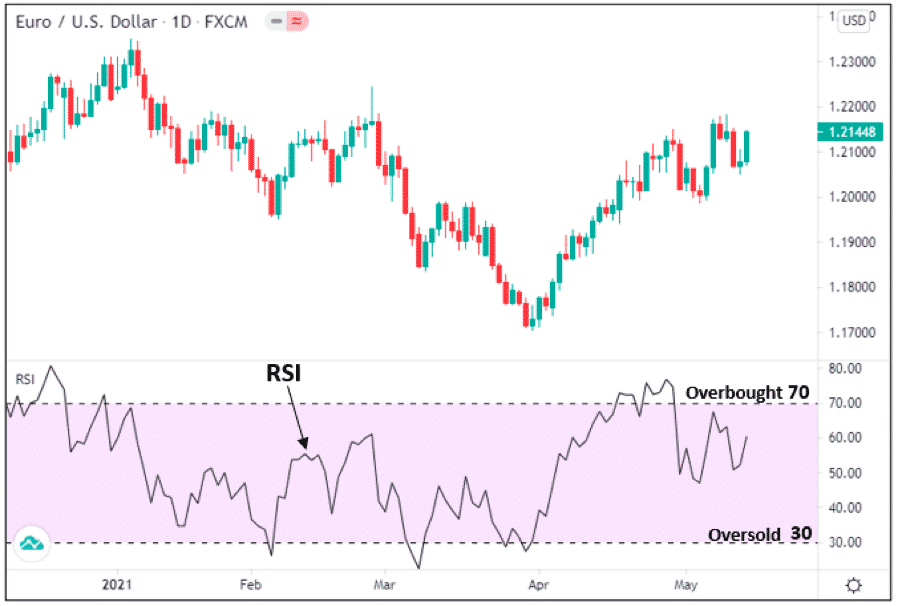
An example of how traders can determine trend changes in price is in this EUR/USD chart. The price was in a long downtrend and eventually became oversold, surpassing the 30% zone as seen in the chart. Thus, this is an excellent opportunity to look for price reversals upwards.
Using RSI to determine trends
For trend confirmations, we will look at the RSI at the 50% level. If it moves below 50% downwards, a downtrend is forming. Therefore, the RSI must cross below or above the 50% level for trend confirmation.
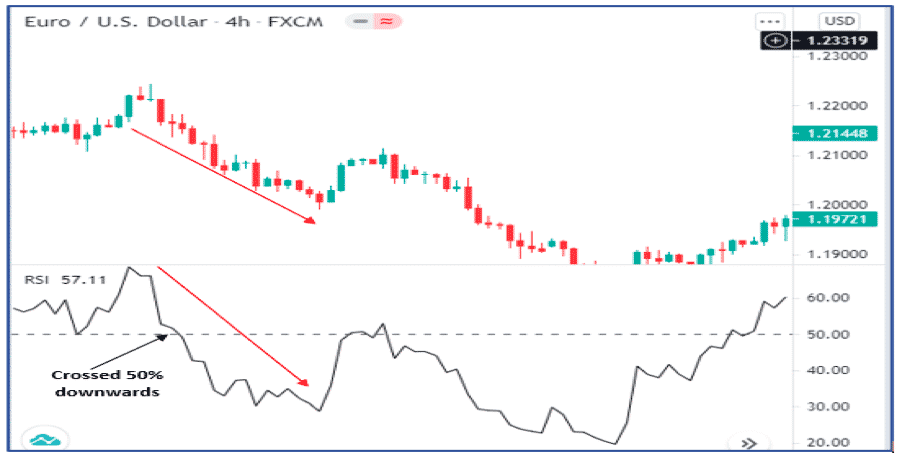
In this EUR/USD price chart, the price was in a downtrend, and in the RSI, it crossed the 50% line and continued downwards, giving us a perfect example of a downtrend confirmation. On the other hand, if the indicator is moving above the 50% level in an upward direction is an uptrend confirmation.
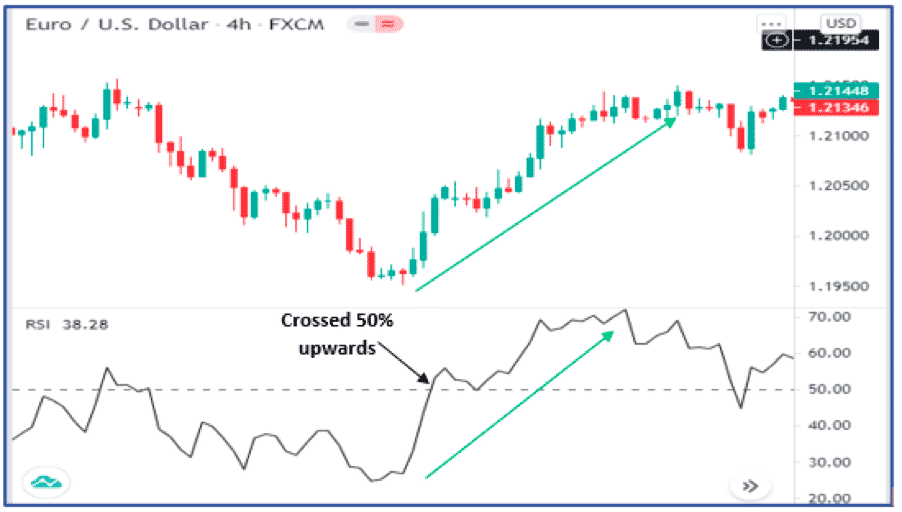
The EUR/USD pair was in an uptrend, and the RSI crossed the 50% line upwards, so this confirmed the strong uptrend.
The market has an anabolic drive that will always begin to move upwards, but only if there are enough buyers to sustain the upward momentum. If they do not exist, then the price will either continue to rise at a slower pace or fall toward zero.
Basic strategies using RSI
Trading divergence
Traders can use the indicator to detect divergence. When a financial asset’s price creates new highs or new lows, divergence occurs. A frequently used technique to find it is to identify price change in the momentum before changing price action.
Traders can use divergence to predict trend reversals:
- During an uptrend, look for a price that breaks resistance, and the RSI fails to make a new high.
- Conversely, look for a price that breaks support, and it falls to create a new low.
In both instances, you have a divergence situation that could point to a trading signal.
Bullish divergence
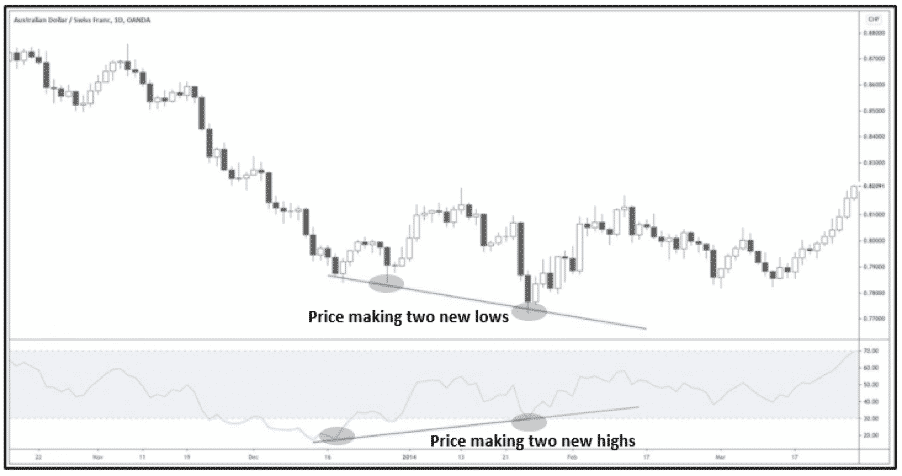
In bullish divergence, we first look for an oversold indication on the RSI. Next, we will find the price making lower lows and the RSI making a higher low.
Here’s an example of bullish divergence on the AUD/CHF.
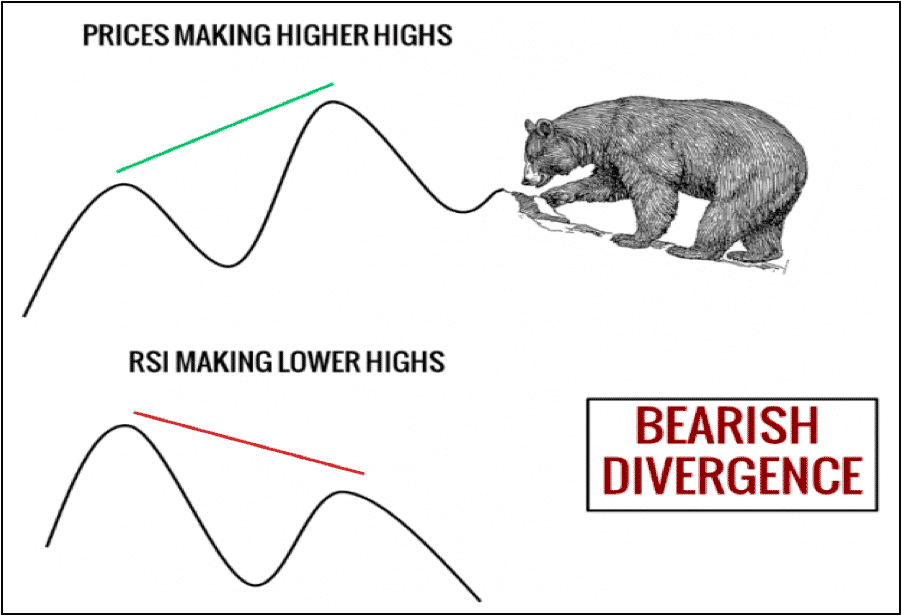
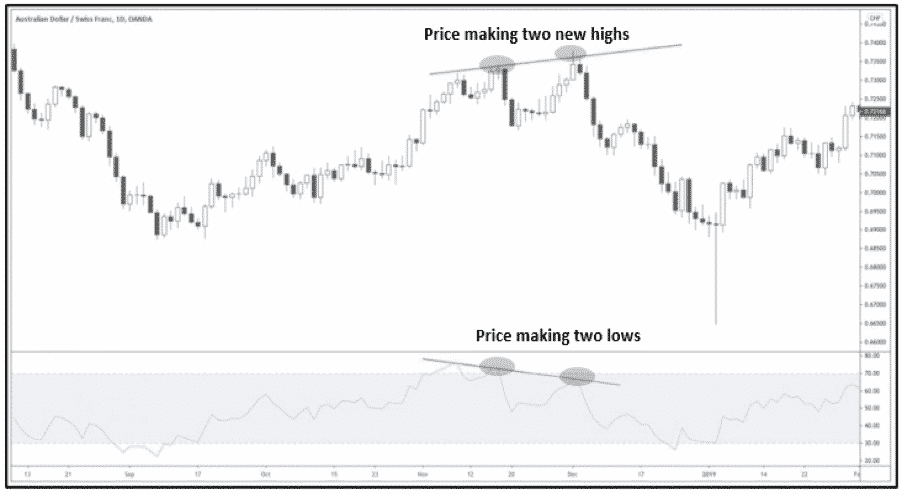
Bearish divergence
The price makes two new highs, but on the RSI, it forms two new lows. This can give you an idea that bullish momentum is weakening, and the market can be bearish soon.
Support and resistance
Trading with support and resistance for reversals is the most basic strategy of technical trading yet the most powerful one when combined with indicators or price action. To make RSI divergence more accurate, you can use S/R and trendline.
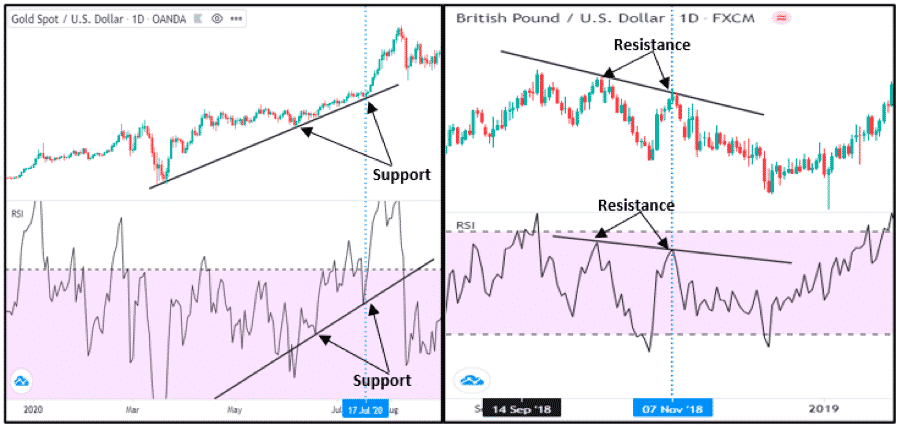
First, to trade RSI with S/R, we need to draw clear support, resistance, or a trendline. Then, as long as the line graph stays within the 30-70 zone, we need to be patient enough and wait for the opportunity. Once we find the indicator going below or above 30 or 70 zones, we will check if the line graph on the chart is near potential support, resistance, or a trendline and then take the trade.
Disadvantages of the indicator
For all its simplicity in operation, this forecasting tool has a critical drawback inherent in almost all indicators — its signals are somewhat delayed. It identifies overbought/oversold zones and gives signals about the future price movement. Experts recommend not to use it separately from other technical analysis tools.
This is because there are often periods of “calm” in the market when the price hardly moves or is in a flat. At this time, the RSI can give below/above the signal levels — moments that are unfavorable for opening positions.
The RSI can sometimes deliver a false set-up by giving the entry too early. To trade RSI, traders have to be patient enough and use it in addition to the area of confluence.
Summary
Using this indicator in conjunction with any other technical analysis makes it more accurate. According to some traders, using more than one indicator can improve trading strategies by providing another view into the markets and providing added support for decision making or taking positions. However, trading with more than one indicator is not for beginners. It is better to gain experience using each of the individual indicators before combining them to form a complete strategy.