
FX trading is mainly a business of banks and financial institutes, where support and resistance provide a sign of what these key players are doing in the market. Therefore, understanding this method can help a trader to get a detailed view of the market.
Price changes in the FX market with the weakness and strength of the related currencies. Several technical, fundamental, macroeconomic, and socioeconomic factors affect currency prices.
When price changes in FX instruments, it leaves footprints of big players. Simply, it follows some technical patterns. So smart traders always seek those patterns to catch potentially profitable trading positions with low risk. Support and resistance are the most common among them all.
This article will discuss all basics about these levels that will help you understand whether you should rely on it or not. Moreover, we will show the top three best use of them and risk management tips.
Basics of support and resistance
They are simply the levels where price movement gets pushed for a bit or price changes their direction from these levels. The idea of support and resistance may seem easy but mastering the concept is quite different.
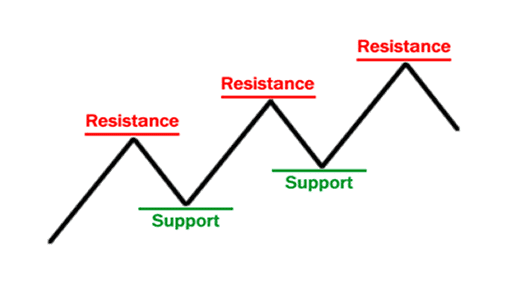
These are the levels where the price may stop to fall more for a specific period or starts to make an upward movement. The resistance levels act as the opposite of support levels. Resistance levels are where participants expect an uptrend to push temporarily or prices start to fall from these levels.
These levels occur mainly due to supply and demand for certain assets. There are also some facts such as historical levels. In the world of the FX market, there is a typical textbook talk that is “history repeats itself.” The prices start to bounce back from certain levels as the participants tend to keep or analyze the historical price movement data as a part of technical and fundamental analysis.
There are several ways to identify these levels, but professionals often use trendline, moving averages, Fibonacci retracements, etc.. The price action traders are smart, and they see the price movement differently than others. They often try to identify these levels by following the accumulation and distribution phases of currency prices.
Another common fact about them is when resistance breaks at the upside by the price movement, it often acts as the next support level. So the support levels break at the downside with an increasing sell pressure at the asset, and then it can act as the next resistance level. Traders often define these levels as dynamic levels.
Why support and resistance levels may fail
The FX is a decentralized marketplace where no one is in charge of the whole market. Nothing is absolute in this market as the price movement depends on both related currencies of any currency pair.
So these levels also fail, and there are several reasons behind these failures, such as market sentiments, news, increase or decrease supply-demand, etc.
One more fact — these levels weaken when there is some uncertain price movement that occurs by related major affecting facts. Also, some false breakout happens by the price movements that often stop the trading orders’ stop loss.
The best use of support and resistance level
Let’s discuss the best three uses of these levels.
- Use with price action
Price action traders follow the price movement by observing it in several ways. They are smart traders who seek to follow the institutional price levels.
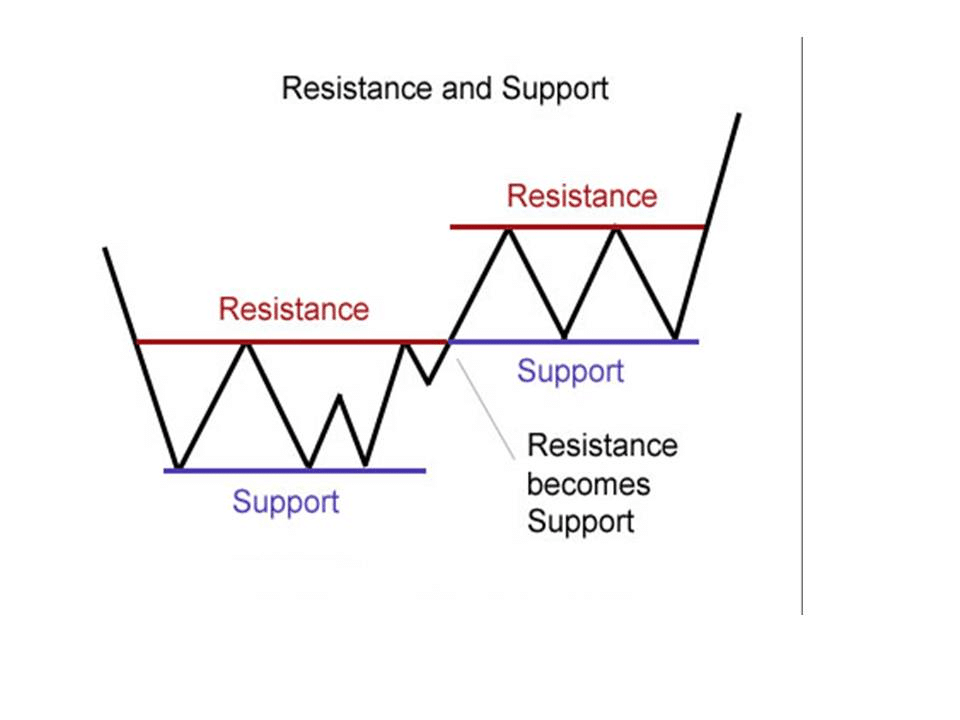
Institutions often have tendencies to buy assets from the support levels and start to sell from the resistance levels. We already know an ordinary fact about dynamic levels. The resistance levels start to act as support levels after breaking, so the support levels also serve as the next resistance level.
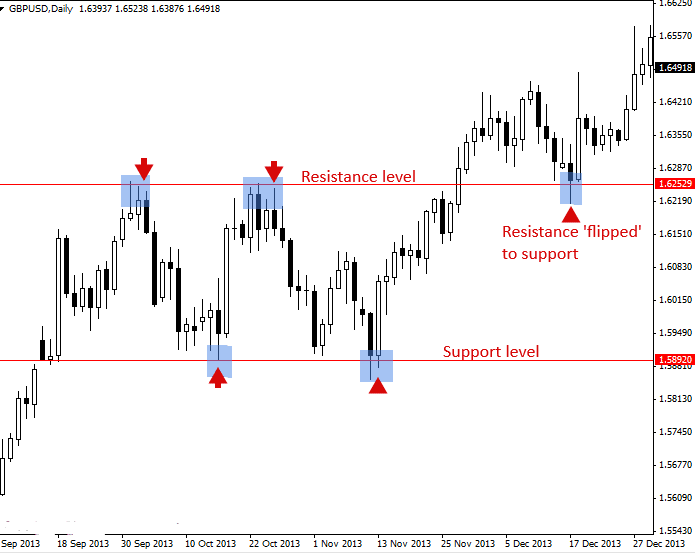
The figure above shows the concept of flipping resistance level into a support level. When resistance level becomes the next support level, set stop loss (SL) below the dynamic level. As long as these levels remain intact, use SL outside the range.
- Use with market context
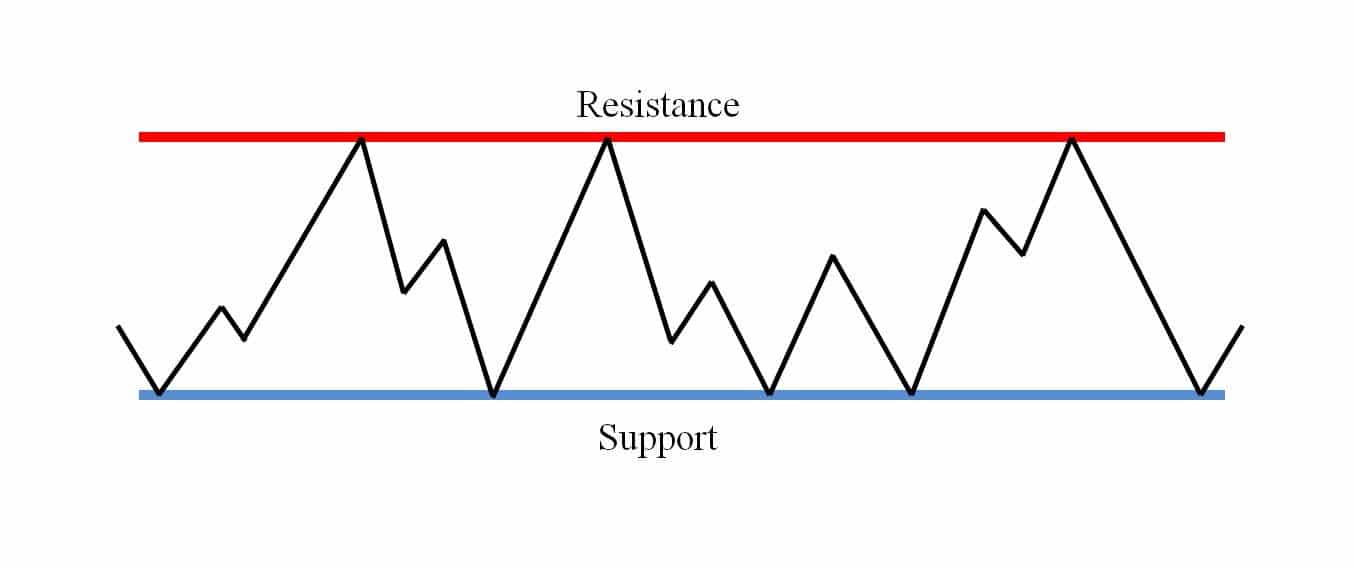
Using these levels with market context is a straightforward method. Look at the figure below.
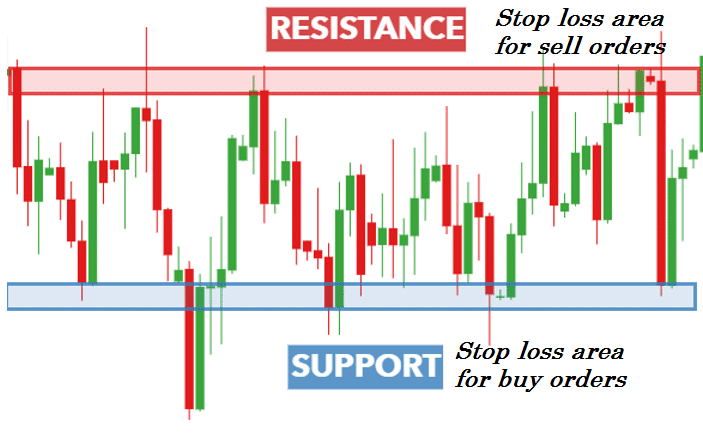
It shows the support and resistance levels, where the price reaches and bounces back every time. So as a smart trader, you always seek to place buy orders at the support levels so the initial SL will be below the support level. Similarly, when the price reaches the resistance levels, you seek to put sell orders and initial SL above the resistance level.
- Follow the momentum
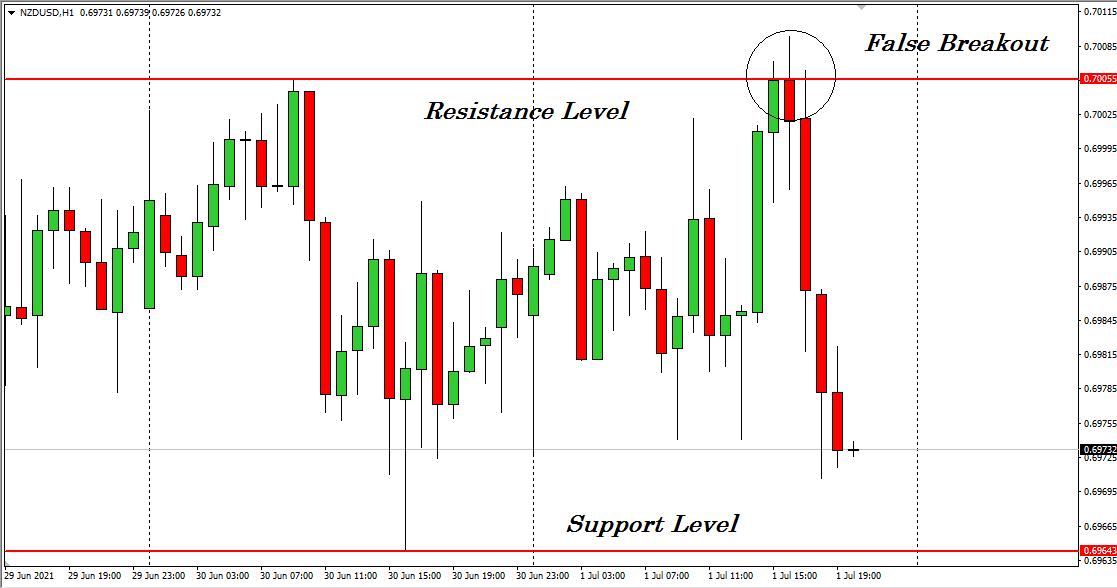
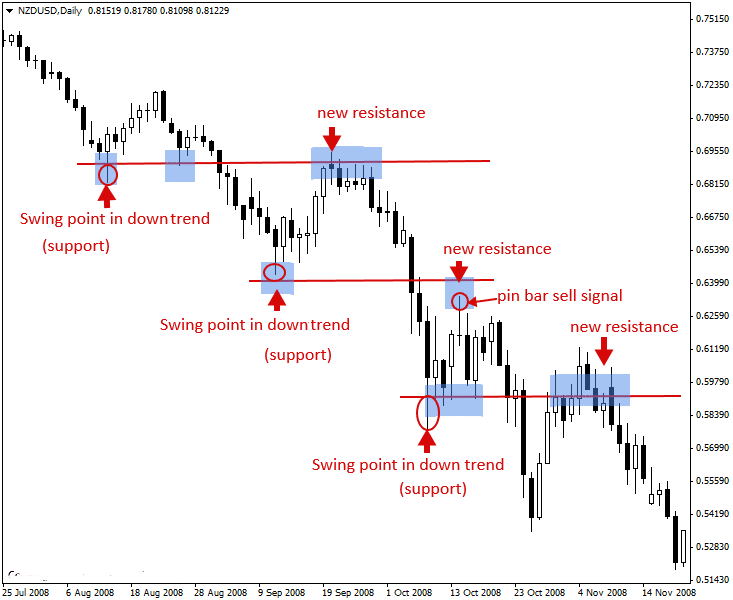
The last type of use for support and resistance is following the momentum. We know prices don’t fall straight for a long period. In different time frames, charts are different. More simply, the current price movement may be downward at the hourly chart for any currency pair, but it may continue to be upward movement in a weekly chart.
The figure above shows a downtrend price movement and the support and resistance levels at a continuous downtrend. Every time price makes a new higher high or lower low price bounces back or takes a break for a certain period before it continues to move in the same direction. The higher high and lower low levels are countable at this type of use for support and resistance.
Risk management tips for support and resistance trading
- Before placing any order following these level’s method, you must plan your trade carefully.
- Check how much of your capital is getting at risk and so the expected return also.
- Make a complete probable observation and complete trading plan, including SL and TP.
- Follow proper trade and money management when you trade with support and resistance levels.
- Try to do a multi time frame analysis and match the price direction with your trading order before making it.
- You can also do hedging by using these levels, but practice and do more research before applying hedge on your trading account.
Moreover, a smart trader must know their exits before putting any order.
Final thoughts
Finally, there is no doubt that these levels are very effective and commonly used technical methods to any FX or stock trader. We suggest applying it to a practice account to have a clear concept before applying it to your trading account.
Additionally, avoid trading or be aware of putting orders during major fundamental events such as interest rate decisions, GDP, GNP, job data, etc., trend-changing news releases by using this method.