
Dean Malone released the Traders Dynamic Index (TDI) in 2006 to help traders analyze the trend, strength, and volatility of any market for any given period. TDI can provide all that information being a hybrid indicator that combines moving average, relative strength index, and Bollinger Bands.
Many traders claim that TDI is the holy grail in technical trading and is the only indicator you will ever need to succeed in this business. That sounds like a big claim, but you will understand later how versatile this indicator is.
This article presents five ways you can trade with this indicator, but there are other ways you can use it in trading.
Components of TDI
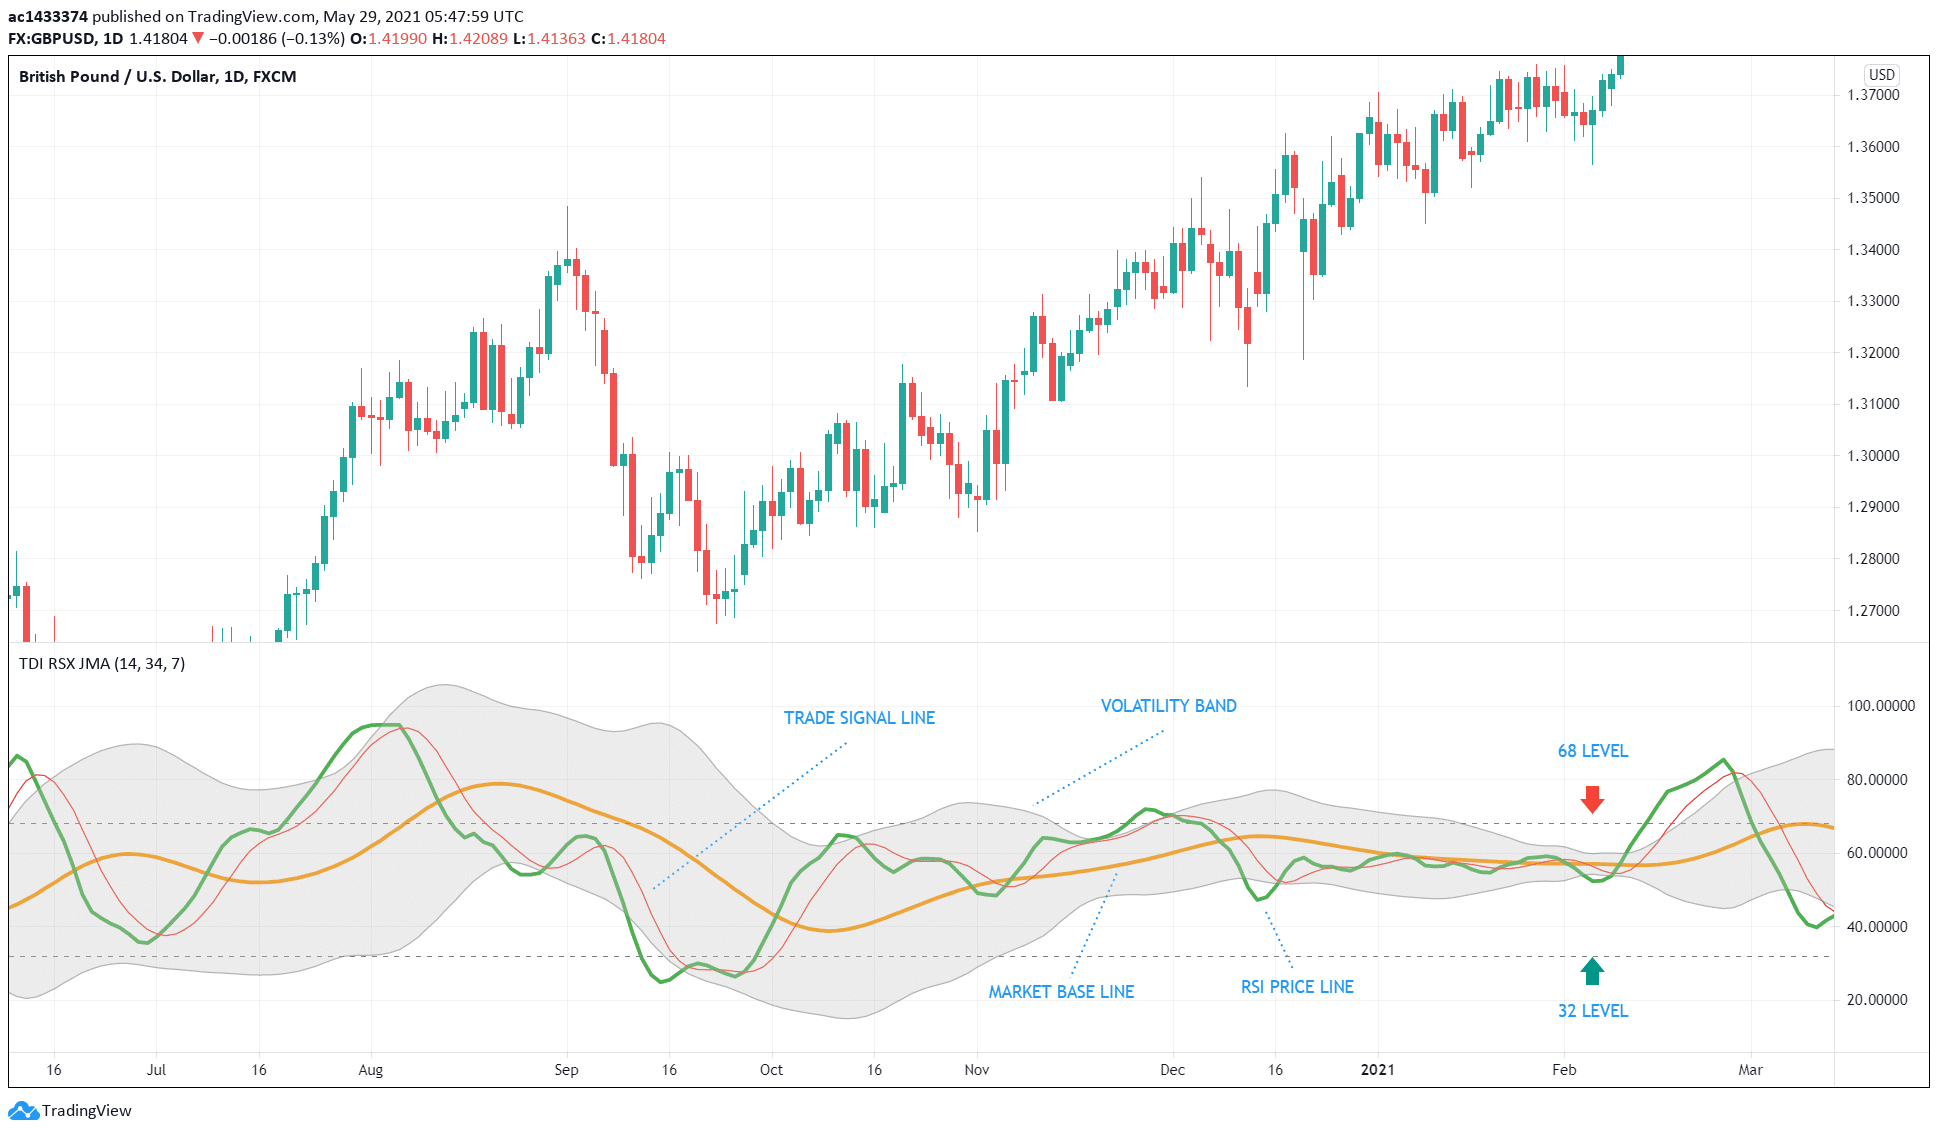
Before you can use the TDI in your trading, you must know the various parts making up this complex indicator and the role of each part. The following list explains the components of TDI as shown in the image above:
- RSI price line (RPL) – normally in green color, this line resembles the graph of the RSI indicator.
- Trade signal line (TSL) – the TSL often comes in red and is the 7-period average of the RPL.
- Market baseline (MBL) – often in gold color, the MBL is the middle line of the volatility band.
- Volatility band – the upper and lower bands are 1.6185 standard deviations from the MBL.
Five ways to trade the TDI
Trade №1: Breakout of volatility band
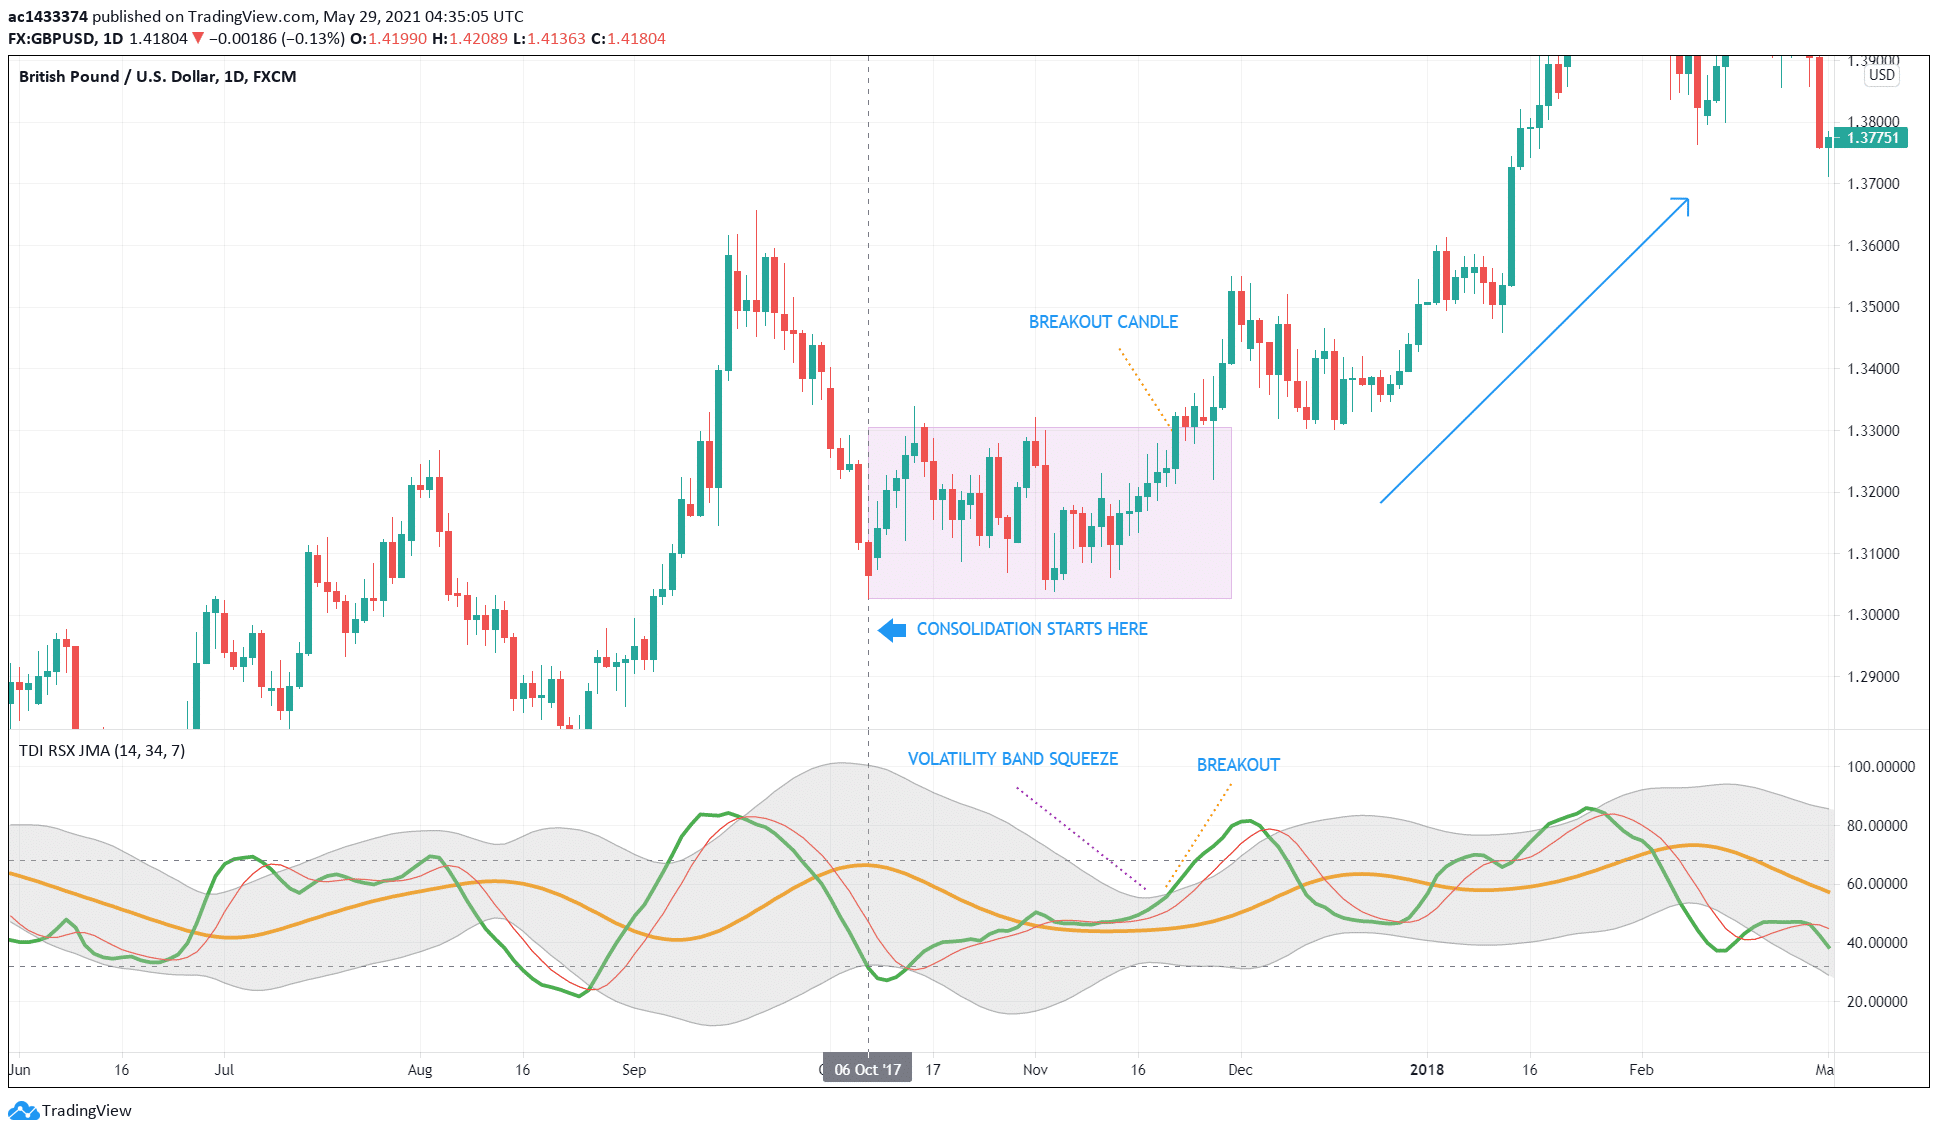
You can trade the TDI as you would the Bollinger bands, but not as a reversal tool but as a breakout tool. This means that anytime RPL breaks above the upper volatility band or below the lower volatility band, you can take that as an entry signal. However, to improve trade success, you must filter those signals.
Like the BB, the TDI can show if the market is consolidating. During consolidation, the RPL seems to fluctuate up and down in between the upper/lower band in quick succession while the band itself squeezes. This goes on for a while until the RPL finally breaks out of the range.
A small consolidation occurred on 6 October 2017 on GBP/USD daily chart in the chart above. Shortly, the volatility band squeezed, and an upside breakout took place. The actual buy entry came a little later when a big bullish candle broke the upper boundary of the rectangle. A strong uptrend erupted later after testing the breakout point.
Trade №2: Crossover in overbought/oversold condition
Like the RSI, the TDI allows you to take trades counter to the near-term trend when the market becomes overbought or oversold. The overbought threshold is typically the 68 level, while the oversold threshold is usually the 32 level. Although price does not always reverse immediately after entering and leaving the extreme condition, eventually it does. When it happens, you are in for quick profits.
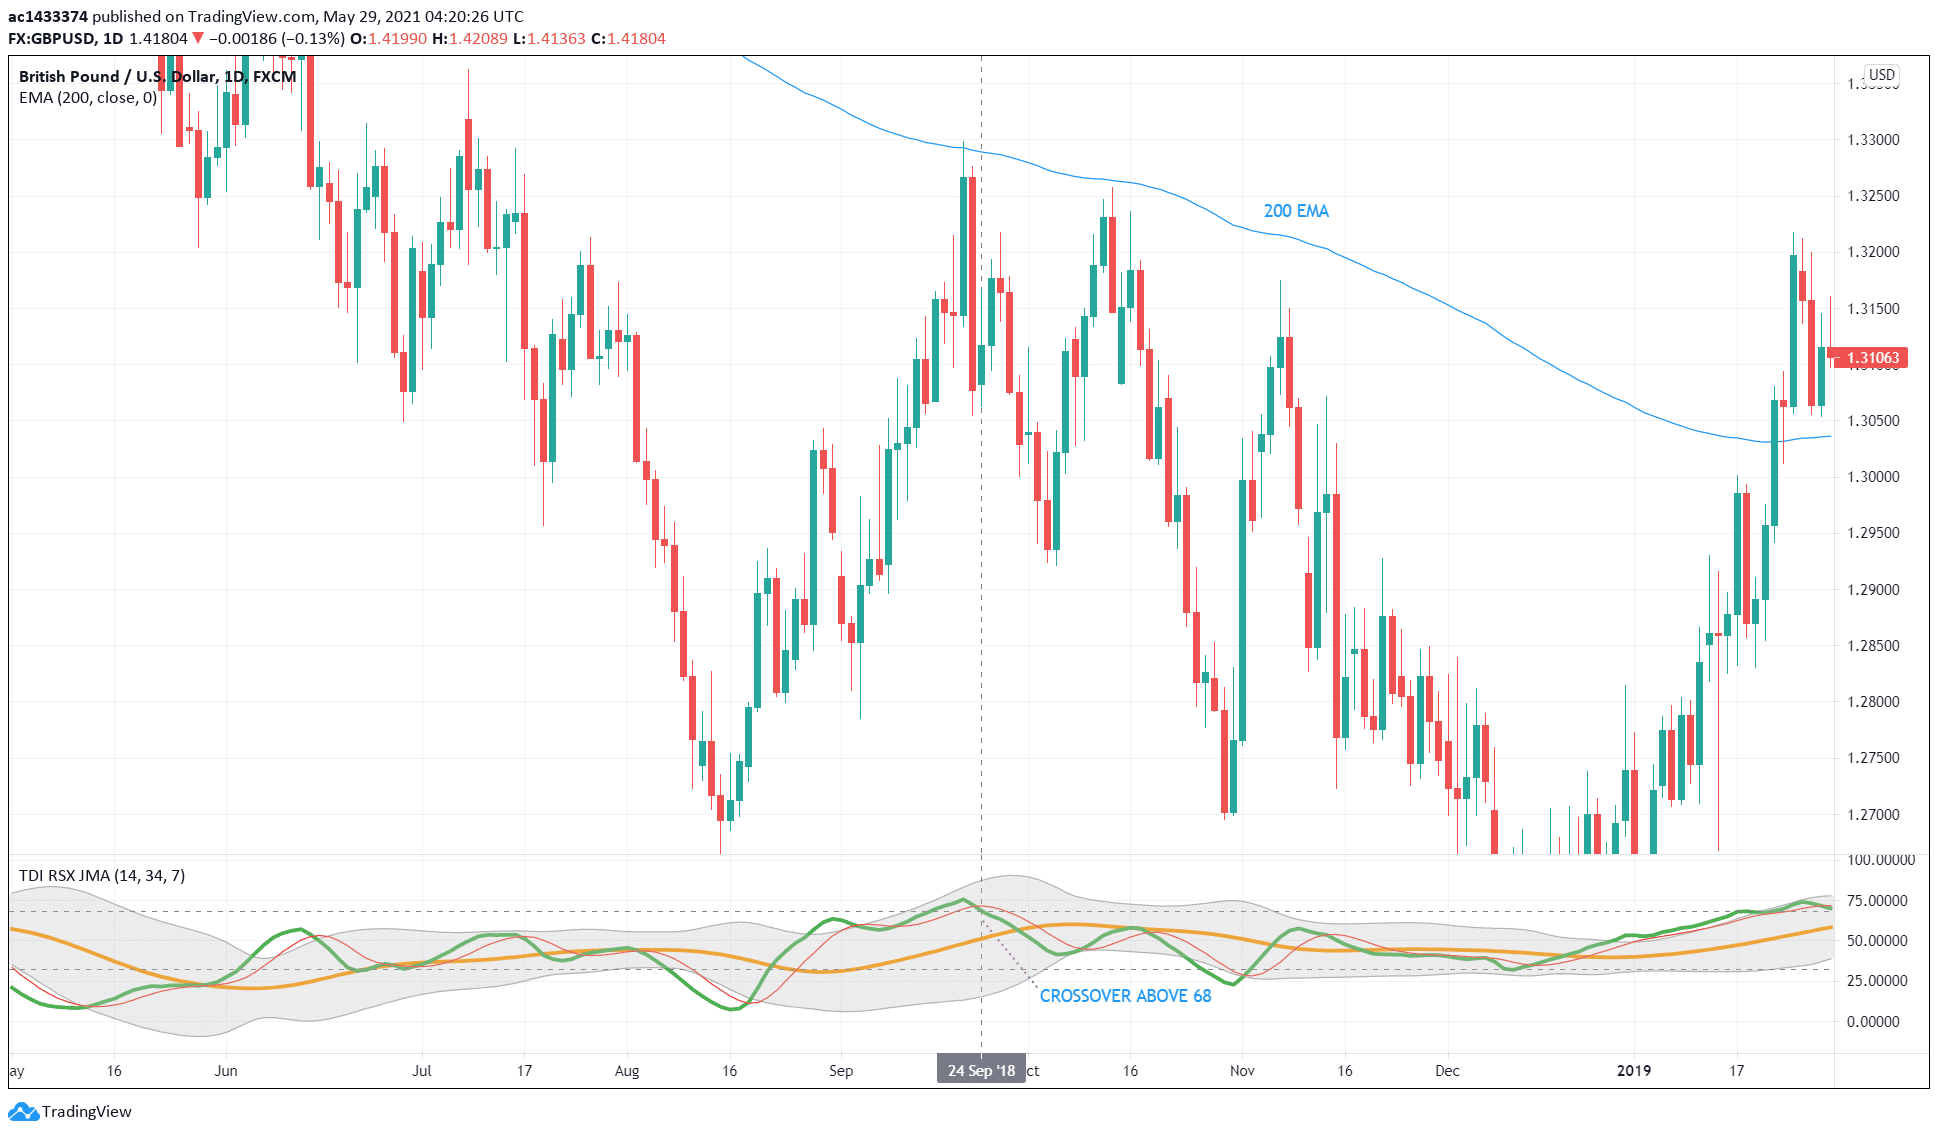
To avoid trading against the longer-term trend, identify the trend first and then find overbought or oversold conditions.
For example, if the market is in a downtrend, wait for the RPL to become overbought before initiating a position. Such is the case in the chart shown above. The market bias is bearish since the 200 EMA is sloping downward. After getting into overbought territory, RPL crossed below the TSL from above while both lines were above 68. The downtrend continued after this pullback.
Trade №3: Market baseline exhaustion
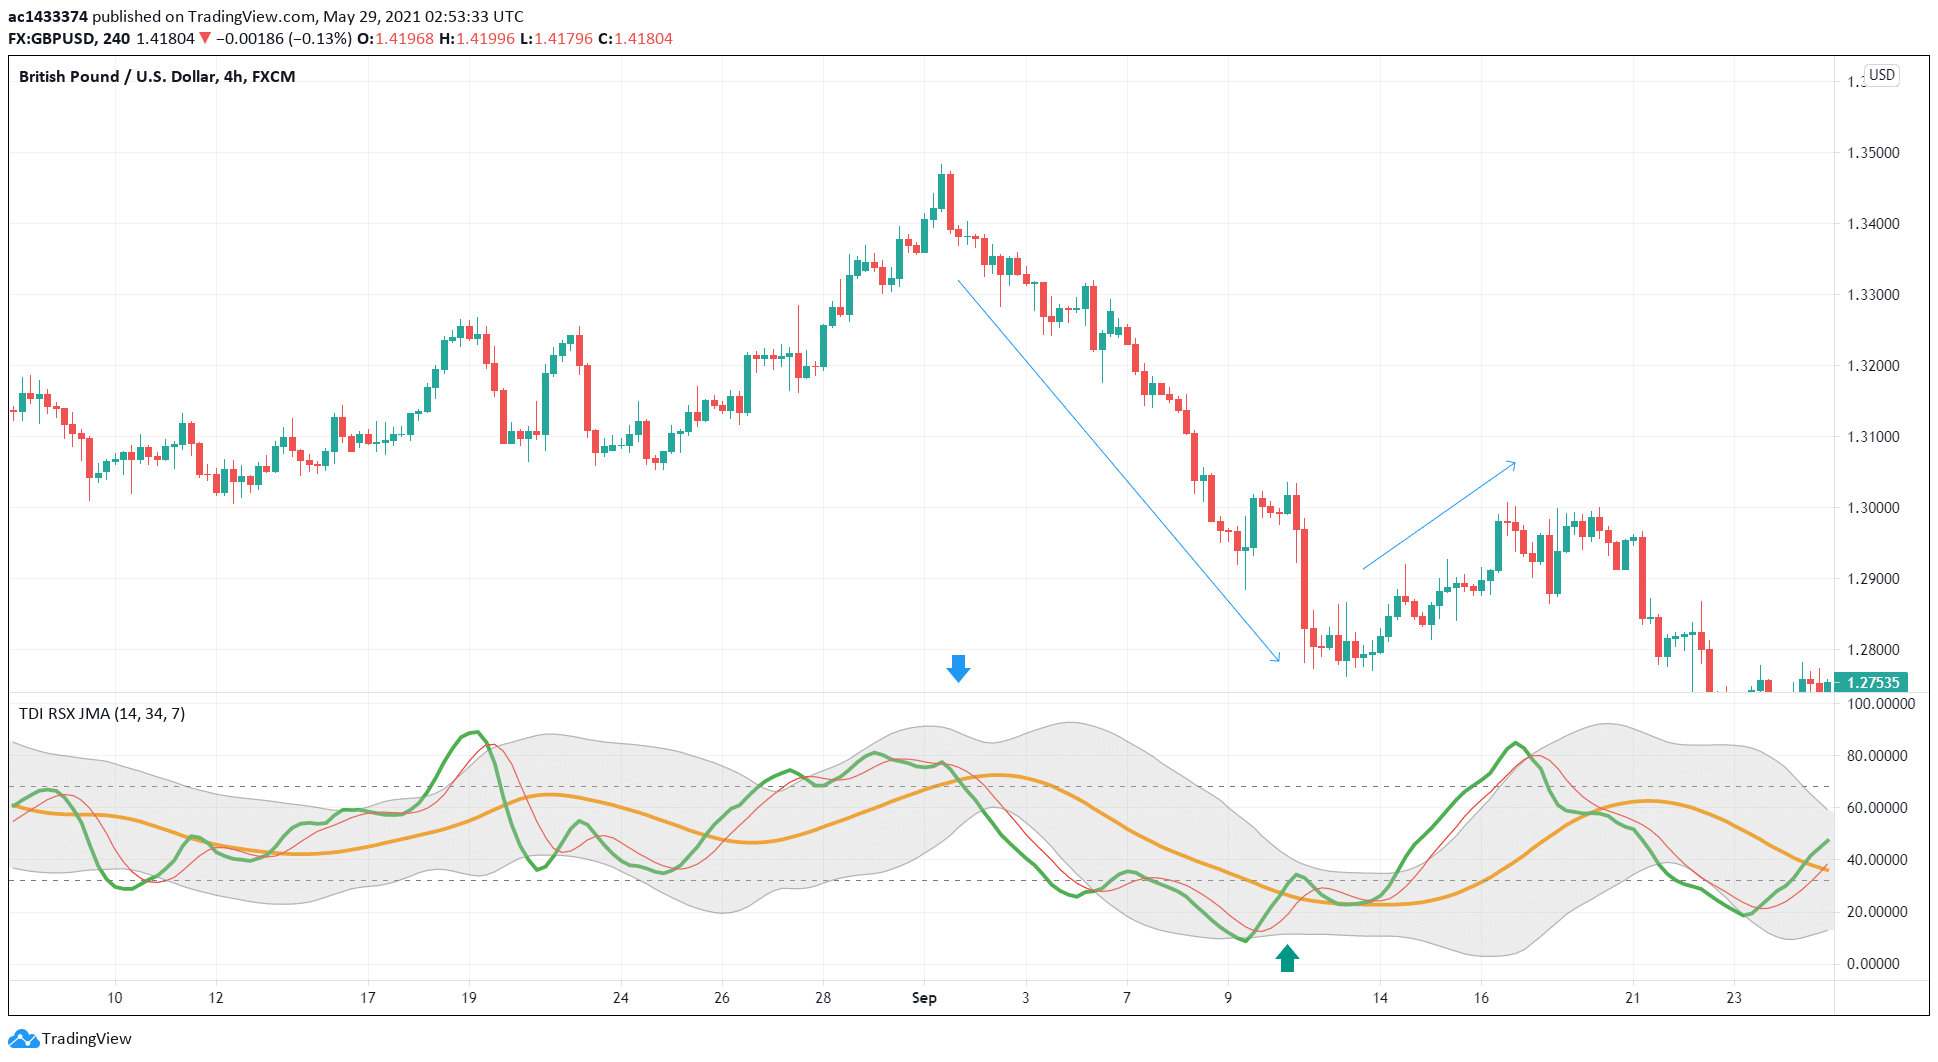
The market baseline depicts the overall trend on any timeframe. When the MBL is sloping upward, it means the trend is bullish. When the MBL is dropping down, it suggests the trend is bearish. Look at the corresponding price action to confirm this.
While it rarely happens, MBL reaching the overbought or oversold territory marks a critical juncture for the underlying market. As a result, traders can expect a reversal with great certainty. One way to trade this scenario is to wait for a crossover of the RPL and MBL on/near an extreme location. For example, when MBL becomes overbought, enter short when RPL crosses the MBL from above.
Two such scenarios occurred in the sample chart above, one for sell and one for buy. The blue down arrow marked the first scenario. When MBL went above 68, RPL crossed below it from within the overbought territory. A strong downtrend followed this event. The green up arrow marked the second scenario. Although price did not reverse straight away, it eventually did, and then a minimal pullback ensued, which any trader can profit from.
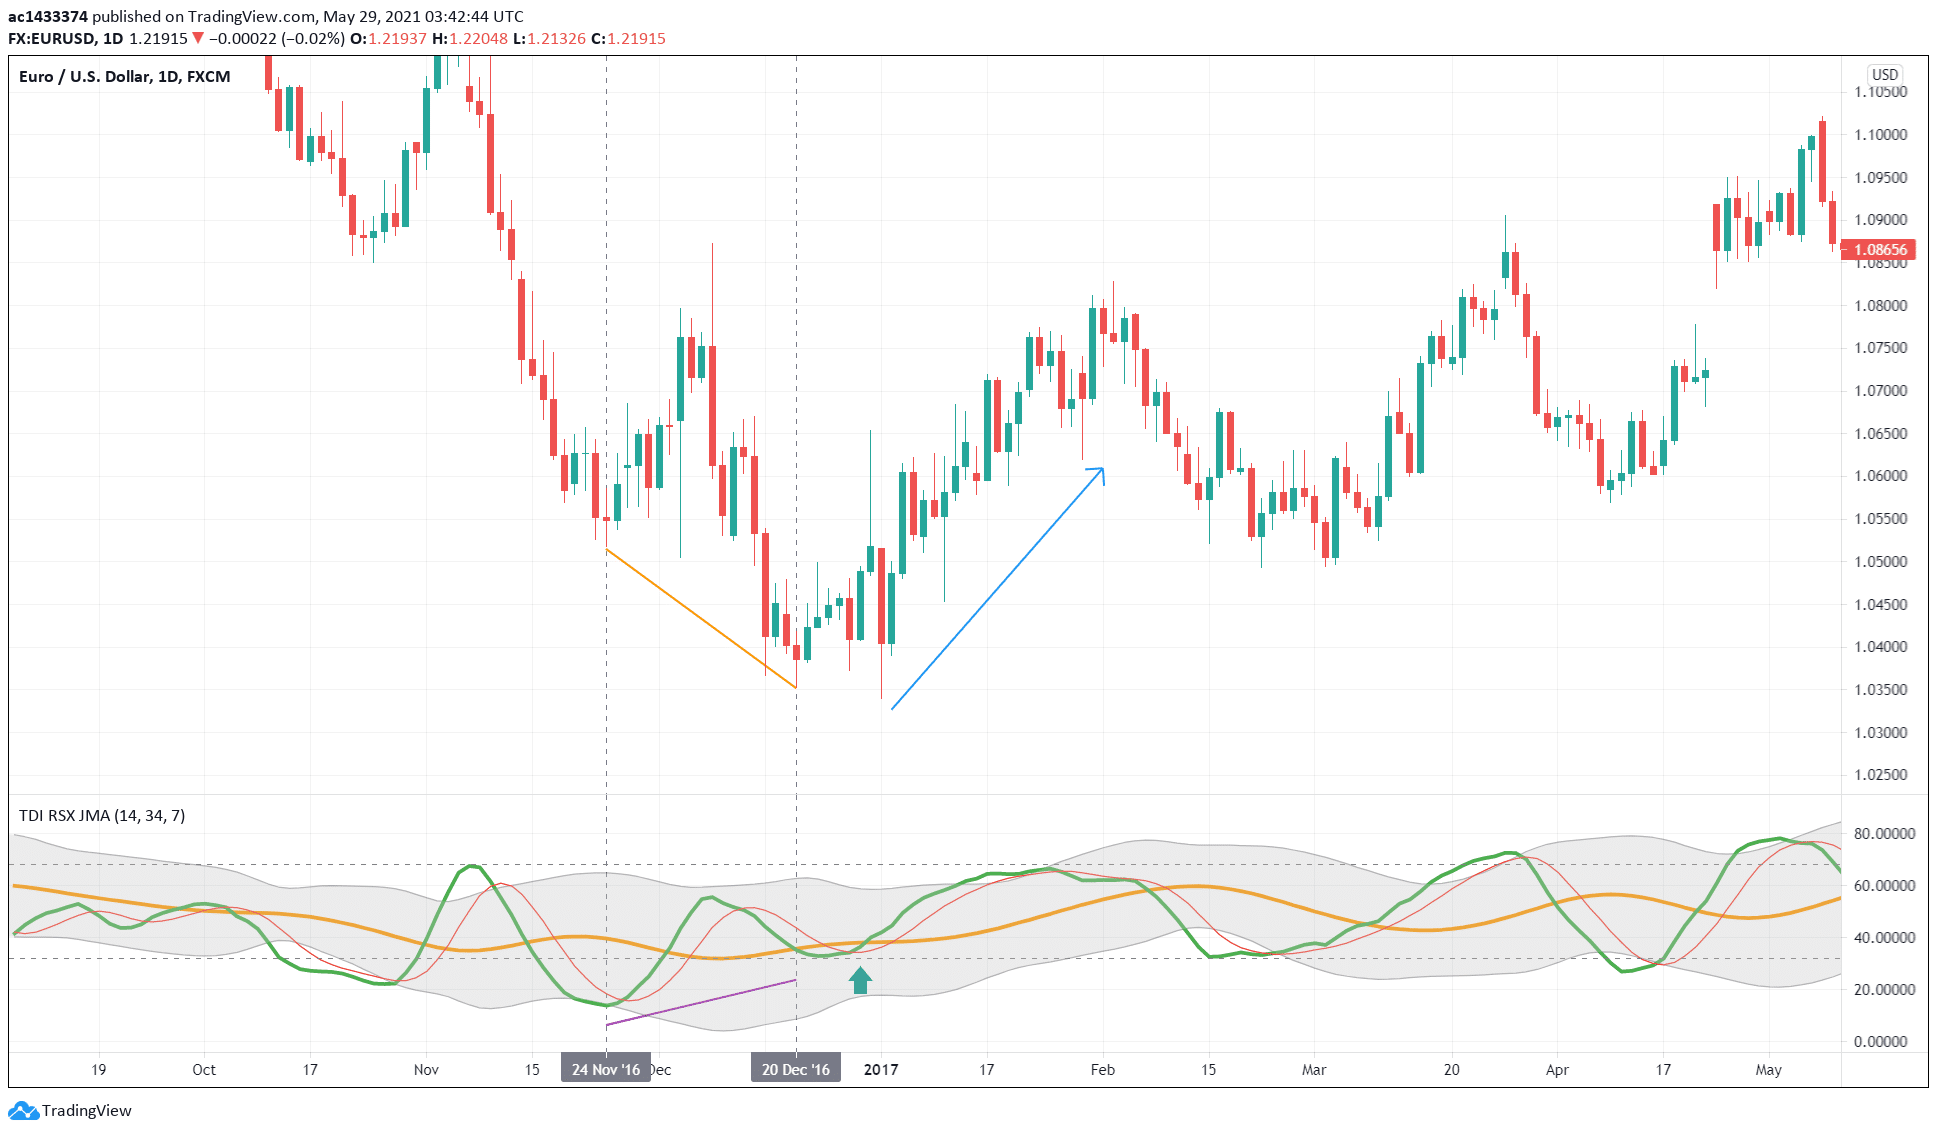
Trade №4: RSI price line divergence
Better than RSI and stochastic themselves, TDI provides high-probability divergence signals. Such signals may occur with or against the trend. Of course, the best policy is to trade divergences along with the trend. However, if the divergence setup is too apparent or big enough in the time frame being considered, taking such trades even counter to the trend can still prove successful.
One example of a significant divergence setup occurs on EUR/USD daily chart (see image above). Marked by two vertical lines, the price made a low on 24 November 2016 and a lower low on 20 December 2016.
On the contrary, TDI created a higher low at the second point. You cannot ignore a setup as big as this. The buy entry occurred a few candles after the TDI higher low when RPL crossed above the TSL. You could have earned a considerable profit had you taken such a trade.
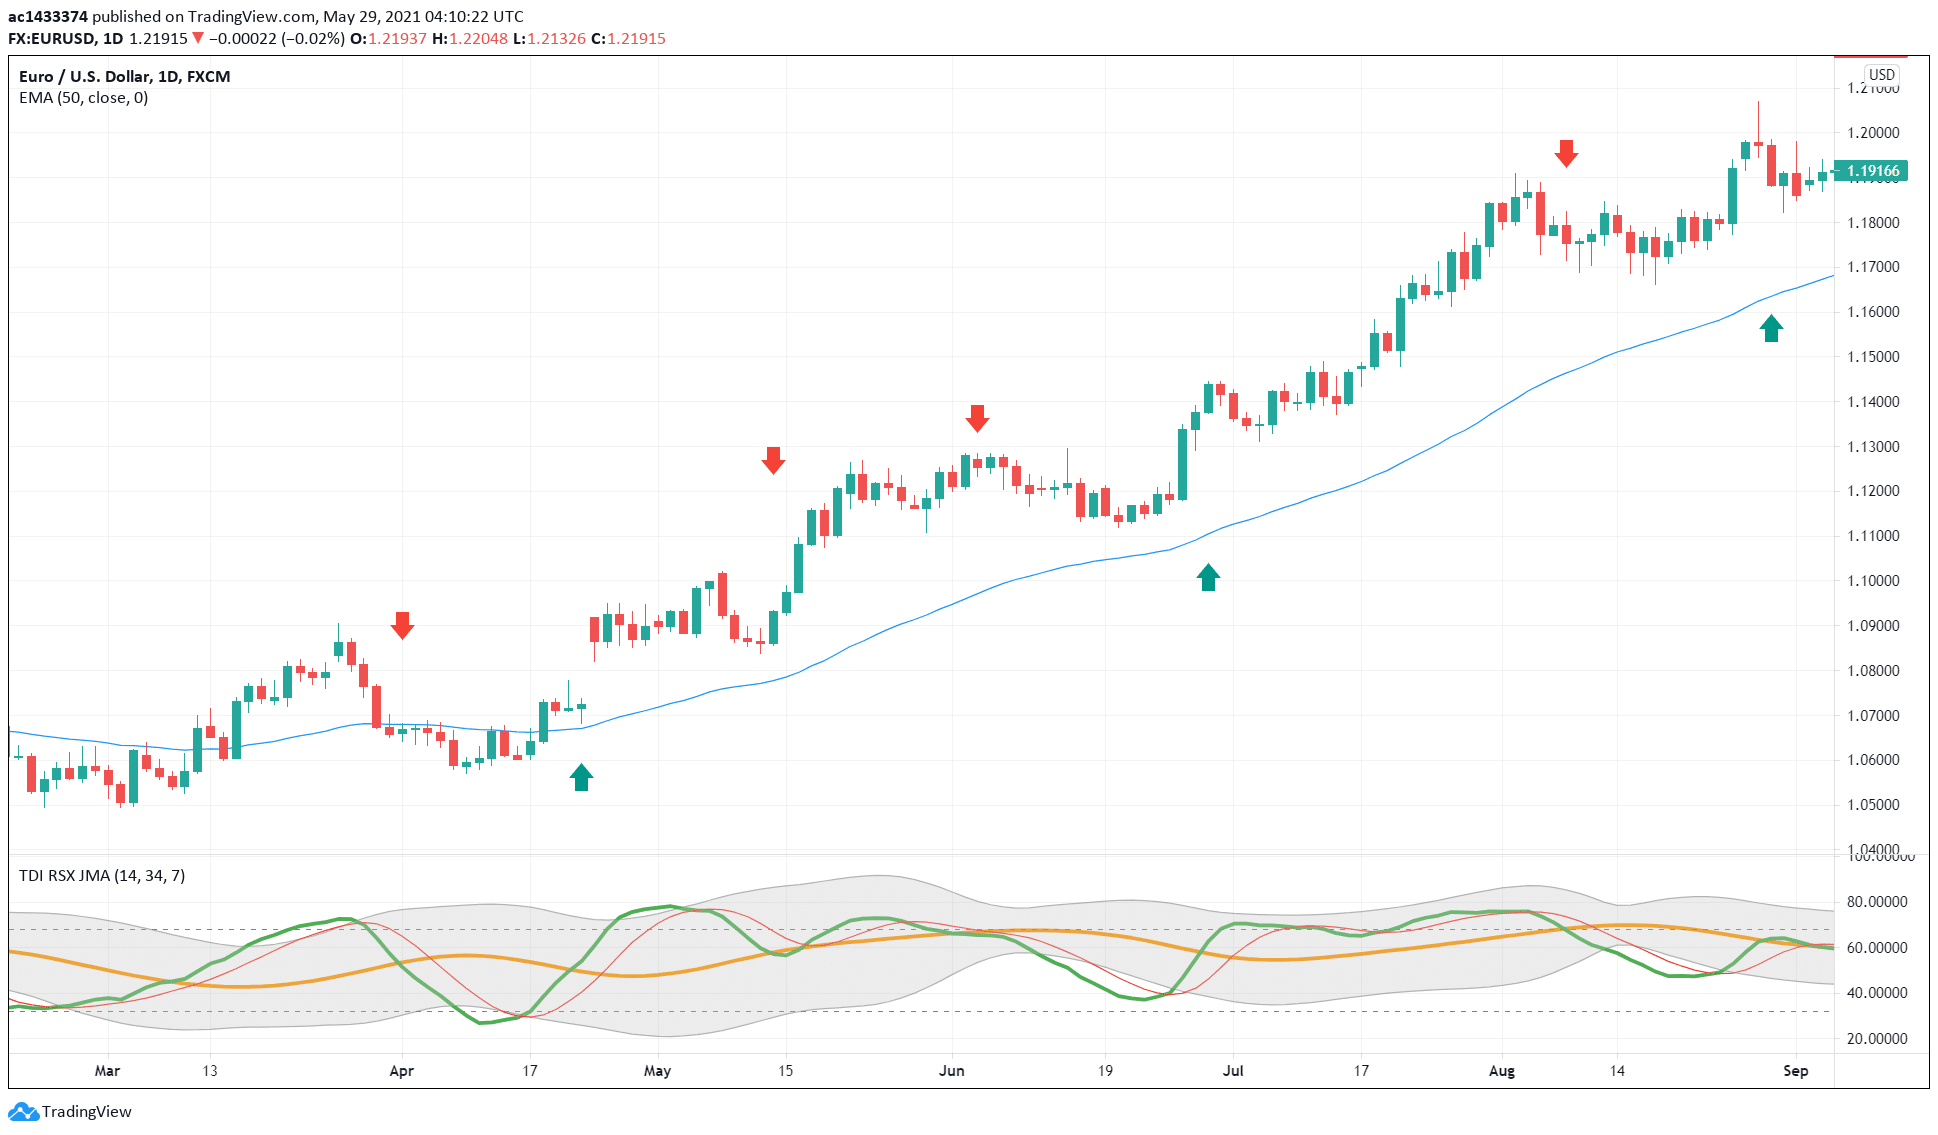
Trade №5: Market baseline and RSI price line crossover
A crossover of the RPL and MBL generally suggests a shift in market sentiment, MBL being an indicator of trend direction. When the RPL crosses above the MBL from below, that is a signal for a buy entry. When the RPL crosses below the MBL from above, that signals a sell entry. Looking at the charts, you can confirm that it is possible to use the TDI this way, though not optimal.
The best strategy to take crossovers when such align with the dominant trend. If the trend is generally bullish on the chart under consideration, you should take bullish crossovers only and overlook bearish crossovers. The above chart depicts such a scenario. The red down arrows marked the bearish crossovers, while the green up arrows marked the bullish crossovers. Since the market is generally uptrend based on the 50 EMA, you must buy signals only, which have higher chances of success than the sell signals.
Final thoughts
The Traders Dynamic Index has slowly gained traction as an indicator of choice among traders. Many algorithmic traders have developed trading systems primarily around this tool. The author’s humble opinion is that TDI provides more high-quality signals than its predecessor (i.e., relative strength index). Of course, these signals are more effective when taken with the trend.
One final note for the reader: various types of TDI exist online, and they seem to work differently. The best one among them appears to be the version that uses RSX as the RSI type and comes with the modifier “smoothed” in its name. That version presents an RSI line that is very smooth and follows the price closely. Find this TDI version, install it on your platform, trade with it, and see if it improves your trade results.