
The price movement leaves footprints through price candles. Professional traders often observe price candles beside other technical and fundamental market contexts to determine precious trading positions. The three white soldiers’ pattern declares a loud and clear signal to the traders who know about this technical figure.
However, trading with any pattern involves understanding the concept besides learning the potentiality and drawbacks of that specific pattern. This article will describe trading strategies using this pattern with chart attachments.
Later we list the top pros and cons of using this figure on live trading.
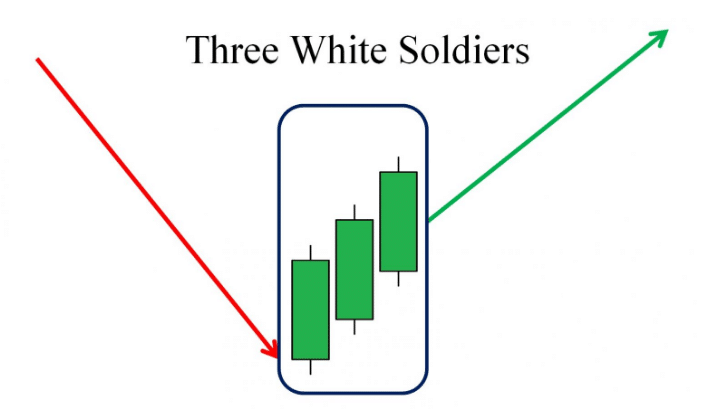
What is the three white soldiers’ pattern?
It is a unique pattern that contains three bullish candles, signaling a possible upward price movement. This pattern is fully potential when it occurs near the finish line, generating a bullish reversal signal.
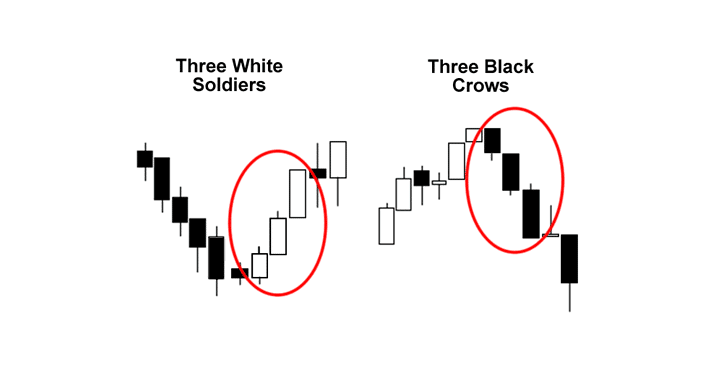
The three white soldiers pattern is the exact opposite version of the three black crows pattern, where the first candle will be a bullish after a bearish trend. The opening price of the second candle will be near the closing of the previous candle. The closing price will be above the opening of that candle.
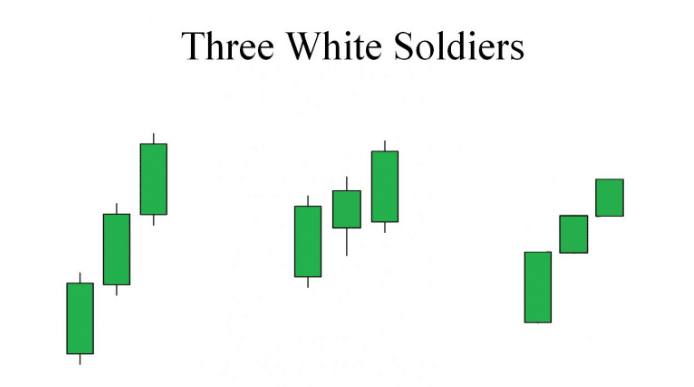
Meanwhile, the third candle will be similar to the second candle and a bullish one. This pattern has historical conditions, such as complete bullish candles with tiny or no upper wicks. Traders nowadays ignore those detail factors as three bullish candles in a row declare a sufficient bullish pressure on the asset price.
How to trade using three white soldiers pattern
Trading using this pattern is easy. Identify this pattern in your chart and make trading positions by combining other technical, fundamental market contexts. The potentiality of this pattern is at its peak when it takes place at any support level below a downtrend.
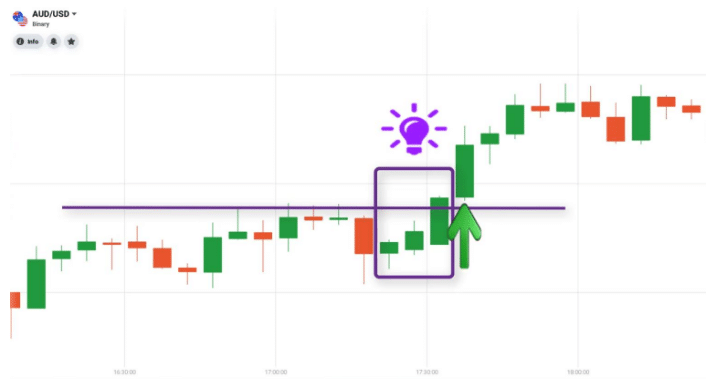
For example, you can place a buy order if the price breaks above any support resistance when the pattern occurs. Two consequences occur after this pattern: either the price trend gets sideways, or the price starts to move upward and create a bullish trend.
Traders use several indicators that define volume, momentum, trend, and technical tools, such as support resistance, Fibonacci retracements, etc., to catch potential trading positions. Entry/exit confirmation comes from those tools and indicators.
A short-term trading strategy
In our short-term trading technique, we use Hull moving average value of 20 besides this multi candle pattern to generate trade ideas. This strategy suits any asset’s 15 min or hourly time frame chart with sufficient volatility.
HMA is a trading indicator that signals bullish price movement when it slopes at the upside and vice versa when it slips at the downside. Besides marking critical levels from upper timeframe charts such as monthly, weekly open-high-low-closing, historic levels, price action levels, etc., we draw support resistance levels. Then seek trading positions at 15min or hourly charts.
Bullish trade scenario
Mark the support resistance and vital levels from upper time frame charts and seek the three white soldiers’ pattern near support levels after a bearish trend. Check when:
- The pattern completes formation and price breaks above any level that you mark.
- Price candles close above the HMA line.
- HMA is sloping on the upside.
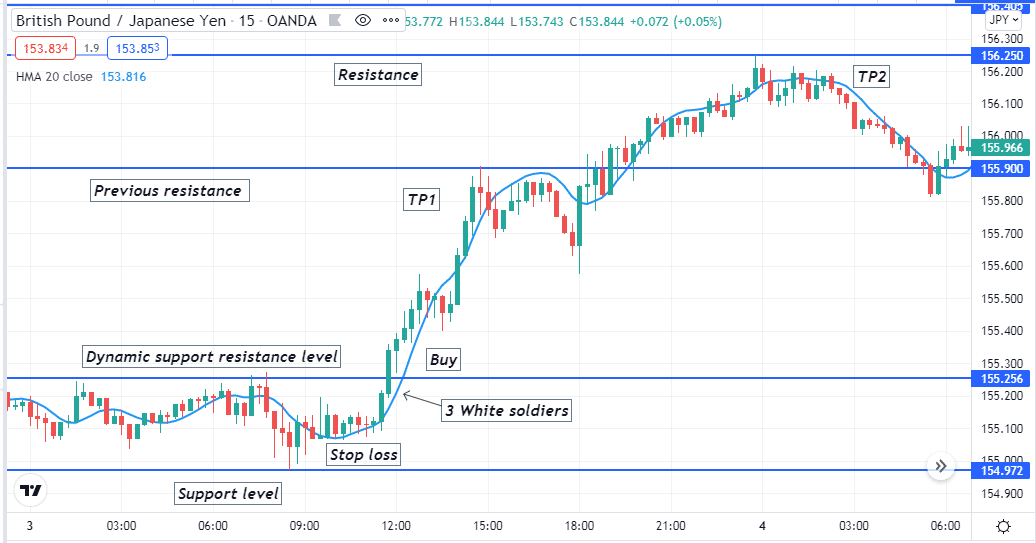
Entry
When these conditions above match with your target asset chart, place a buy order.
Stop-loss
The initial stop-loss level for your buy order will be below the current swing low.
Take profit
The initial profit target will be below the current previous resistance level. You can continue your buy order if the price continues further high after breaking that level. Otherwise, close the position manually if candles start closing below the HMA line.
Bearish trade scenario
Mark the support resistance and vital levels from upper time frame charts and seek the three black crows’ pattern near resistance levels after a bullish trend. Check when:
- The pattern completes formation and price breaks below your mark level.
- Price candles close below the HMA line.
- HMA is sloping on the downside.
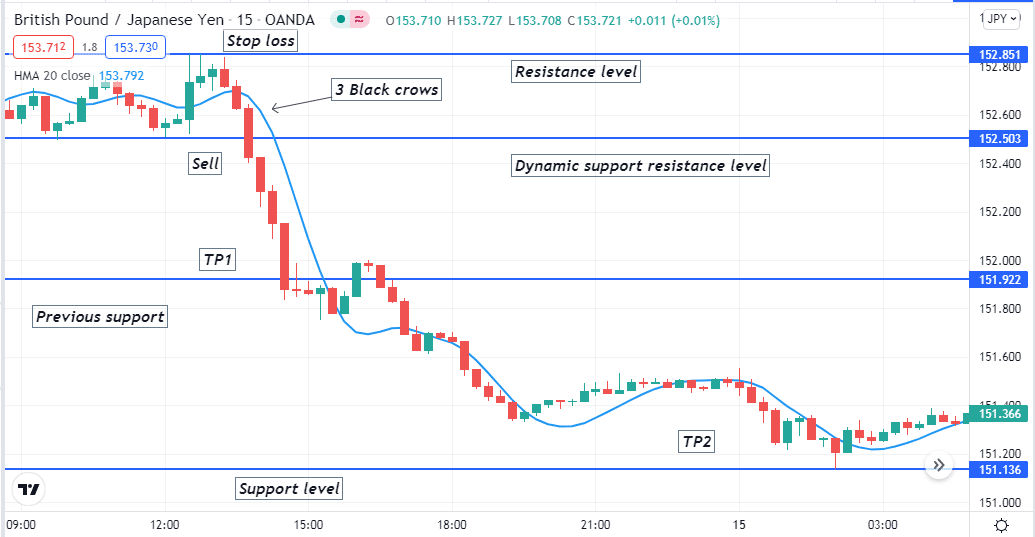
Entry
When these conditions above match with your target asset chart, place a sell order.
Stop-loss
Your sell order’s initial stop loss level will be above the current swing high.
Take profit
The initial profit target will be above the current previous support level. You can continue your sell order if the price continues further declining after breaking that level. Otherwise, close the position manually if candles start closing above the HMA line.
A long-term trading strategy
Besides using this pattern, our long-term trading strategy contains two technical indicators, the RSI and the parabolic SAR. We recommend using an H4 or above time frame chart to obtain satisfactory results through this trading method.
Bullish trade scenario
Set those indicators and observe when the three white soldiers pattern appears at your target asset chart after a downtrend. Check if:
- Parabolic dots takes place below price candles.
- RSI dynamic line is at or above the central (50) line heading toward the upside.
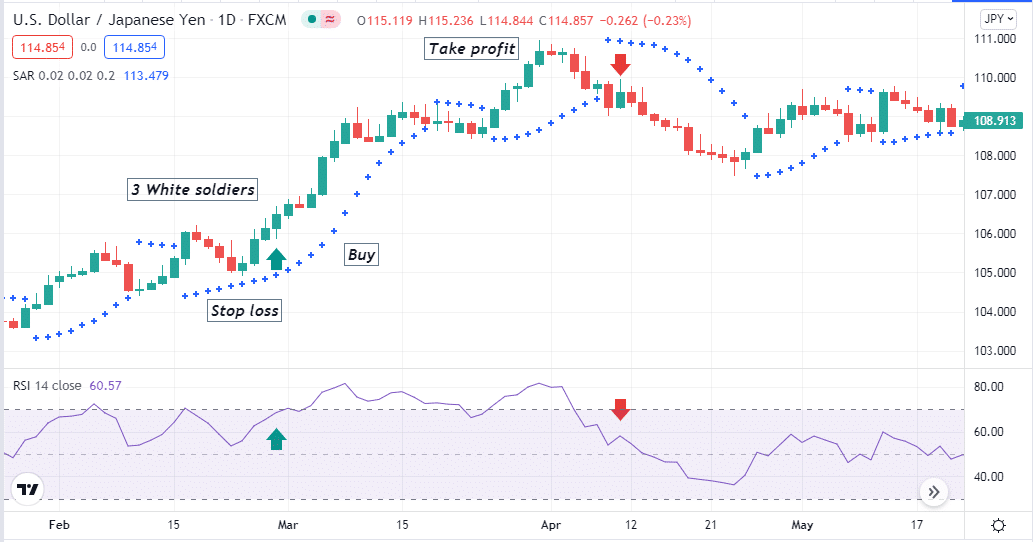
Entry
When these conditions above match with the target asset chart, place a buy order.
Stop loss
Set an initial stop loss for your buy order below the current swing low.
Take profit
Close your buy order when:
- Parabolic dots take place above price candles.
- RSI dynamic line is heading toward the downside after reaching the upper (80) line.
Bearish trade scenario
Set those indicators and observe when the three black crows pattern appears after an uptrend at your target asset chart. Check if:
- Parabolic dots take place above price candles.
- RSI dynamic line is at or below the central (50) line heading toward the downside.
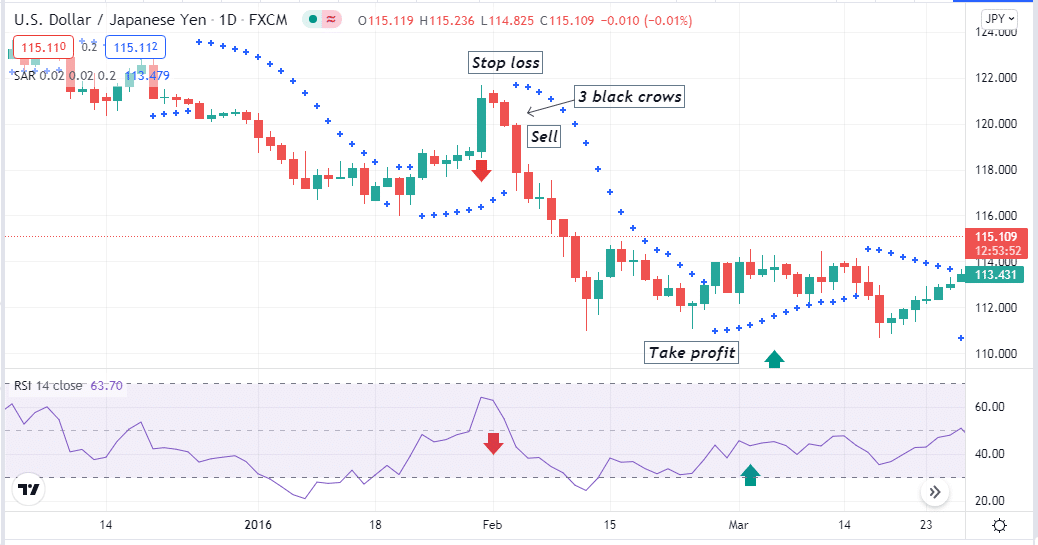
Entry
When these conditions above match with the target asset chart, place a sell order.
Stop loss
Set an initial stop loss for your sell order above the current swing high.
Take profit
Close your sell order when:
- Parabolic dots take place below price candles.
- RSI dynamic line is heading toward upside after reaching the lower (20) line.
Pros and cons
| Pros | Cons |
| Identifying this pattern is easy. | Traders need to use other technical indicators or tools to get complete trade setups. |
| You can trade many trading assets using this pattern. | This pattern can fail due to fundamental reasons. |
| This pattern allows making both short-term and long-term trading positions. | Requires specific skills to combine this pattern with other technical and fundamental market contexts. |
Final thought
Finally, we describe all primary info about the three white soldiers pattern in our article. Moreover, complete trading strategies to better understand. To check the potentiality and drawbacks of these patterns and strategies, you may practice demo trading before applying live trading.