
In financial trading, the price movements always create swing highs and lows. The zigzag pattern allows traders to determine those swing levels, so financial traders frequently consider this pattern while making trade decisions.
Every pattern is unique in a forex trading chart and interprets the market context differently. So it is mandatory to understand the pattern to execute it for successful trading. This article introduces the zigzag pattern and describes trading strategies with it.
What is the Zig Zag pattern?
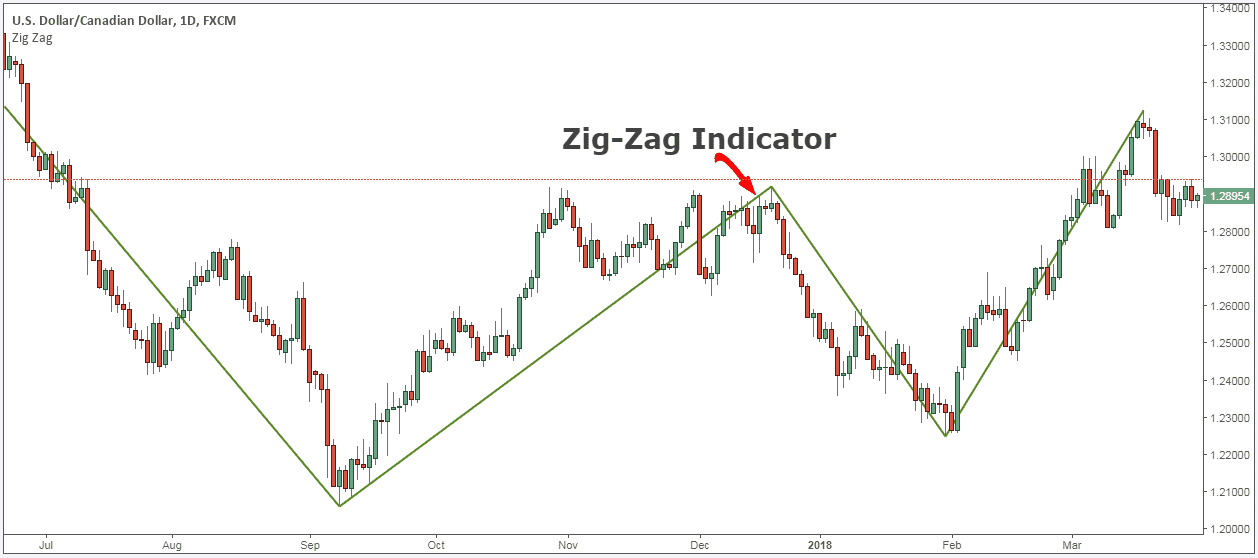
The Zig Zag pattern usually detects the swing points by reducing market noise by filtering out smaller price movements. This pattern allows traders to determine the exact swing lows and highs on various time frame charts. The indicator is valuable to determine these levels, precisely the depth of price movement and the rising points. Filtering out these factors enables obtaining the view of the forest rather than just looking at a particular tree.
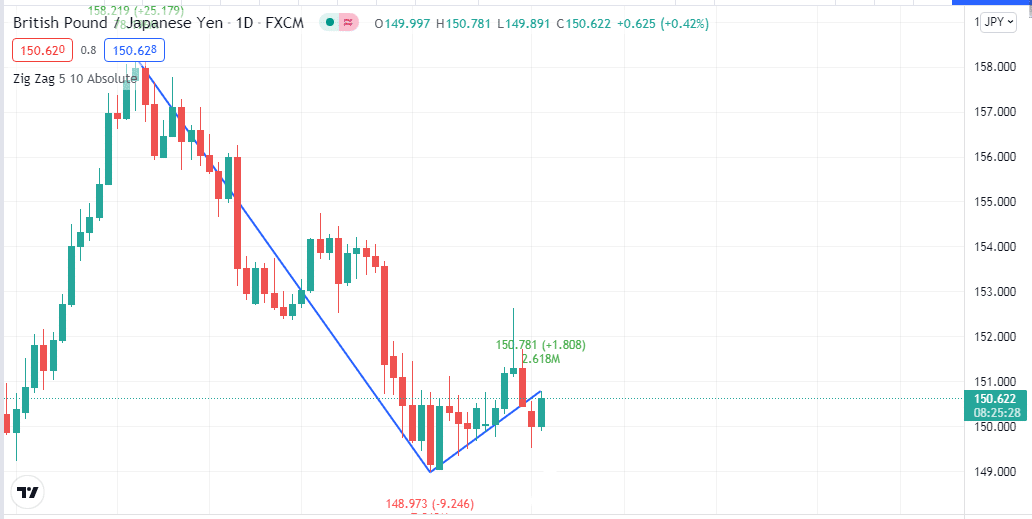
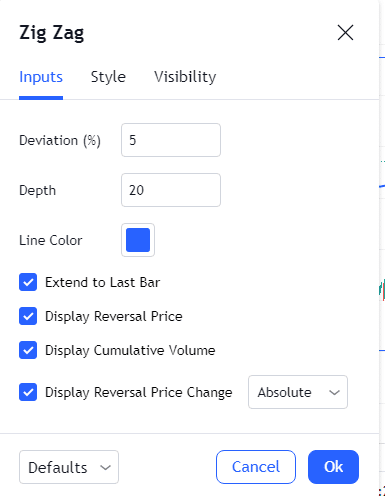
This indicator has features to set values. For example, you set the deviation value to 10; then this indicator will only show the price movements that are greater than 10%. This indicator cannot predict future movement, only results depending on hindsight.
How to trade using the Zig Zag pattern
The pattern cannot generate any future prediction on the price movement. You can use this pattern to combine with other technical indicators and tools to generate invincible trading ideas. The Elliot wave is a technical indicator that generates trade signals depending on this zigzag concept. This pattern determines the swing levels, so using other indicators and technical concepts can create an acceptable trading method.
For example, check the chart below. The pattern determines lines that show A, B, C, D, four points, and the AB is similar to the CD.
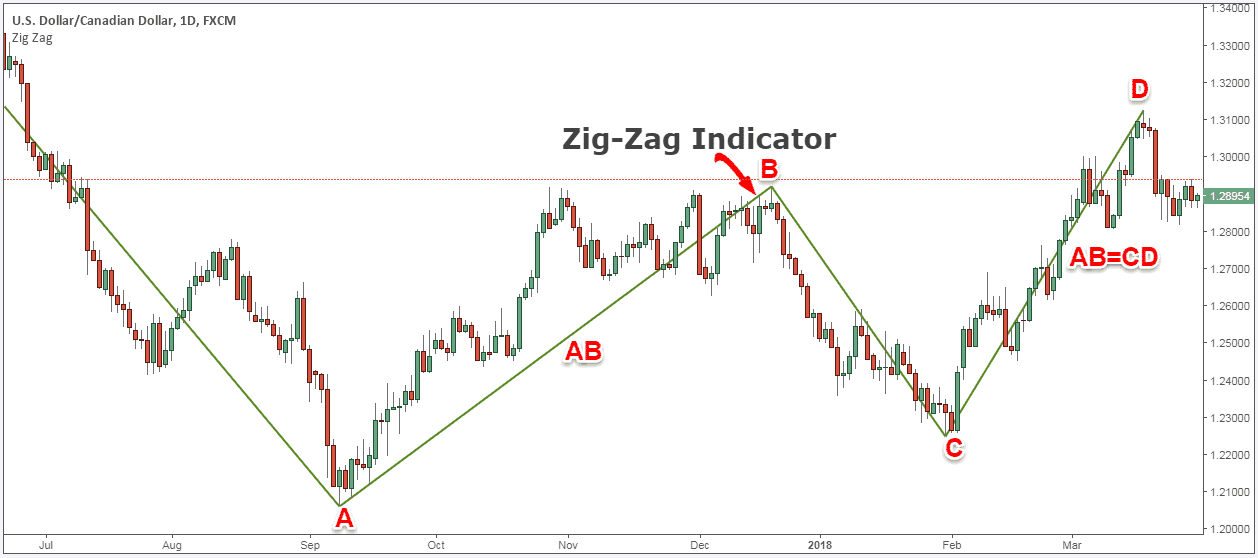
Why is that?
It is a price action concept that after a bullish move when the price retraces or declines back to a certain level. When a buyer comes back, the price usually increases like previous bullish movements. The Elliot wave indicator also uses this concept to generate trading ideas.
A short-term strategy
Our short-term trading method uses the support resistance concept alongside the Zig Zag pattern/indicator. We use the indicator setting’s deviation value 5 and depth value 20. Then we draw support resistance levels from upper time frame charts such as daily or likely. Meanwhile, we also have prior basic levels like historical support resistance, weekly and monthly open, high, low, close, etc., as these levels show some effectiveness in lower time frames.
Additionally, traders can use the ADX indicator for breakout confirmation. The price that remains above the zigzag line declares sufficient bullish pressure on the asset price, and when the price reaches below the zigzag line, it declares declining pressure on the asset price.
Best time frames to use
You can use this method in any time frame between 1min-hourly chart; we recommend using a 15-min chart to catch the best short-term trading positions.
Bullish trade setup
Observe the price reaction on the zigzag line when the price declines back to the zigzag line after making a higher high.
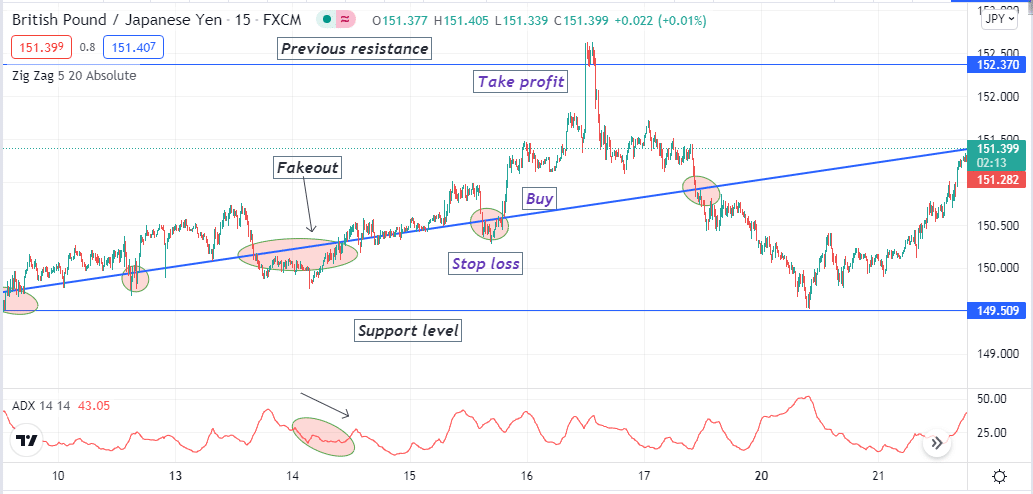
Entry
When the price tests the zigzag line and starts bouncing on the upside, check the ADX indicator. If the ADX value exceeds 20, place a buy order after the current bullish candle closing.
Stop loss
Place an initial stop loss below the zigzag line with a 5-10 pips buffer.
Take profit
Set an initial profit target below the previous resistance level.
Bearish trade setup
Observe the price reaction on the zigzag line when the price increases back to the zigzag line after making a lower low.
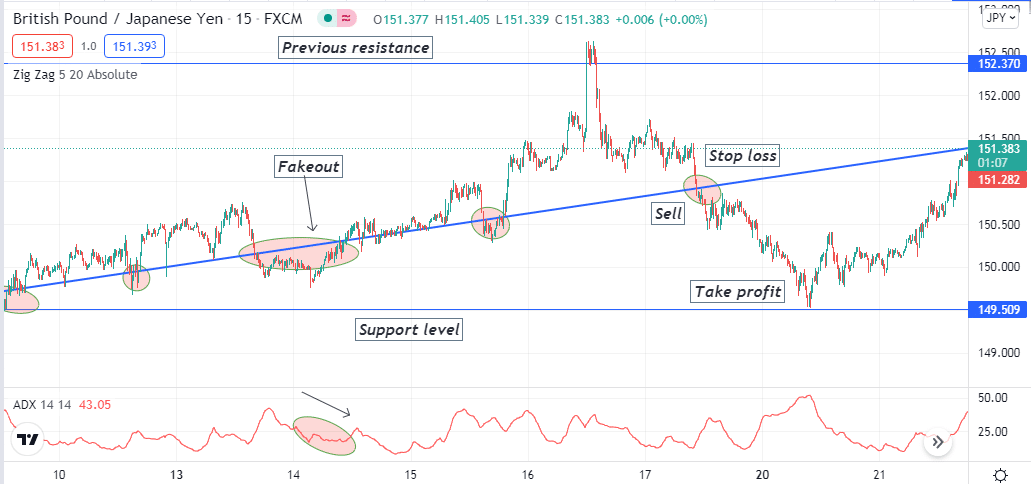
Entry
When the price tests the zigzag line and starts declining on the downside, check the ADX indicator. If the ADX value exceeds 20, place a sell order after the current bearish candle closing.
Stop loss
Place an initial stop loss above the zigzag line with a 5-10 pips buffer.
Take profit
Set an initial profit target above the previous support level.
A long-term strategy
We combine the Zig Zag pattern, the RSI indicator, and the Fibonacci retracement levels to determine entry/exit positions in this long-term trading method. For example, when the price creates an uptrend movement and starts to decline, we set the Fibonacci retracement tool to observe price movement on adequate levels such as 50%-80% levels signals an upcoming bullish pressure. Then we check on the RSI indicator readings to generate a complete trade idea.
Best time frames to use
We recommend using this method on an H4 or daily chart to catch the best long-term trades.
Bullish trade setup
When the price creates a higher high and starts to decline, set the Fibonacci tool from that previous high to the last low and check:
- The price starts to bounce back on the upside from the effective reversal zone.
- The RSI line is above the central (50) line and moving upside down.
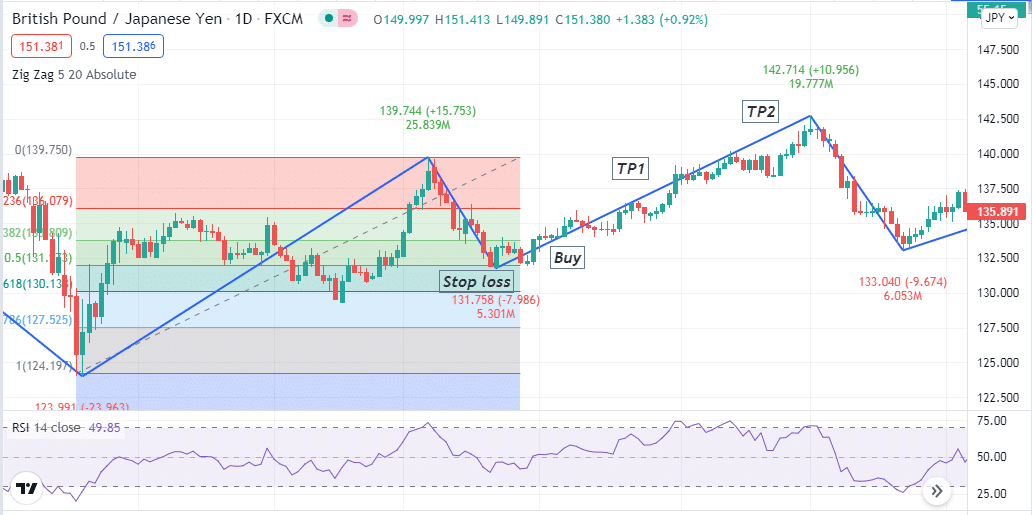
Entry
Match these conditions above and place a buy order.
Stop loss
Place an initial stop loss below the current swing low.
Take profit
The initial take profit will be near the previous high. In most cases, the price reaches above that level and makes another higher high. In that case, close the buy position when the RSi line moves from the upper (70) level on the downside.
Bearish trade setup
When the price creates a lower low and starts to bounce upside, set the Fibonacci tool from that previous low to the last high and check:
- The price starts to decline back on the downside from the effective reversal zone.
- The RSI line is below the central (50) line and moving on the downside.
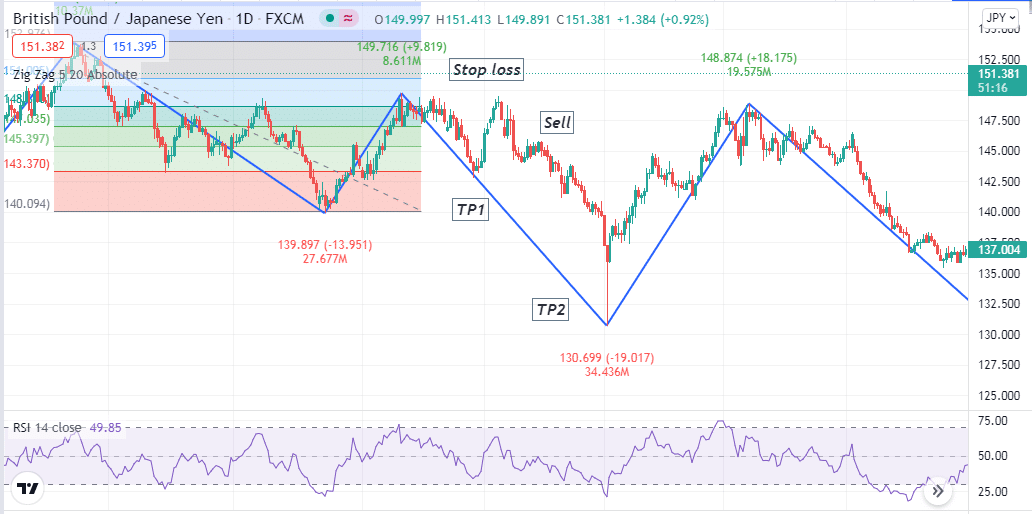
Entry
Match these conditions above and place a sell order.
Stop loss
Place an initial stop loss above the current swing high.
Take profit
The initial take profit will be near the previous low. In most cases, the price reaches below that level and makes another lower low. In that case, close the sell position when the RSi line moves from the lower (30) level on the upside.
Pros and cons
| Pros | Cons |
| The winning ratio is good. | This pattern generates false signals in lower time frames. |
| A concept that professional traders use. | It can gain due to fundamental events. |
| This pattern applies to many trading assets. | It is always requires other supporting technical tools/indicators to create complete trade setups. |
Final thought
Finally, the Zig Zag pattern is typical of any financial asset chart formation. We suggest creating trading methods using this pattern by combining other technical tools and indicators to generate more precious trade ideas. You can use other indicators like MACD, MA crossover, Parabolic SAR, etc.