
In financial market trading, catching trendy positions enables considerable profits and reduces risks on capital. Therefore, using indicators, which helps to increase the trade’s probability, might enrich your portfolio with more profits than usual.
The ADX indicator is among the best choosable trading tools for financial investors, which can increase trading accuracy. However, It is better to understand the ADX components and interpret the market context before using it to make trade decisions.
The following section will reveal the ADX indicator and procedures to execute successful trades using this technical tool.
What is the average directional movement index indicator?
The ADX indicator is a popular technical indicator for measuring the current trend’s strength. Welles Wilder is the developer of this unique technical indicator that defines the strengths and weaknesses of any trend by using DMI+ and DMI- calculations. It is an ultimate trend indicator that defines the strengths/weaknesses of trends.
This indicator usually reflects the contraction or expansion of the price range of any trading instrument over a specific period. Although you can modify the periods, the default setting for the ADX indicator is 14 bars. All the necessary calculations this indicator uses involve some complications. The fact is, you don’t need to do any of that yourself; it just requires observing the indicator readings at your desirable period.
How to trade using the ADX indicator?
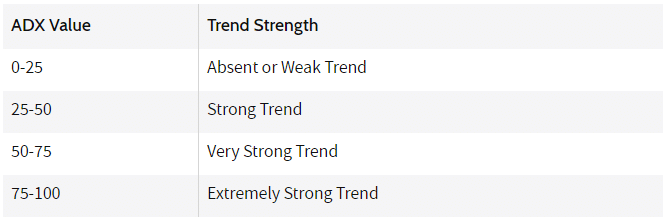
The ADX indicator shows readings on an independent window containing a dynamic line within a zero parameter to a hundred. When the ADX value increases, it declares positive strength on the current trend.
- The reading below 20 declares weakness.
- Meanwhile, the most strength is when the reading is above 70.
- Many traders use the value 20 to enter the marketplace, and many use 25 or above.
For example, a bullish trend starts, and the ADX value is increasing and declares bullish trend getting strength if the ADX value declares weakness of the bullish trend.
There is confusion among novice users that if the ADX value drops, it may signal a reversal, which is not valid. The price can be in a consolidating phase and may be waiting to regain strength to move further in the same direction.
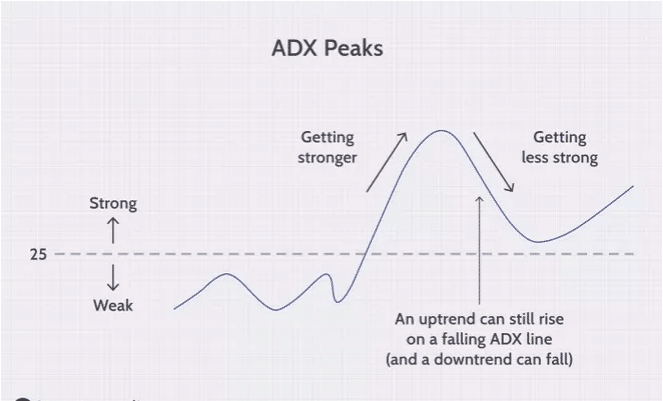
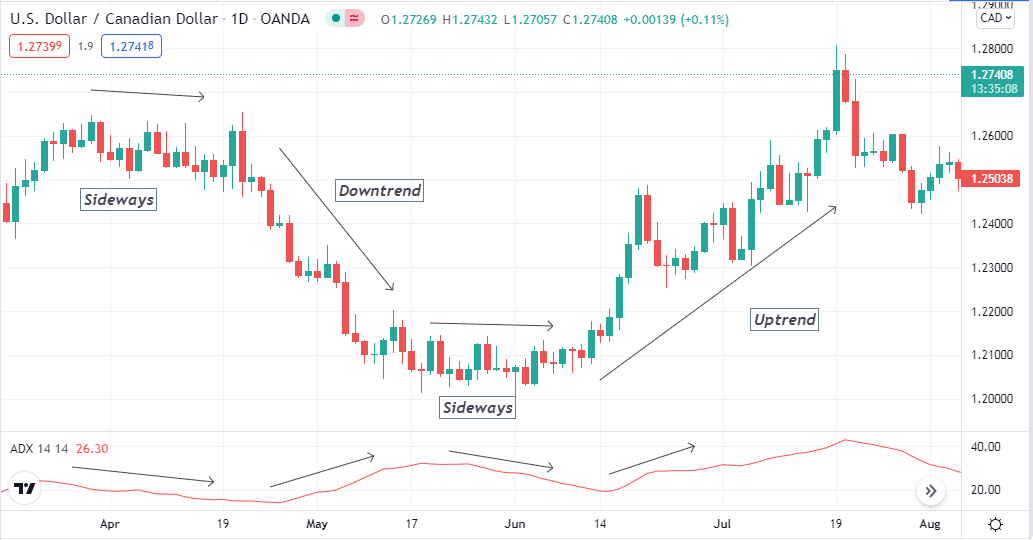
The ADX indicator also shows momentum divergence on the asset price movement. For example, when the ADX line makes a few lower peaks to draw a trendline that slopes downward, it declares a possible trend-changing environment.
You can use other indicators alongside the ADX to generate precious trade ideas rather than use it as a standalone indicator. You can use this indicator frequently to trade indices, ETFs, stocks, currencies, or commodities.
A short-term trading strategy
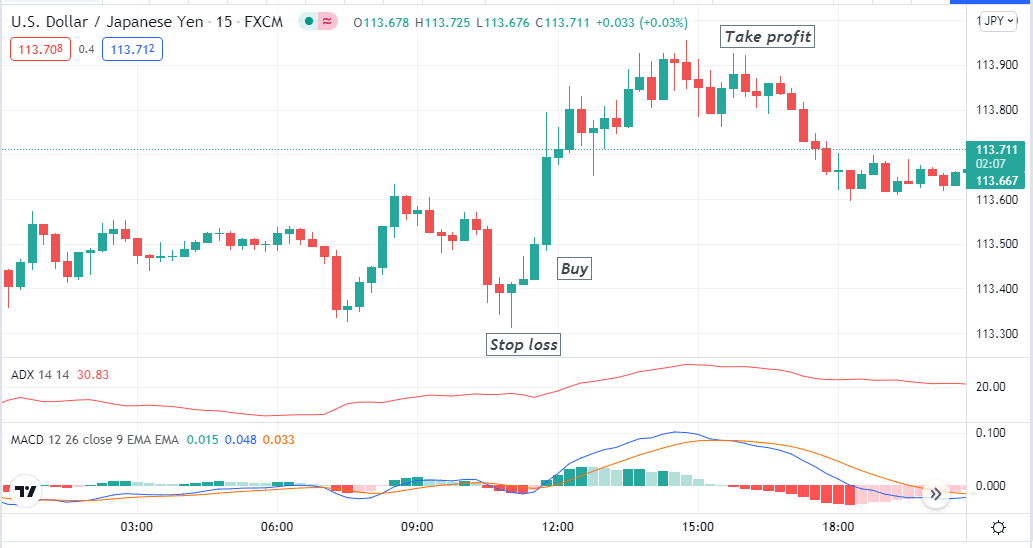
Our short-term trading method uses the MACD indicator alongside the average directional movement index (ADX). MACD is a popular momentum indicator that shows trends-changing points through two moving average lines. This indicator also contains histogram bars of different colours on different sides of a central line.
Best time frames to use
This method generates good short-term trading ideas using a 15-min chart.
Bullish trade scenario
First, identify the trend is bullish by observing the MACD indicator window. Then seek potential buy positions when:
- The dynamic blue line crosses above the dynamic red line on the MACD window.
- MACD green histogram bars occur above the central line.
- ADX value is above 20.
Entry
Open a buy position when these conditions above match your target asset chart.
Stop loss
Set an initial SL below the current swing low with a buffer of 5-10pips.
Take profit
Close the buy position when:
- When the opposite crossover between those dynamic lines on the MACD window.
- MACD red histogram bars occur below the central line.
- ADX value is dropping.
Bearish trade scenario
First, identify the trend is bearish by observing the MACD indicator window. Then seek potential sell positions when:
- The dynamic blue line crosses below the dynamic red line on the MACD window.
- MACD red histogram bars occur below the central line.
- ADX value is above 20.
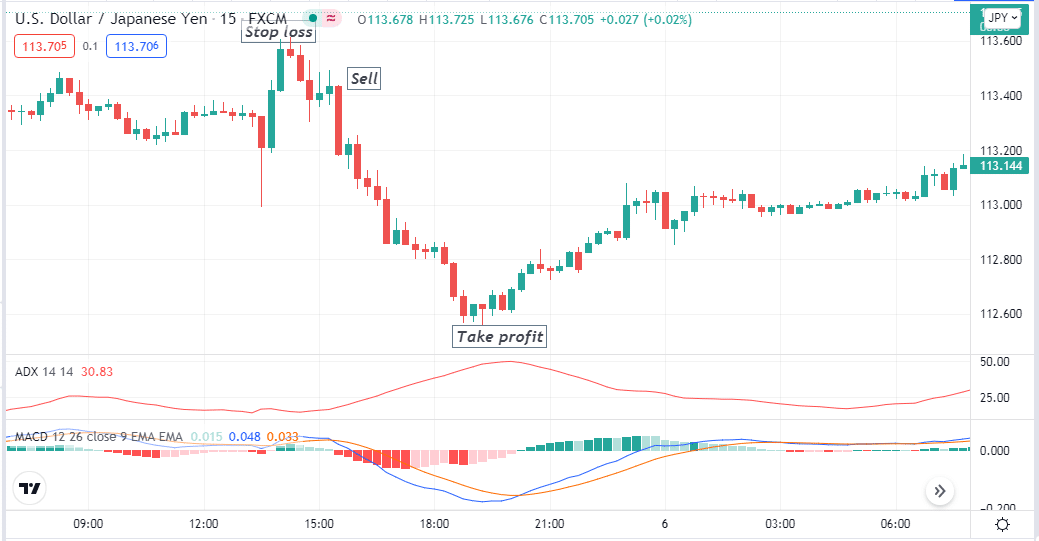
Entry
Open a sell position when these conditions above match your target asset chart.
Stop loss
Set an initial SL above the current swing high with a buffer of 5-10pips.
Take profit
Close the sell position when:
- When the opposite crossover between those dynamic lines on the MACD window.
- MACD green histogram bars occur above the central line.
- ADX value is dropping.
A long-term trading strategy
This long-term trading method contains the stochastic indicator beside the ADX. The technique is simple, identify the trend through the stochastic and then place trades when the ADX declares sufficient strength.
Best time frames to use
Use time frames of H4 or above to generate long-term trade ideas.
Bullish trade scenario
Apply those indicators and seek to open buy positions when:
- The dynamic blue line crosses the dynamic red line on the upside at the stochastic window.
- The crossover occurs near the oversold level.
- Both lines are heading on the upside.
- The ADX value is above 20.
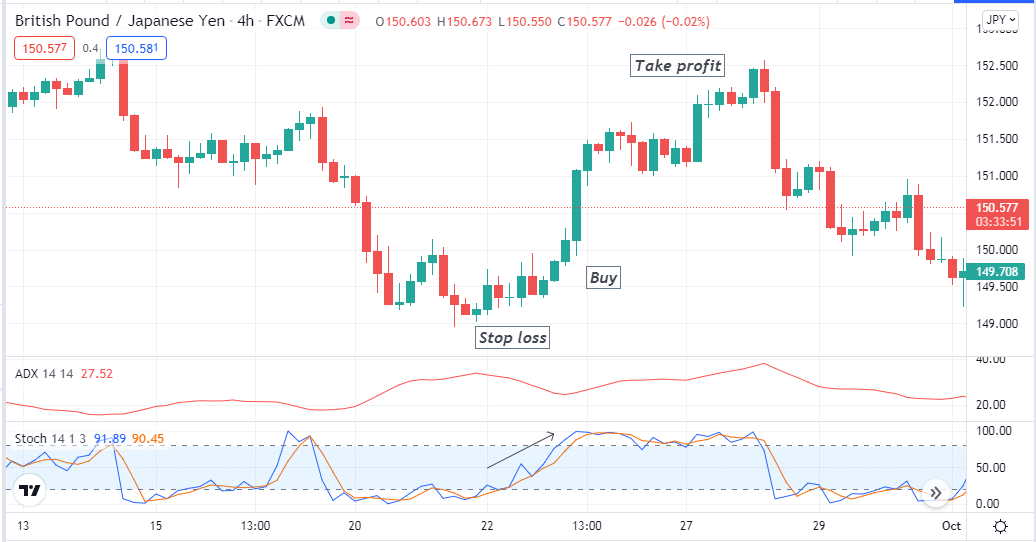
Entry
Match these conditions above, then place a buy order.
Stop loss
The initial SL level is below the current swing low when the price bounces on the upside.
Take profit
Close the buy position when:
- The stochastic lines reach the overbought level or head toward down after reaching that level.
- The ADX value is dropping.
Bearish trade scenario
Apply those indicators and seek to open sell positions when:
- The dynamic blue line crosses the dynamic red line on the downside at the stochastic window.
- The crossover occurs near the overbought level.
- Both lines are heading on the downside.
- The ADX value is above 20.
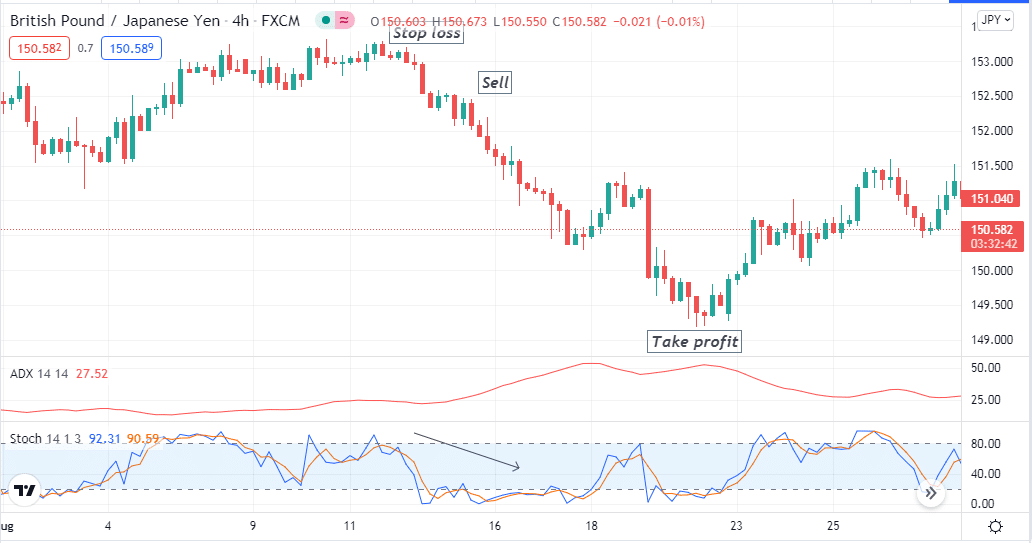
Entry
Match these conditions above, then place a sell order.
Stop loss
The initial SL level is above the current swing high level, where the price declines.
Take profit
Close the sell position when:
- The stochastic lines reach the oversold level or head toward the upside after reaching that level.
- The ADX value is dropping.
Pros and cons
| Pros | Cons |
| The tool helps to find a strong trend. | You can consider it as a lagging indicator that follows price and is less effective on sideways price movements. |
| It is a highly reliable indicator in the trending market. | It often generates false signals in shorter time frames. |
| This indicator alerts when the momentum is changing. | If you use it as a standalone indicator, it doesn’t suggest entry/exit points. |
Final thought
When it comes to catching a strong trend, the ADX indicator is the best. It is one of the complete indicators when you understand the concept and know how to use it. The best results you can get are pairing this indicator with other indicators like the RSI, parabolic SAR, etc.
However, it doesn’t always generate 100% accurate signals all the time. So traders often double-check readings and use multi-timeframe analysis before making trade decisions.