
Do you feel hesitant to trade because you are unable to predict the next price movement? Do you lack a trend trading strategy? You may have experienced several technical tools, but today, we will introduce a popular tool that gives you a trading opportunity in many ways. It’s called MACD. It is an oscillator that helps to forecast the trend and its strength. Let’s dive into further details.
What is MACD?
It is an oscillator that implies moving averages to search for a directional bias in the market. Mostly, you find three input parameters in the indicator settings:
- The fast EMA
- The slow EMA
- Time units of computing the variance between both EMAs
The default parameters for the tool are “12, 26, and 9”, which shows periods for slow EMA, fast EMA, and contrast between the two, respectively.
The tool shows two series:
- MACD line
- Signal line
The misconception about these series is that newbie traders think they are MAs.
- First, the MACD line (ML) shows the distinction between two moving averages, and the signal line computes the average of the ML.
- The objective of the signal line is to reduce the noise of responsiveness of the ML.
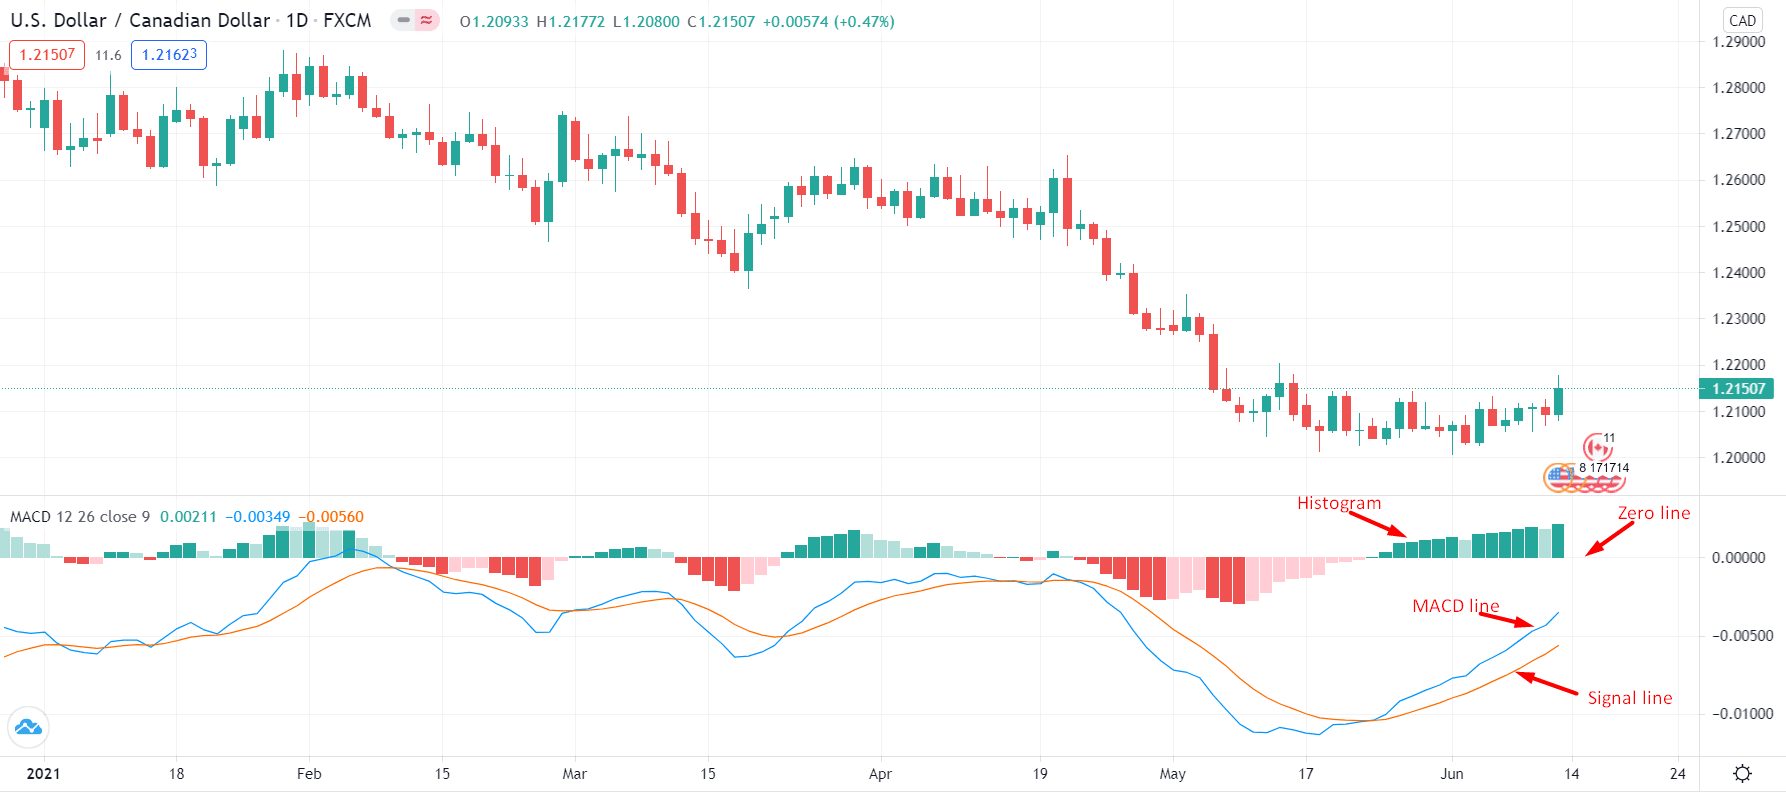
- Next, the tool’s histogram reveals the deviance between the signal line and the ML.
- The final part is the zero line or centerline that differentiates between a bullish and a bearish bias.
MACD calculation
You can calculate the indicator with a simple formula given below:
The formula = {12-period EMA} – {26-period EMA}
You get it by subtracting 26 periods from 12 periods, while EMA is an altered version of the moving average that gives more weight to the recent periods.
How does MACD work?
The tool can detect directional bias, but it is a lagging contrivance. However, the accuracy of forecasting trends is relatively high. Let’s explore the application of the tool on charts.
Histogram and zero line
When you place the indicator on your chart, you find red and green bars. These bars are histograms, and they reveal the current bias and its strength:
- The red bars show a running bearish bias.
- The green bars indicate a bullish bias.
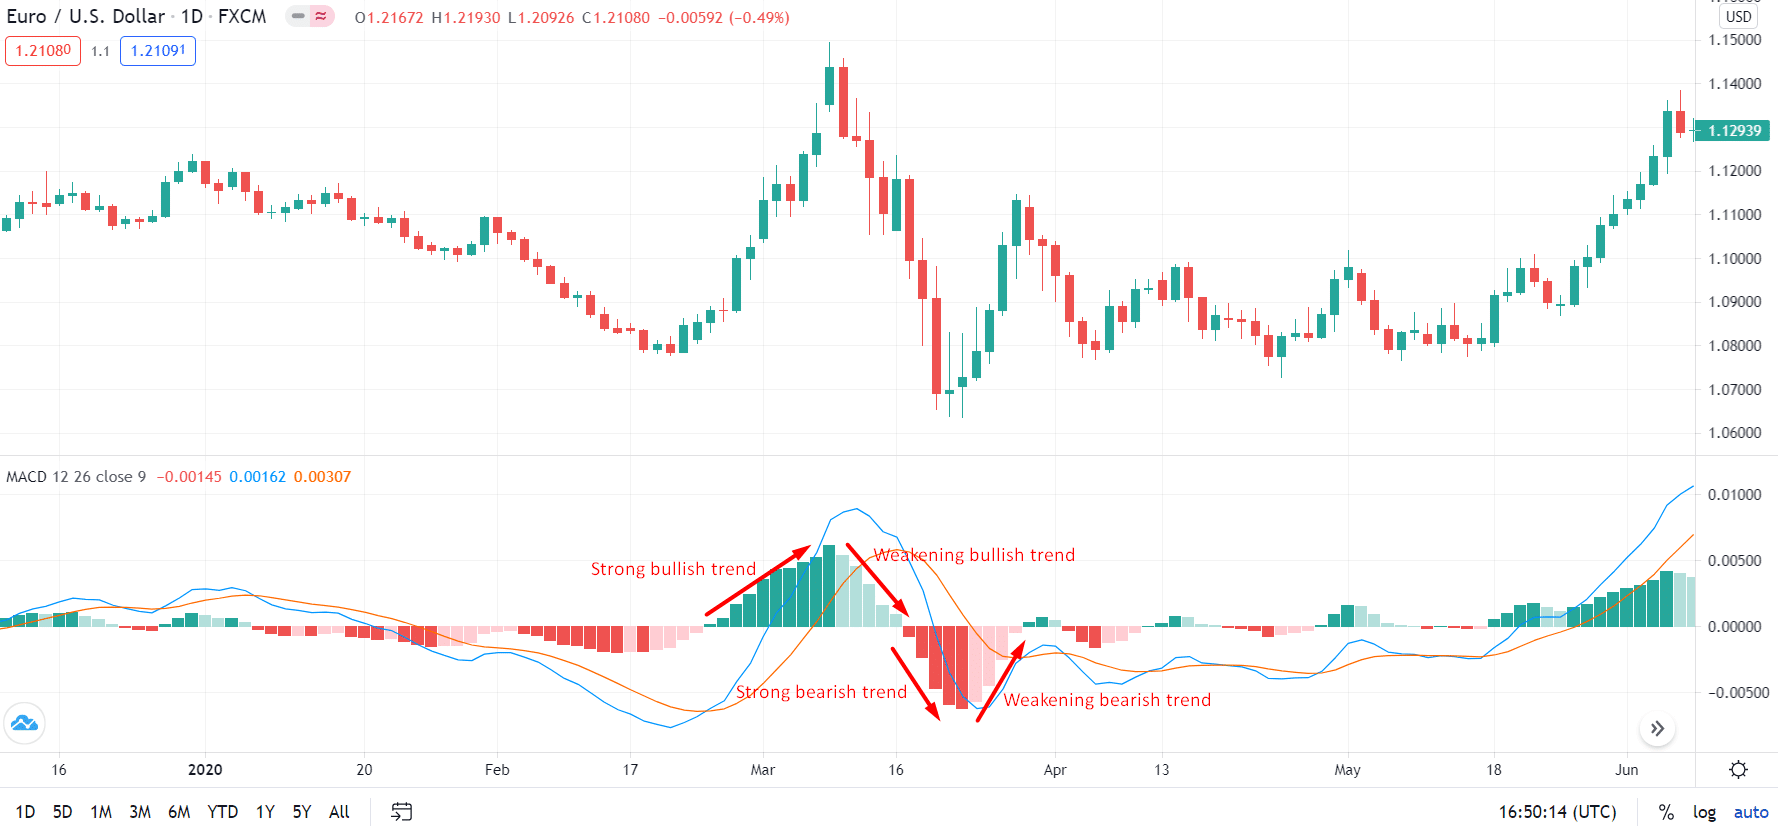
You can identify the strength/weakness of a trend with the size of bars. For example, if bars are stretching their lengths, it shows a stronger movement. Contrarily, if bars start contracting, it offers a weakening of a directional bias.
For example, if red bars increase the size on the downside, it indicates that the bearish bias is getting stronger. Similarly, the more extended size of green bars on the upside shows a stronger bullish trend, and reducing bar size shows that the bulls are weakening. Let’s look at the chart below.
In other words, the zero line is a decisive factor. The more stretch away from the zero line, the greater is the strength of a trend. We consider it a trend reversal if the bars move above or below the zero line. Like, bars move above the zero line, which means bullish trend reversal. If bars move from top to below the zero line, it shows a bearish trend reversal.
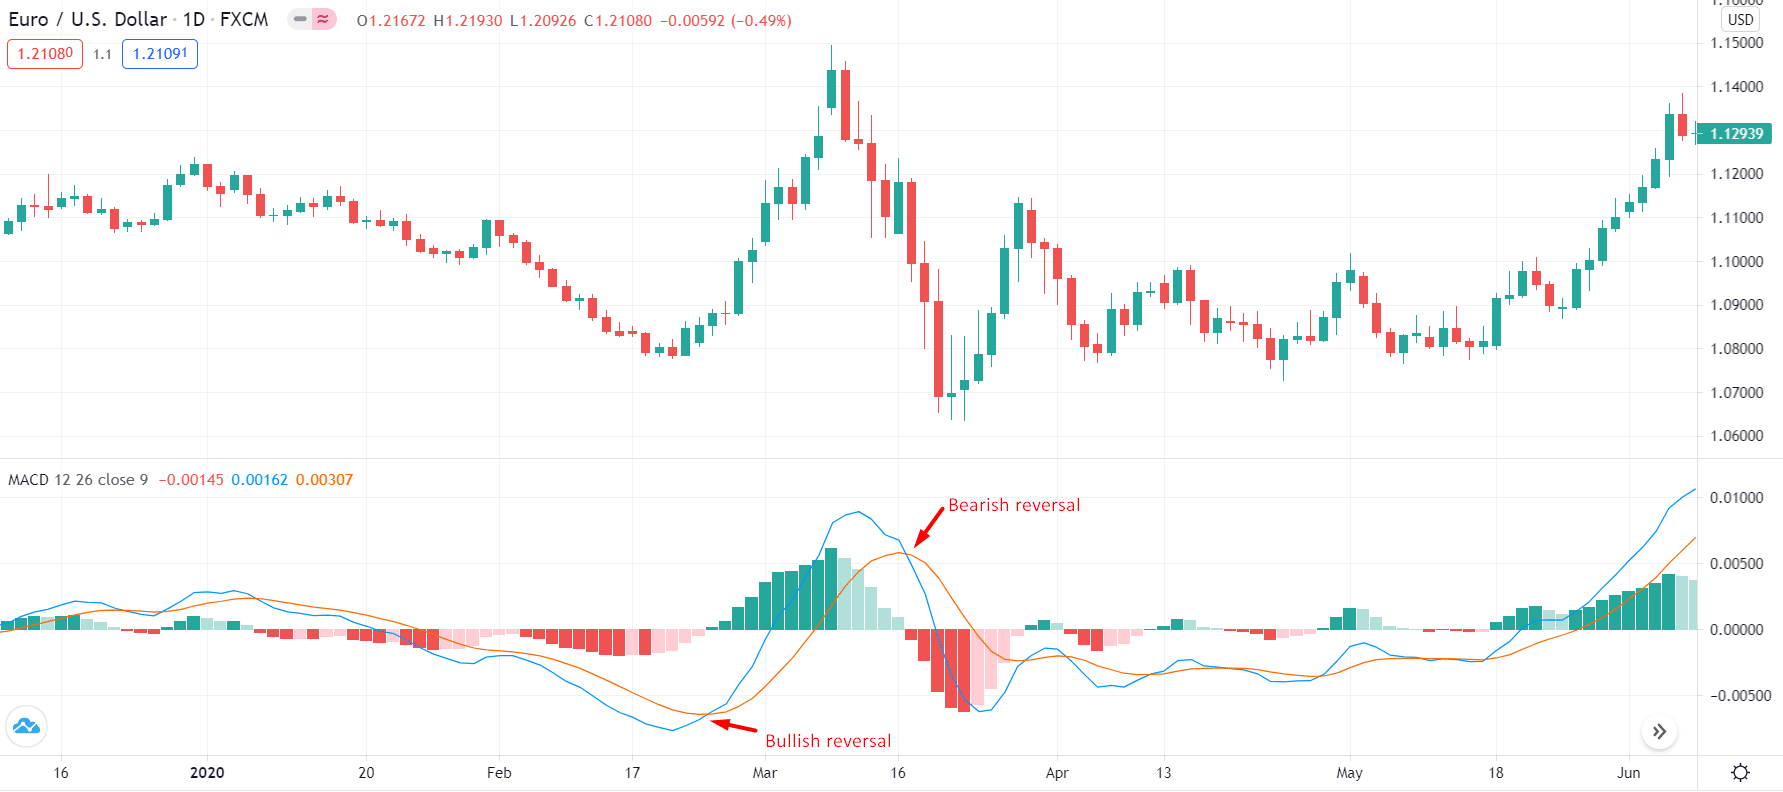
MACD crossover
You can also use the tool to predict earlier price change with the help of crossovers. For example, if the ML crosses the SL from the bottom towards the upside, it is a sign of bullish trend reversal.
Similarly, it indicates a bearish trend reversal if you find a crossover of ML with the signal line from top to bottom.
However, do observe that you’ll find many fake crossovers. So, you have to be cautious while dealing with crossovers. Therefore, you have to apply some filters to reduce the counterfeit setups. You’ll find more details in the next section about the trading strategies.
MACD trading strategies
Now you are well aware of the tool, let’s explore some high probability trading strategies of this instrument.
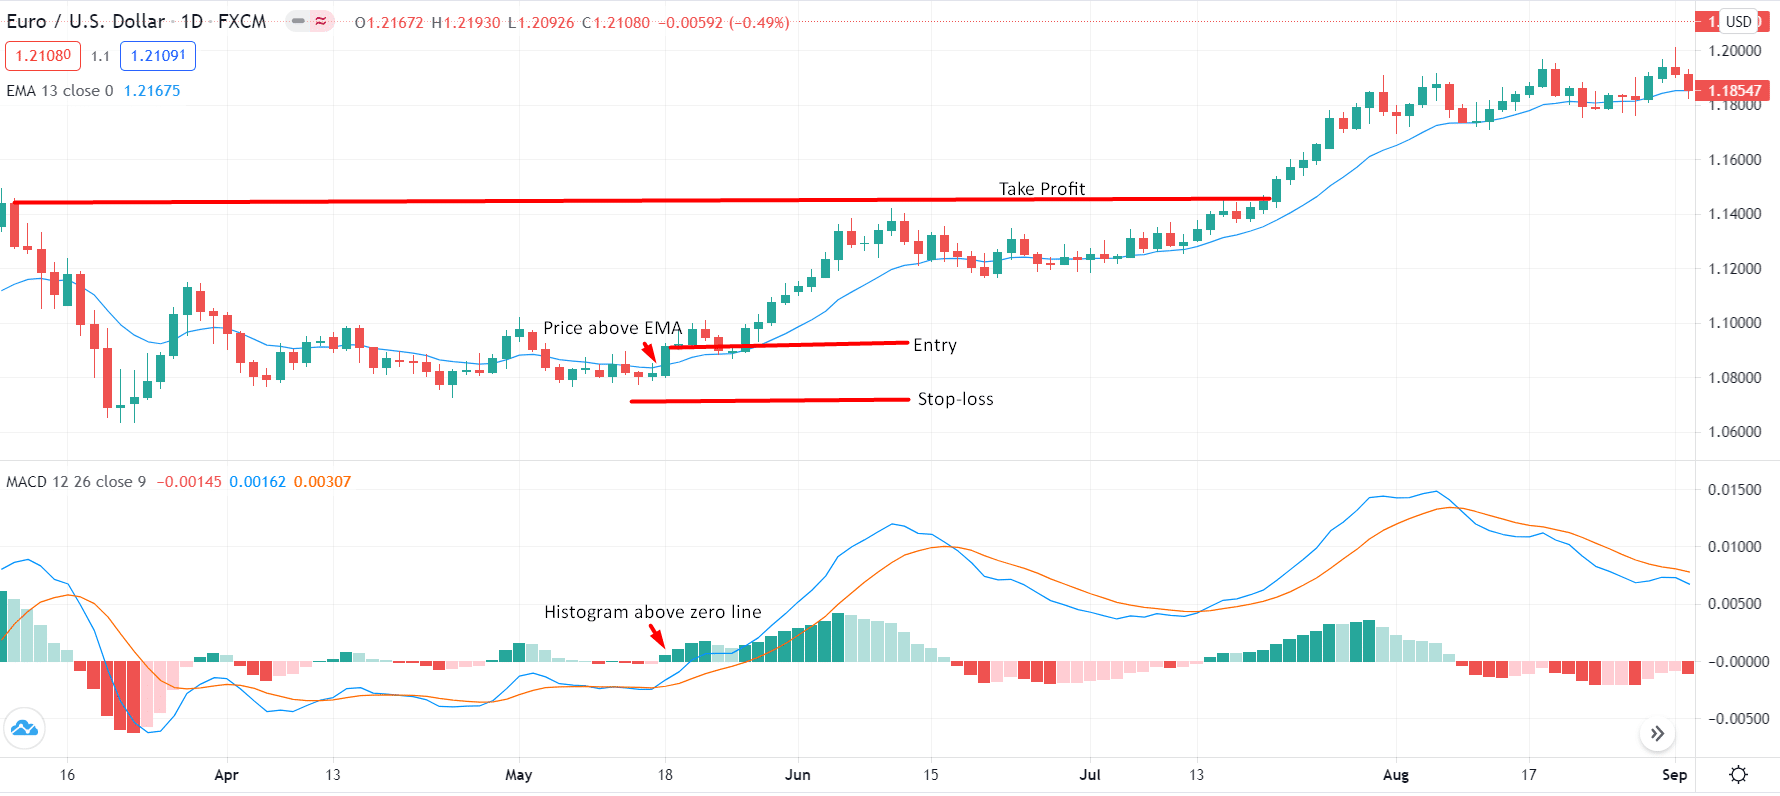
MACD centerline strategy
- Wait for the histogram bars to go beyond the zero line.
- Add a 13-period moving average on the price chart for confirmation. If the price closes above the 13-period moving average, go for a long entry.
- Place the stop-loss below the local low.
- Place the take profit near the previous swing highs/lows.
- Alternatively, you can hold the position until the green bars start shrinking.
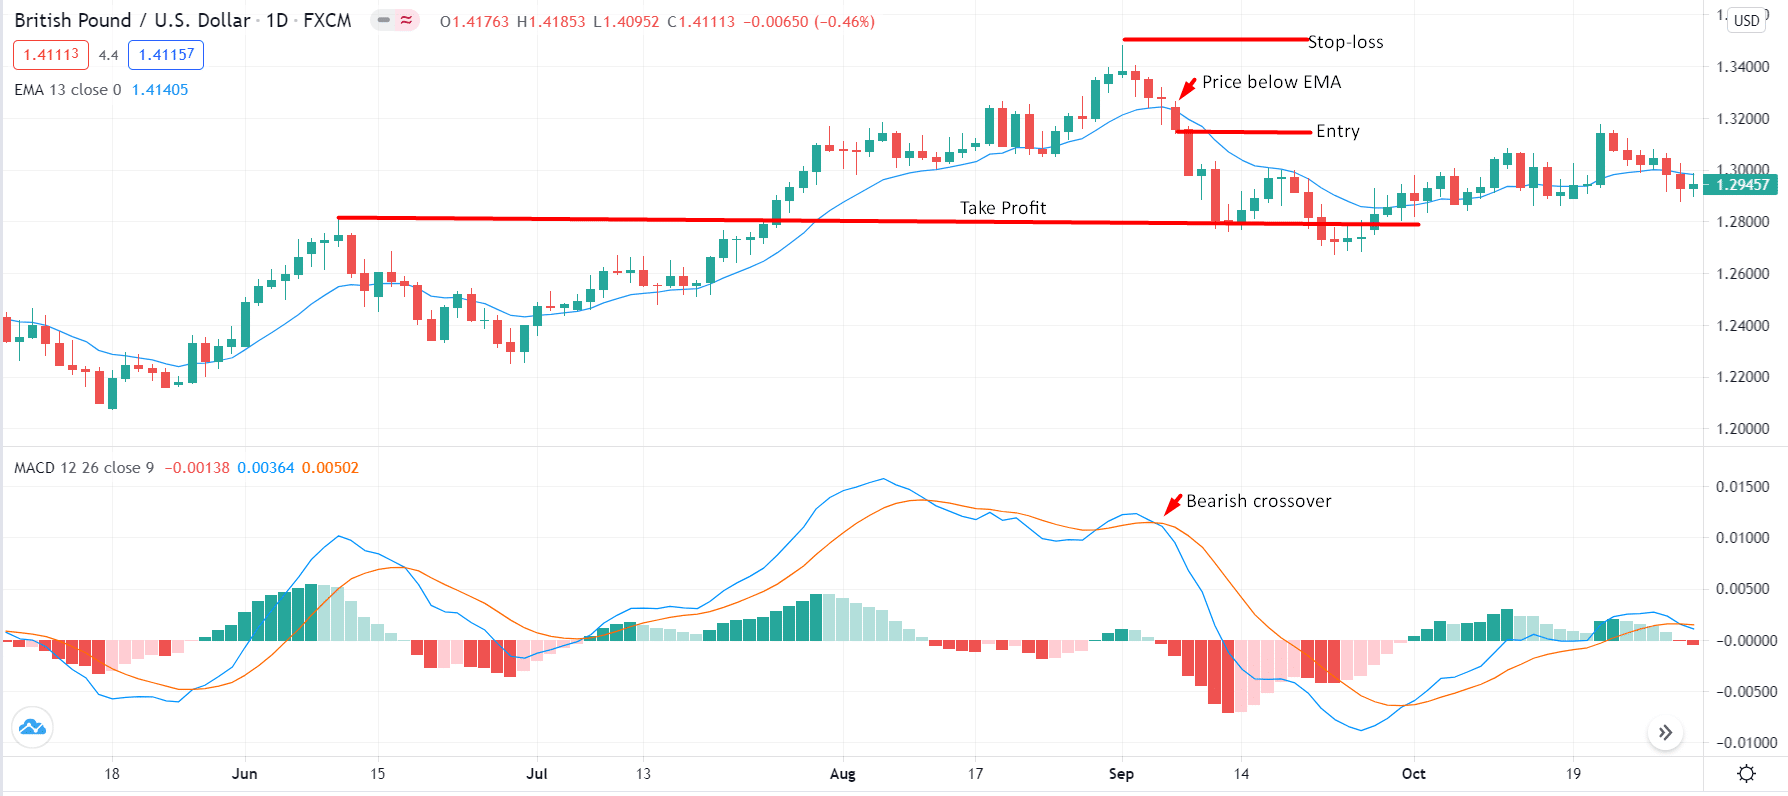
MACD crossover strategy
- Look for a crossover of the signal line and ML on top of the indicator window.
- Confirm bearish signal if price closes below the 13-period moving average.
- Place the stop-loss around local highs.
- Place the take profit near previous swing lows/highs or exit when you find a bullish crossover.
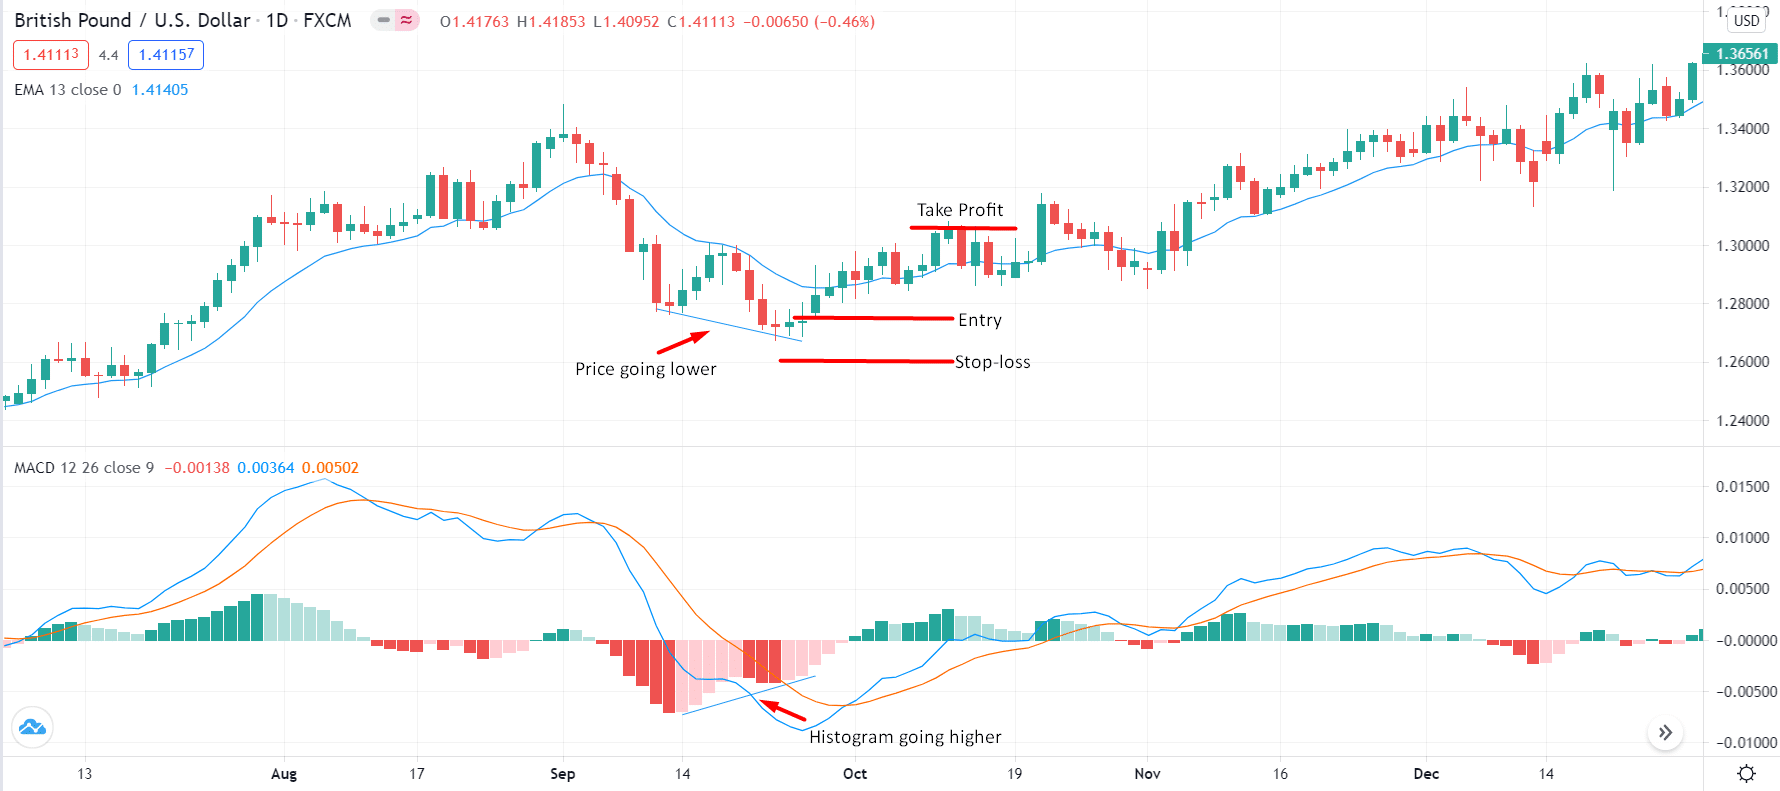
MACD divergence strategy
- Look for disagreement between price and the indicator.
- If the price posts lower lows while the histogram posts highs, it shows divergence, and we open a position in the direction of the histogram, i.e., long entry.
- Place the stop-loss slightly lower than the recent swing low.
- Keep taking profit 1.5 times the stop-loss.
Limitations of MACD
Like any other tool, this indicator is also lagging. It may signal a reversal when the price has already moved in the direction of the bias. You may also find several fake signals, especially in crossovers. Hence, it would help if you always had a confirmatory tool to filter out the fake setups.
If the market is in a consolidation phase, you will notice a series of tiny histogram bars on both sides of the zero line. In that case, you may not have enough grounds to enter long or short. Hence, you may need to rely on price action patterns.