
Forex indicators are mathematical tools that graphically reflect market signals and allow a trader to analyze a currency pair’s price movement and, therefore, predict the rate movement’s strength and direction. They can be very effective when plotted correctly.
Types of indicators
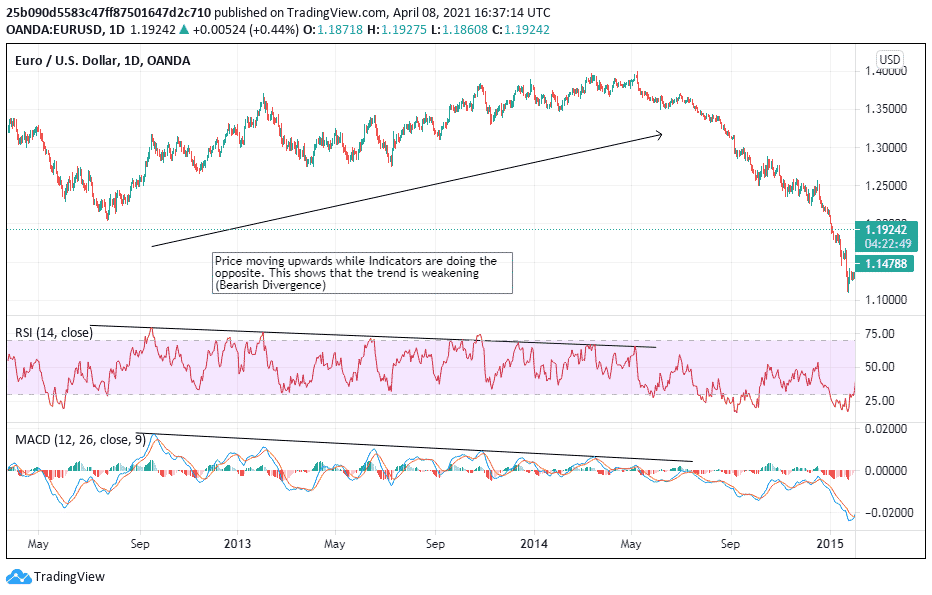
Technical indicators gauge the internal strength of a market or script. By looking at these indicators’ data, technical analysts determine whether trend or price action’s inner strength is improving or weakening. When price moves in harmony with arrows, it is regarded as a strong move.
All trading indicators can be categorized:
- Trend indicators
They measure the strength of a trend’s potential future price movement and help ride trends smoothly. Trend indicators include moving averages, Bollinger bands, parabolic SAR, etc.
- Oscillating indicators
Oscillators include relative strength index (RSI), moving average convergence divergence (MACD), stochastic oscillator, etc.
- Psychological indicators
Consensus indicators and adherence indicators are two types of psychological forex indicators that can distinguish.
There is no such thing as a good or bad trading indicator, all types of indicators have advantages for traders. The most important thing is to form a combination that suits your style.
Let’s have a look at some valuable indicators.
MACD: trend-following momentum indicator
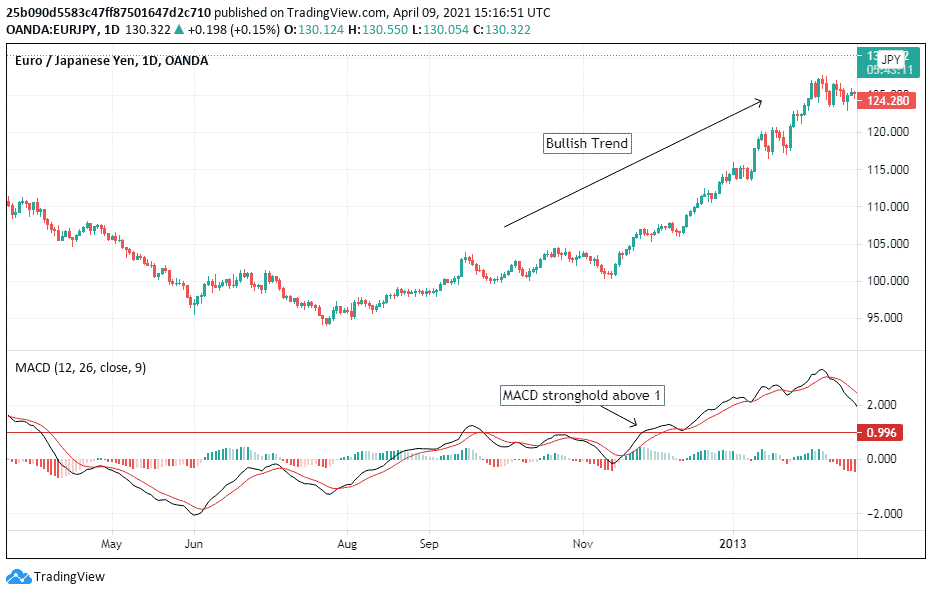
Trends define directions in prices. To identify such patterns, we use price indicators as trend confirmation tools. Moving average convergence divergence (MACD) is one of the confirmation tools. When MACD lines are above 1 for a sustained period, it shows bullish trend confirmations, and while when it holds below — 1, it is considered a bearish trend.
These readings are used as confirmations for a trend. The technical analysis considers this as a highly reliable indicator.
An example: long
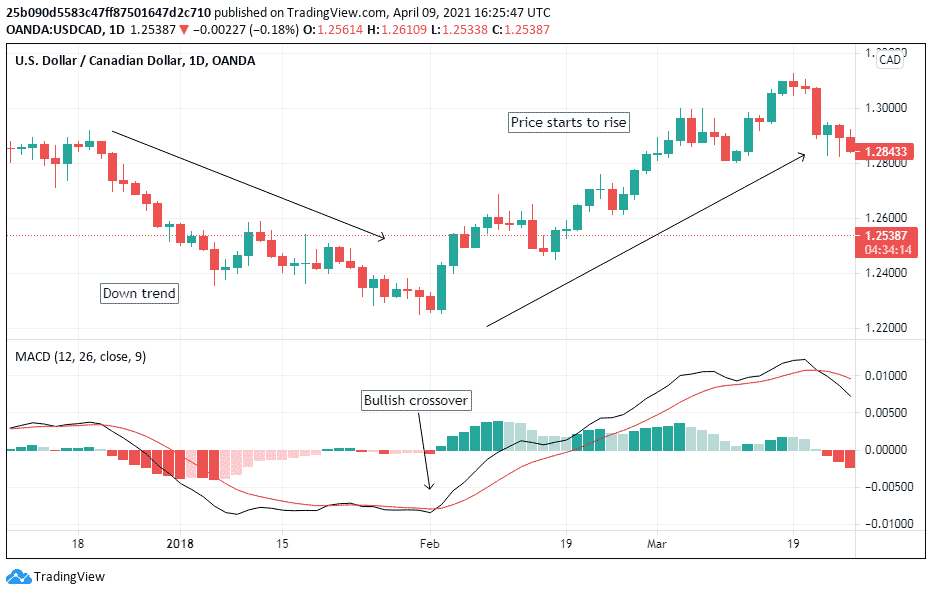
As shown in the chart below, when the fast black line crosses over the slow line, a buy signal is generated, further confirmed once the MACD ranges and strongholds above 1.
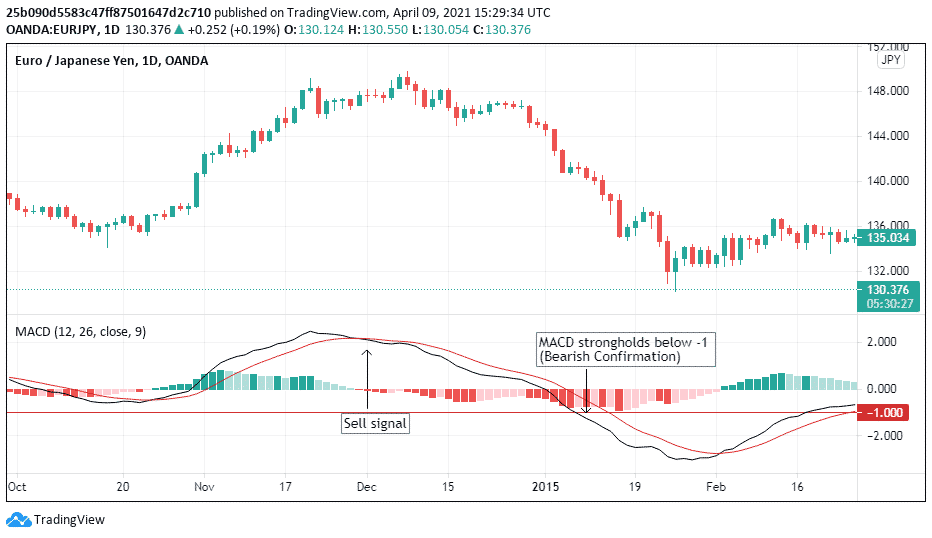
An example: short
This script’s momentum started to get weaker after posting a high, indicated by the momentum indicator beforehand. Initially, a sell signal was generated, which got confirmed when MACD started to range below 1.
Pros
⦁ Guides traders with market directions
⦁ Trends are strong once confirmed
Cons
⦁ It’s a lagging indicator if you wait for confirmations
⦁ Lacks the ability to identify the trend tops and bottoms
Benefits
⦁ Confirmation system-based trading
⦁ Identifying trends to play
⦁ Easy to read
Moving averages: trend-following tool
Identifying a trend and trading a trend can be two different things. To ride such trends, we use trend-following tools to smoothen out the price data. The moving average is one of the most widely used trend-following tools.
Moving averages smooth out price trends by filtering out the “noise” from random short-term price fluctuations. They are most often used to describe trend direction and assess support and resistance levels.
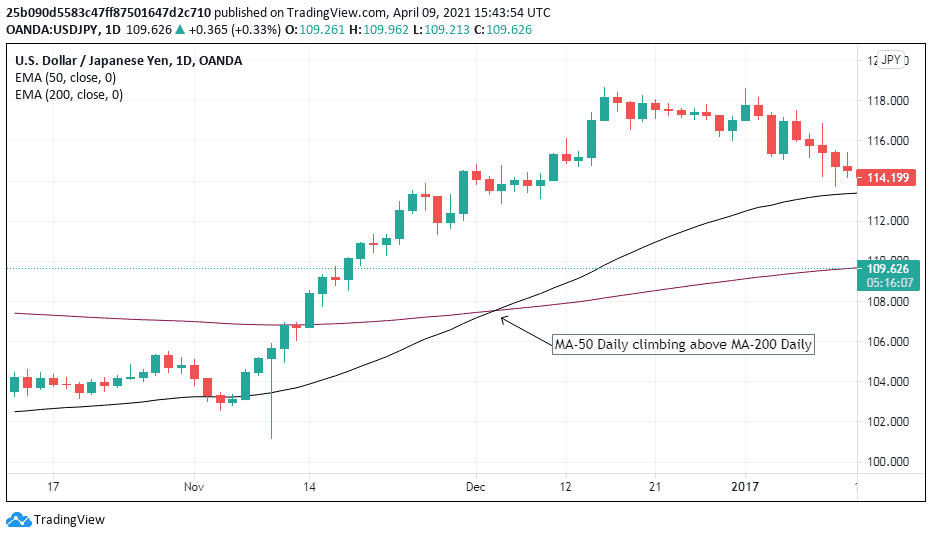
An example: long
Following the classic theories, when a short-term moving average (50-day) crossovers a long-term moving average (200-day), the trend changes. Once this event takes place, technical analysts view it as a golden cross that is highly bullish.
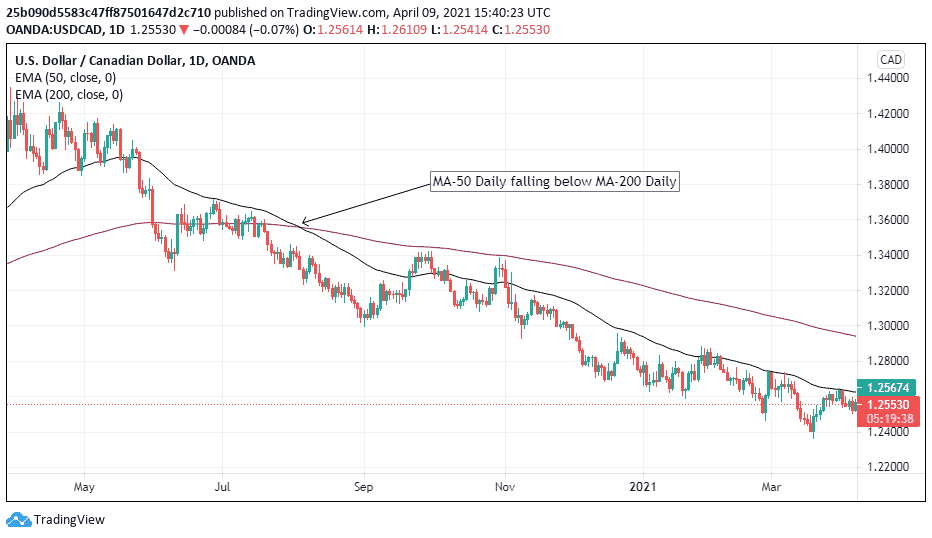
An example: short
If the moving average is pointing downwards, it means the trend is dropping, and when a 50-day moving average crosses below the 200-day moving average, it’s a death-cross formation, and it confirms a long-term bearish spell.
Pros
⦁ Smooths the chart and reduces fakeouts
⦁ Identifies entry/exit levels inside a trend
⦁ Lower MA’s allow day trading options
Cons
⦁ The classic theory is slow in the confirmation
⦁ Moving averages are useless in ranging markets
⦁ Lagging indicator in nature
Benefits
⦁ The prime source of trailing stop-losses
⦁ Identifies range-bound markets
⦁ An effective tool for long term investors
Stochastic oscillator: an overbought/oversold tool
Overbought/oversold condition occurs when a security trades above its intrinsic value over a short period. When a script is overbought, it means that the buyers have raised the price too far, and a price pull-back is expected as a result. Similarly, when a script is oversold, it means that the selling pressure has driven the prices too low. As a result, bounce is anticipated.
To measure this sharp change in prices, we use the stochastic oscillator. Oscillators range between 0-100. An oscillator is termed bullish when it ranges between 30-100 and bearish when it ranges between 0-70.
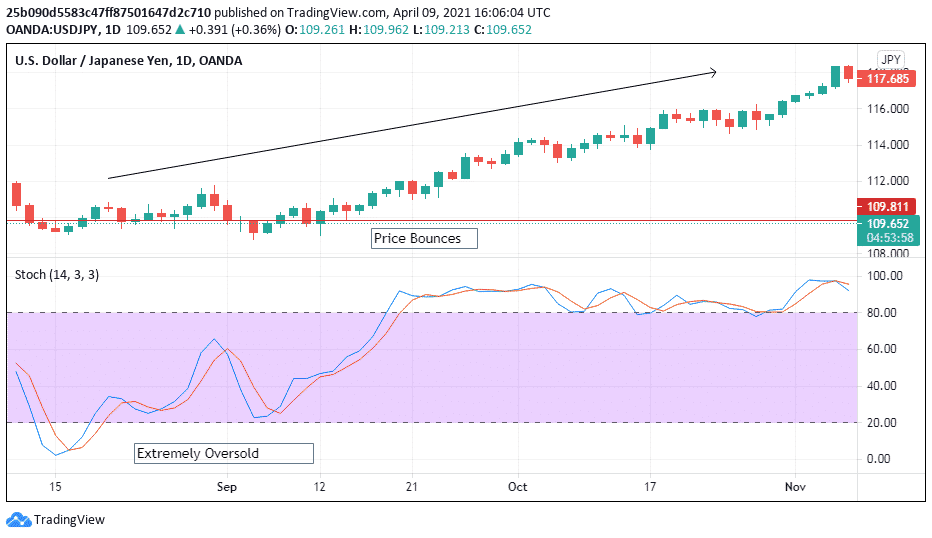
An example: long
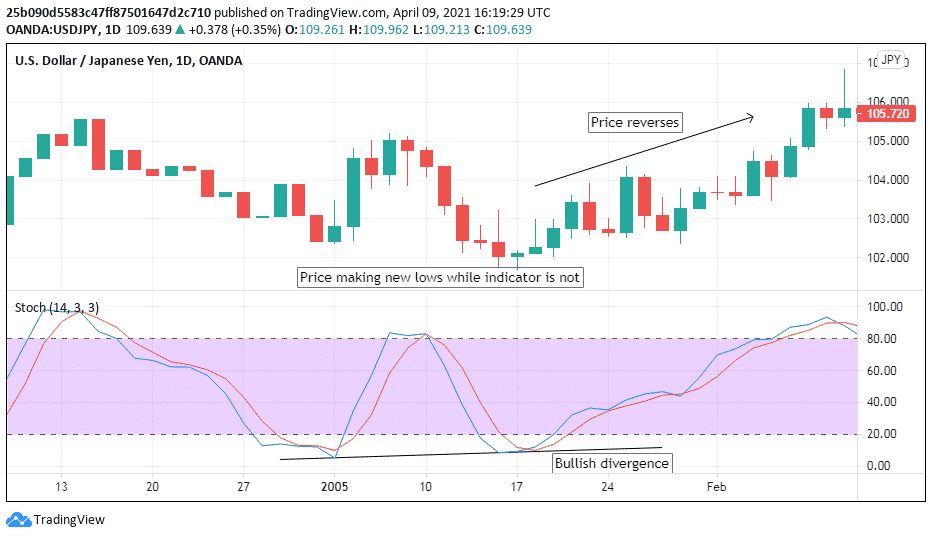
Stochastic falling below 20 on the scale means that it is now entering the oversold region. As a result, a pull-back on the upside is expected.
Oscillators give another essential piece of information called positive or negative divergence. When the price makes new lows but the indicator doesn’t, it’s termed bullish divergence, which is a trend reversal signal.
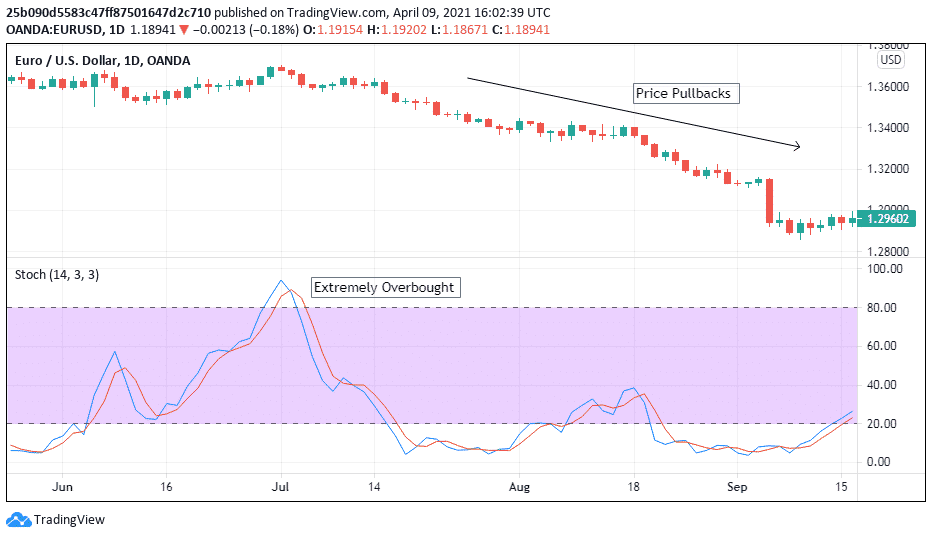
An example: short
Traders treat extreme ends of oversold or overbought as entry/exit zones. When the stochastic oscillators’ range moves above 80 on a scale, it is considered a highly overbought region, and as a result, a price-fall is expected. These movements are termed as “slingshot effect.”
Pros
⦁ Oscillators can come the closest to identifying top and bottoms
⦁ Entry and exit on extreme ends
Cons
⦁ It can stay at excessive levels for very long
⦁ It can generate false signals
Benefits
⦁ Early signs of potential threat/reversals
⦁ Divergence can be used as accumulation and distribution phases
MACD crossover: trend confirmation strategy
MACD is an indicator that shows us the relationship between two moving averages and whether a move is gaining strength or weakness. Use MACD to trade more significant swings by using it on higher time frames.
The orthodox way of using MACD is to trade crossovers. Go long when MACD crosses its signal line below and go short when MACD crosses its signal line.
An example: long
After a downtrend, the MACD line (black) crosses the signal line from below, signaling a purchase.
An example: short
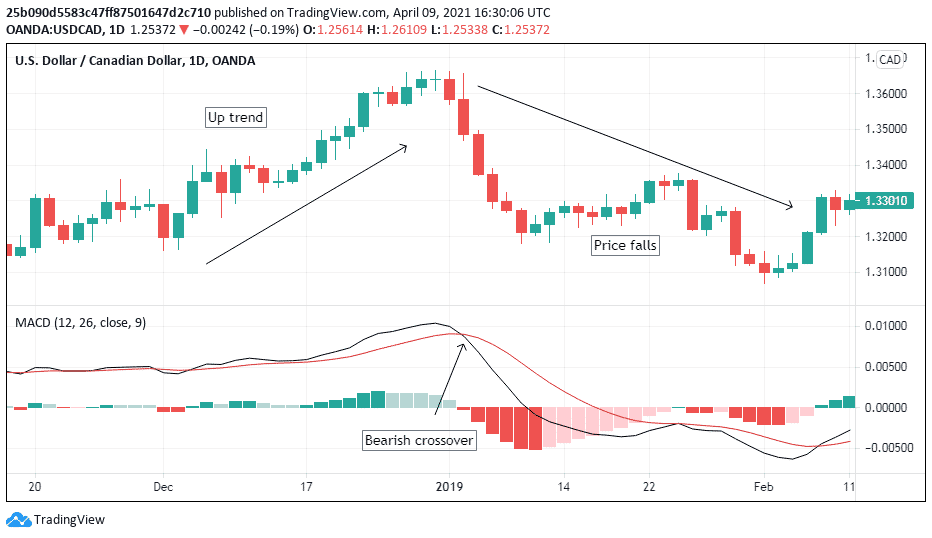
The MACD line (black) crosses the signal line from above after an uptrend, signaling a sell signal.
Pros
⦁ Give confirmation signals
⦁ Shows strength in momentum
⦁ Divergence is seen for reversals
Cons
⦁ It’s a lagging indicator
⦁ It is useless in range-bound markets
⦁ It does not give information about tops and bottoms
Benefits
⦁ Easy to use
⦁ Used as a confirmation tool
⦁ Divergence/convergence can be used as accumulation and distribution phases
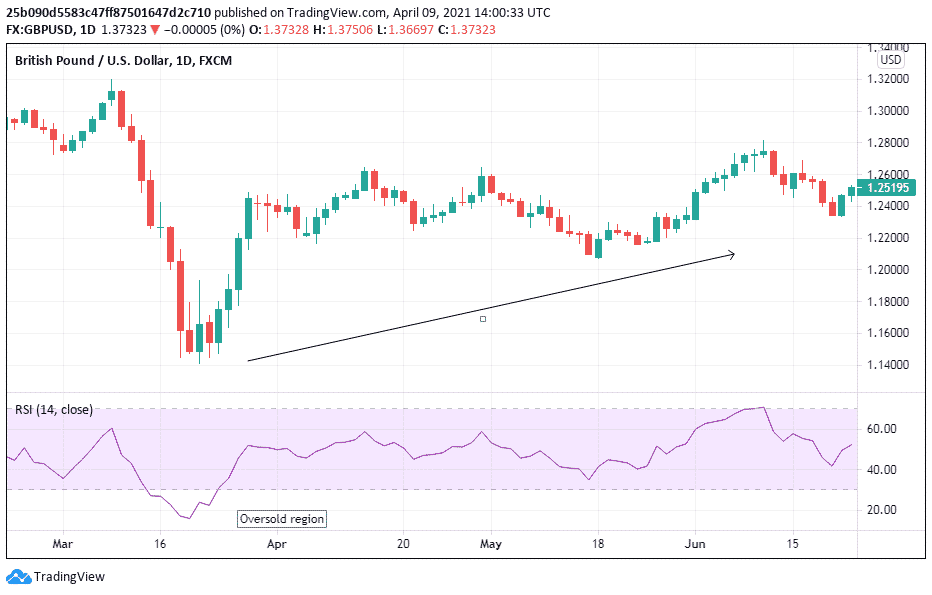
Relative strength index: identify the power of price action
It is the most widely used indicator and technical analysts’ one of all-time favorites. RSI is plotted on a separate scale and ranges between 0-100. A figure over 70 indicates overbought, and below 30 indicates oversold. RSI shows whether the move is sustainable or not.
When an RSI is ranging between 30-100 in a trend, that trend is bullish. When the RSI inside a trend is between 0 and 70, the trend is bearish.
An example: long
GBP/USD entered an extremely oversold region which generated a buy signal.
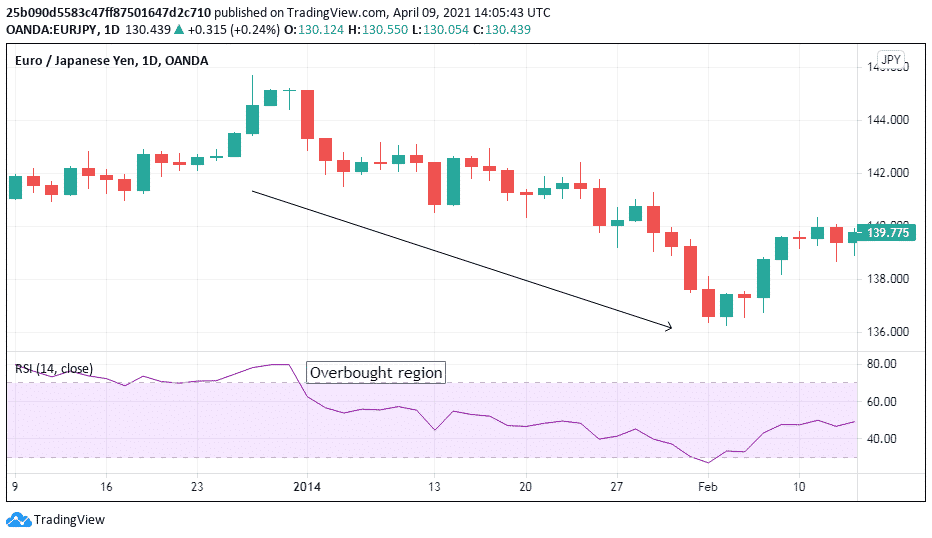
An example: short
EUR/JPY entered an extremely overbought region which generated sell signals.
Pros
⦁ Shows the strength of the move
⦁ Indicates which force is more potent on charts, bulls or bears
⦁ Divergence is seen for reversals
Cons
⦁ It’s a lagging indicator
⦁ The majority of price action is between 30-70
Benefits
⦁ Easy to use
⦁ Used as entry and exit tool
⦁ Allows catching tops and bottoms
Conclusion
Technical indicators are tools that assist us in performing technical analysis. They increase the odds that a technical price signal is correct and serve as tools of confirmations. These tools are trader-friendly and can be used in any time frame.