
The commodity channel index is also known as CCI. Though its name mentions commodities, traders can use it on other types of assets. A momentum-based technical indicator allows the market participants to measure when an asset is being overbought/oversold. It is also helpful to evaluate the strength and direction of the price trend.
However, the information it gives is handy for traders in decision-making about various situations. For example, when market participants should enter or exit the trades or add an exit point, when to take the trade, when to avoid, etc. In short, if the commodity channel index performs in a certain way, it can give trade signals.
The following section will see the complete commodity channel trading guide. After completing the whole unit, you can claim yourself as a pro to use the indicator in your strategy.
What is the CCI?
As mentioned earlier, traders utilized the indicator to calculate the direction and strength of a trend. It also helps to define the potential buy and sell signals. However, this tool determines the current price difference compared to the average historical price over a certain period.
Moreover, if the price surpasses its average price, the index is comparably high, indicating strength. Besides, the index is low when the price dips below the average price, which is a weakness. It is the technique that most traders use to define the overbought and oversold levels.
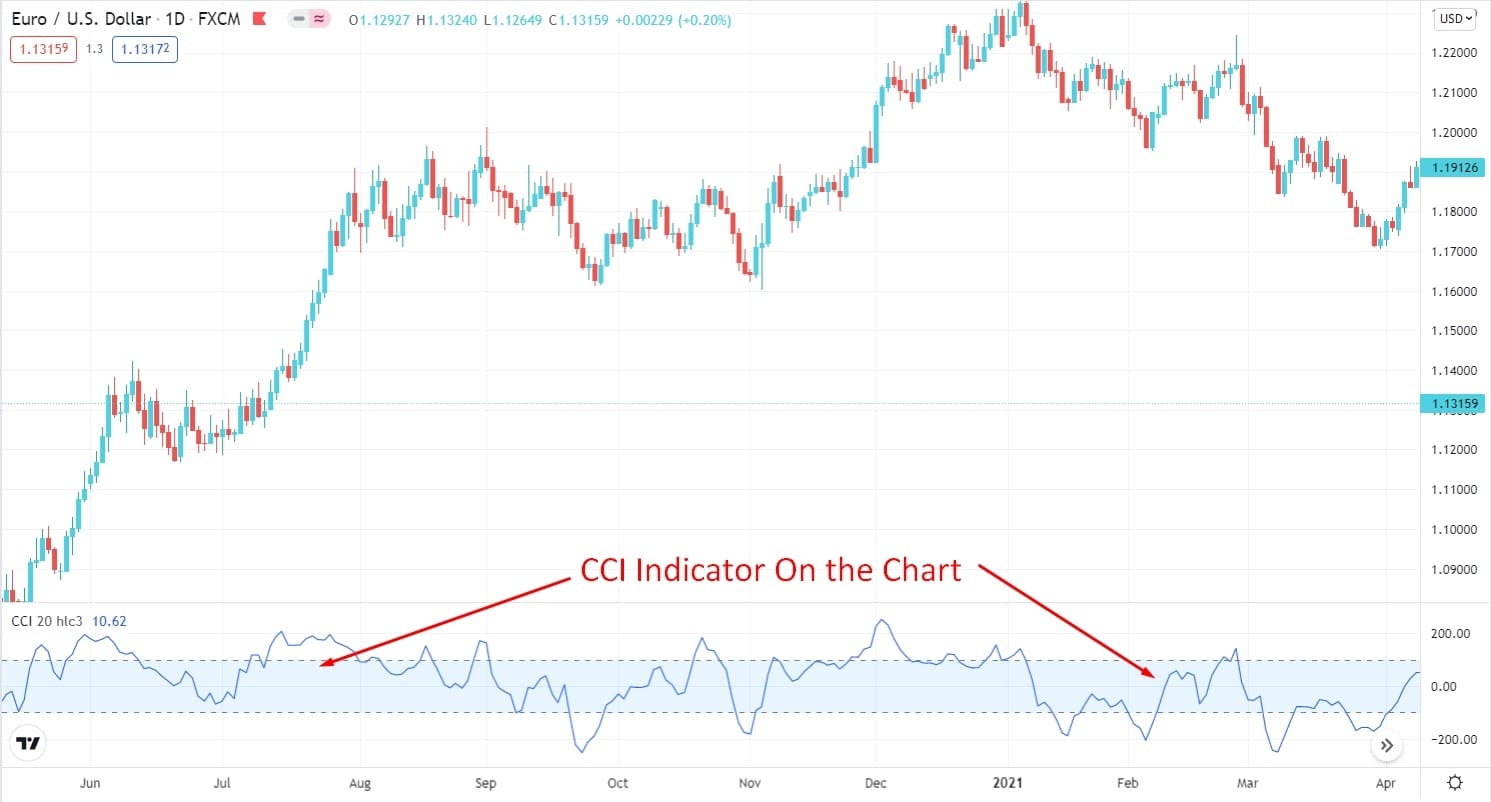
How to identify the CCI?
This index is located below the price chart; a line is swinging in the box. A default range of 100 to -100 is given, yet some of the trading platforms can customize the range. Although default traders give CCI setup of 20 periods can customize that according to their trading preferences.
However, it should be noted that the shorter the CCI period, the more volatile it will be. Also, the maximum portion will be top or below the 100 and -100 values. On the contrary, a more extended period of CCI implies the lower percentage will be away from the range of 100 to -100.
CCI value of more than 100 depicts an emerging uptrend potential, whereas the value shown under the range of -100 indicates the emergence of a downtrend.
A short-term trading strategy
It is a very profitable trading method, which many professional market participants use. The problem that many traders face is identifying the market’s exact trend. That’s why we will add 200 EMA indicators on the chart to determine the market momentum. A trader may use this 200 EMA on any chart with the motive of identifying if the price is over or beneath the EMA. Moreover, this short-term trading is straightforward to understand.
- First, identify the price, whether it’s above or below the 200 EMA.
- If the price is over the 200 EMA, look for a buy when the CCI line signals momentum is reversing back in the direction of the bias below an oversold level -100.
- On the contrary, if the price is below the 200 EMA, look for a sell entry when the CCI line signals momentum is reversing back in the direction of the trend above an overbought level 100.
Bullish trade scenario
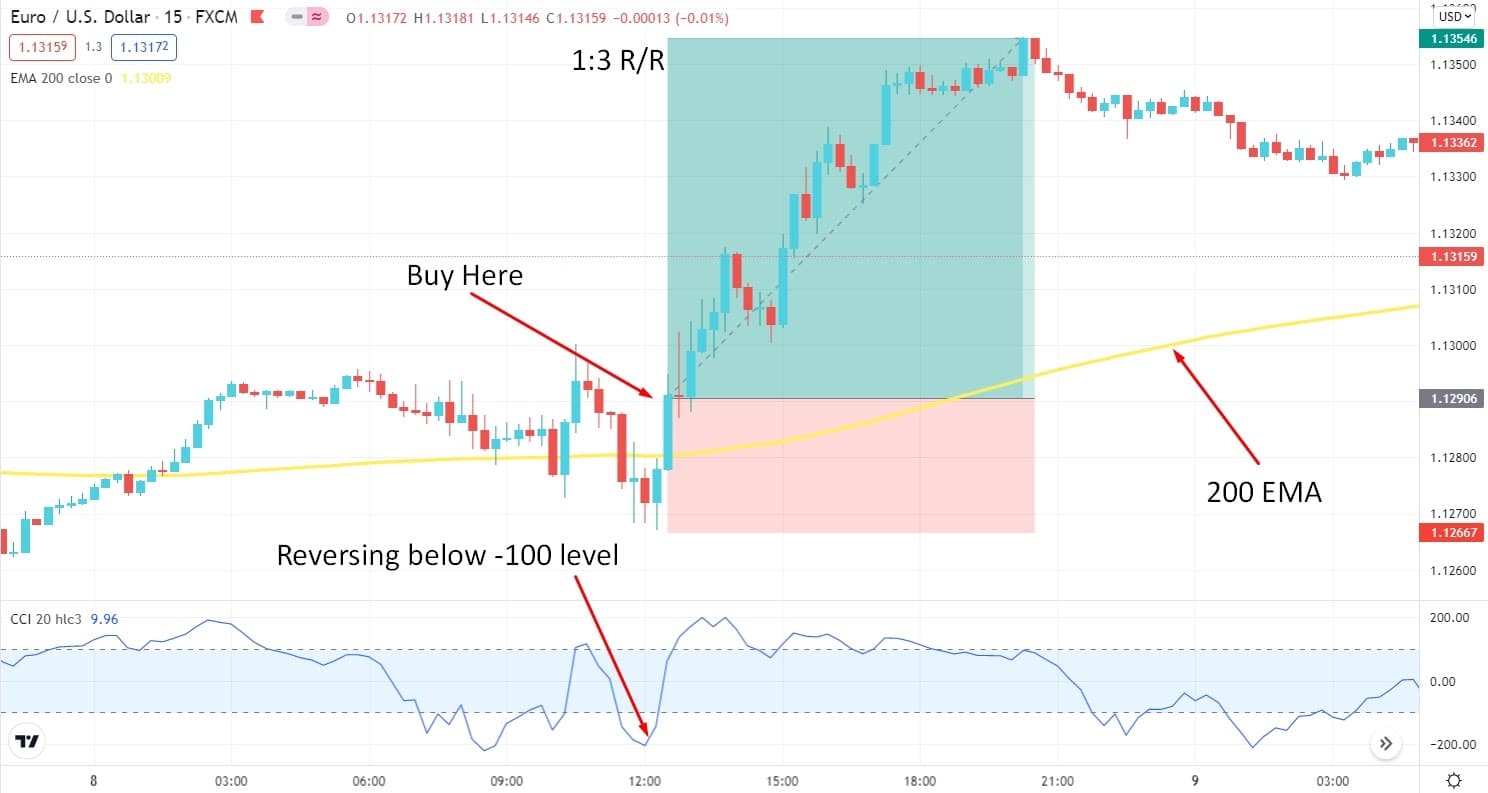
Entry
Enter a buy trade when the price exceeds 200 EMA, and the CCI line reverses back, below the oversold level -100.
Stop loss
Place an SL order below the last swing level with a 4-5 pips buffer.
Take profit
Take the profit by calculating at least a 1:3 risk/reward ratio. Otherwise, you can ride the trend until the next resistance level arrives.
Bearish trade scenario
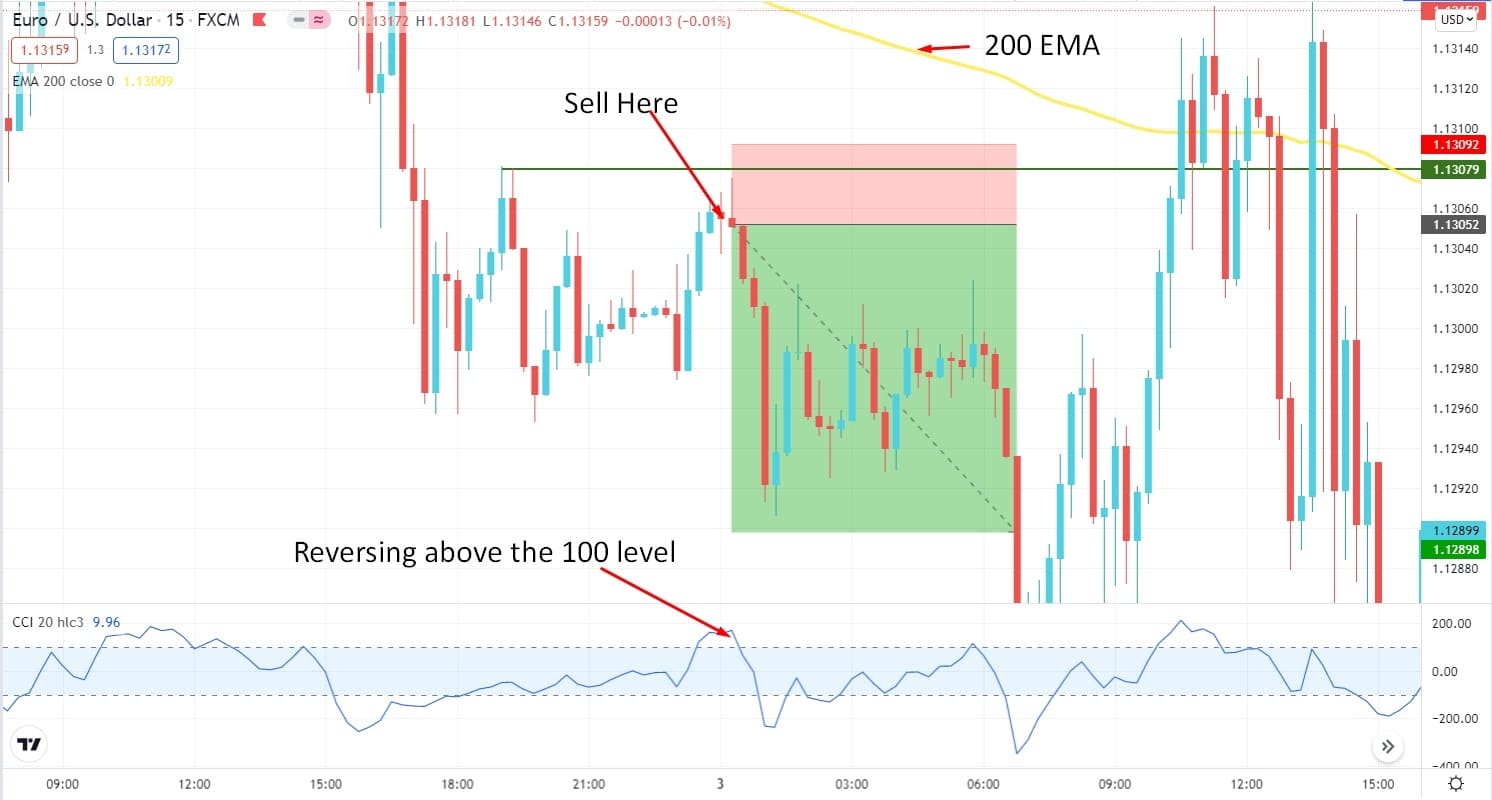
Entry
Enter a sell trade when the price is below the 200 EMA, and the CCI line reverses back above the overbought level 100.
Stop loss
Place an SL order above the last swing level with a 4 – 5 pips buffer.
Take profit
Take the profit by calculating at least a 1:3 risk/reward ratio. Otherwise, you can ride the trend until the next support level arrives.
A long-term trading strategy
This trading strategy has been built based on the support and resistance level. However, it is based on a simple trading method, sell on the resistance and buy on the support where the indicator adds more confirmation on entry. This method is straightforward to understand, and it can also provide a good amount of profits.
Bullish trade scenario
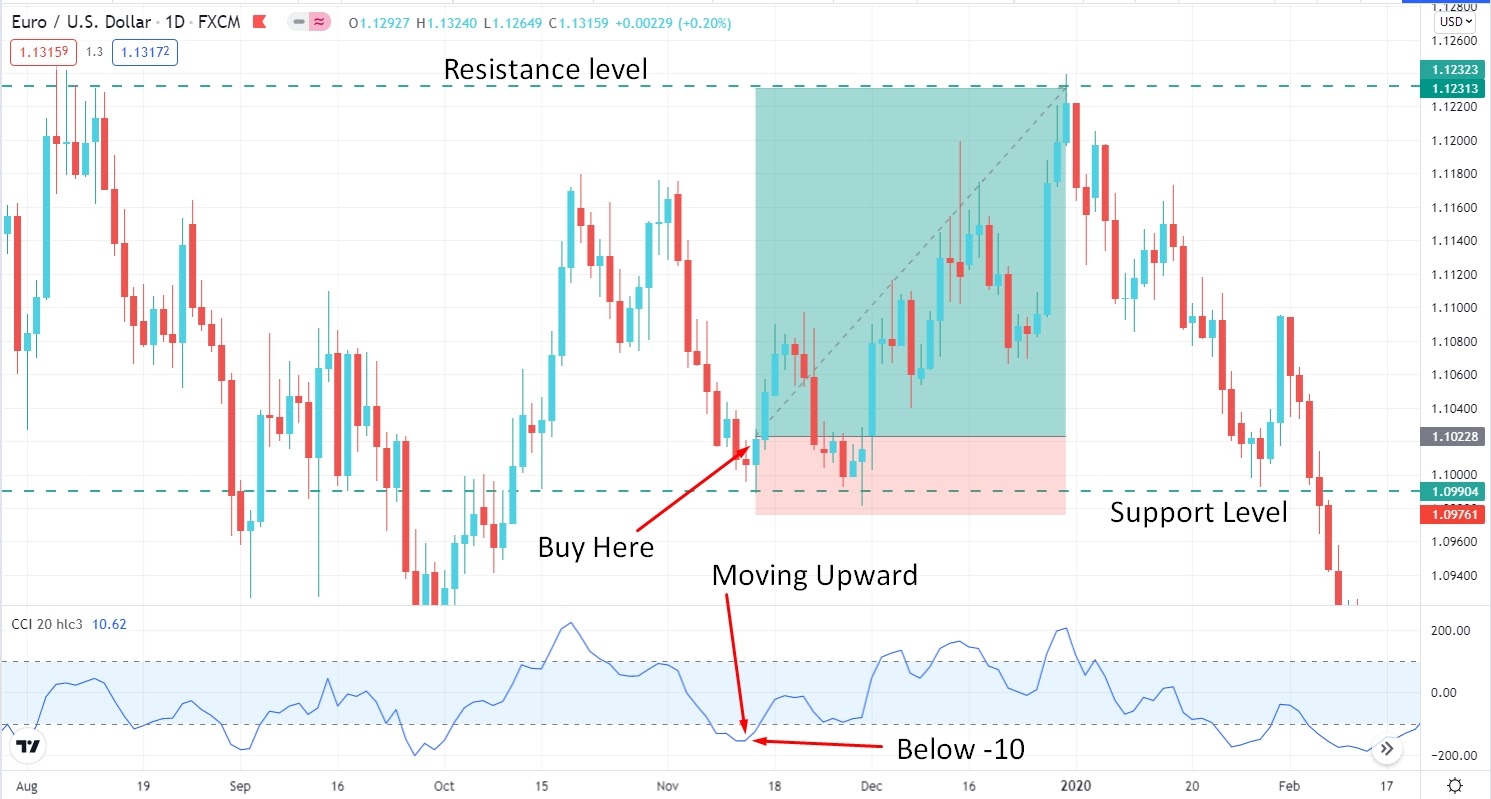
Entry
It is worth opening the position for buying when the price had a daily close after bouncing from the support level. Besides, the CCI line is reversing back upside below the -100 level.
Stop loss
An SL order should be placed below the support level with a 10-15 pips buffer.
Take profit
Take the profit when the price hits the resistance level. Or else, you can set tp by calculating a 1:3 risk/reward ratio.
Bearish trade scenario
Entry
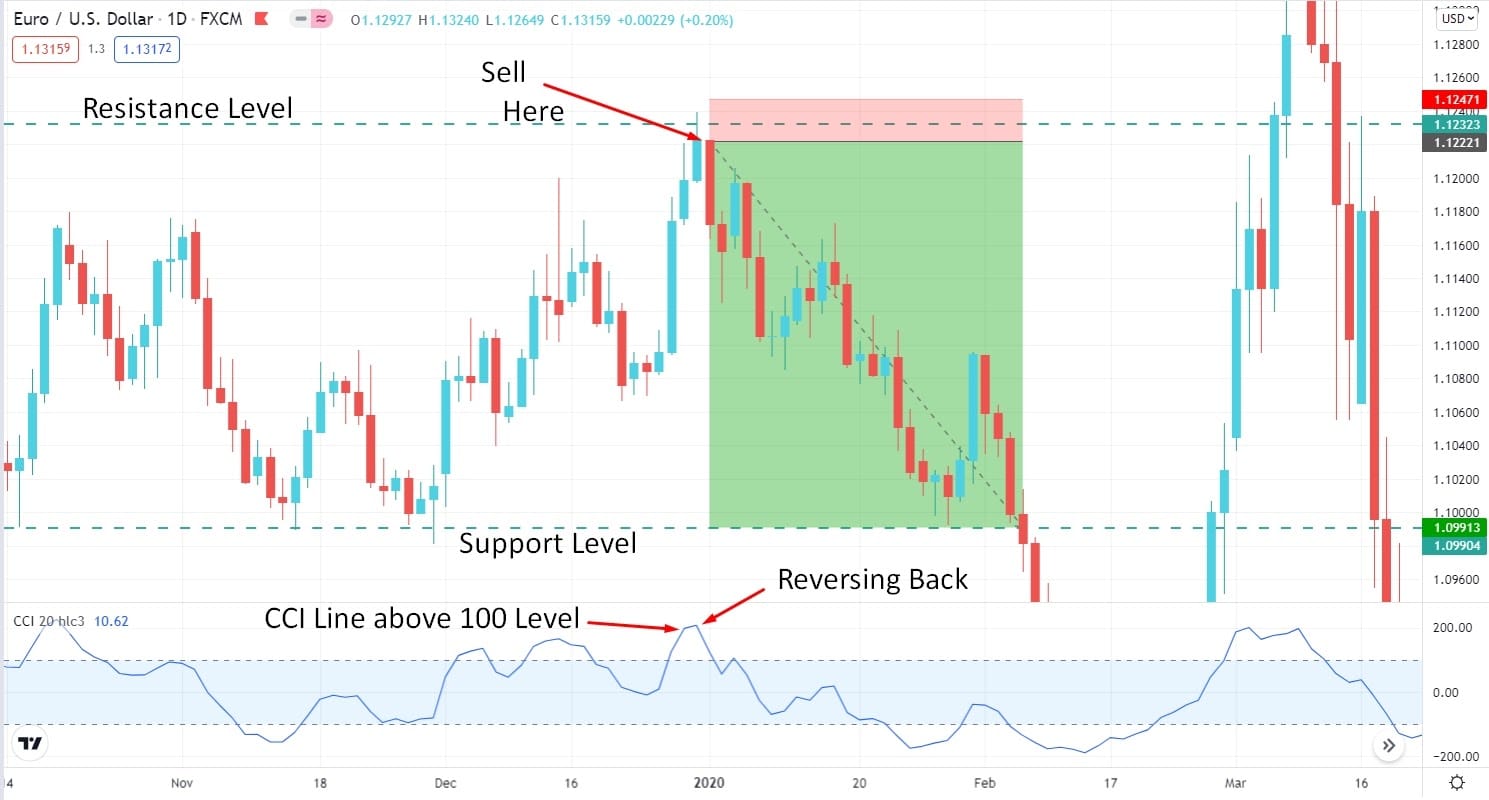
Sell when the price had a daily close after rejecting the resistance level. Besides, the CCI line is reversing back down above 100 level.
Stop loss
An SL order should be placed above the resistance level with a 10-15 pips buffer.
Take profit
Take the profit when the price hits the support level. Or else, you can set tp by calculating a 1:3 risk/reward ratio.
Pros and cons
| Pros | Cons |
| The index gives the potential signals for buying and selling. | Single-handed signals from the commodity channel index are not reliable. |
| It is a convenient index to confirm a new trend of reversal structure. | Complexity in calculating an SL levels. |
| It can give an accurate and deep understanding of the price momentum. | Overbought/oversold levels can be highly biased using the commodity channel index. |
Final thoughts
In a nutshell, CCI is a robust and unique indicator you can utilize combined with other technical tools. Hence, knowing the indicator can be ideal for market participants. Moreover, while using the tool, it is vital to heed risk management and other fundamental factors that dominate the price.