
It is common in the financial market that one asset is correlated to another. No wonder crypto-assets also show the same based on many relative factors such as blockchain, services, use cases, utilities, acceptance, etc. The correlation coefficient indicator is a unique technical tool to obtain this relationship between two different assets.
However, it is mandatory to know several factors to obtain the best results through an indicator such as why to use, how to use, basic calculation, elements, etc., data. This article reveals the Correlation Coefficient indicator and describes successful trading strategies using the concept with chart attachments.
What is the Correlation Coefficient indicator?
It is a technical indicator that displays a dynamic relationship between two entities or financial instruments. Not just cryptocurrencies, financial investors use this concept widely while making trade decisions by observing relative asset classes through this concept. For example, gold positively correlates with the Australian dollar, so the AUD/USD pair goes up when the gold price rises.
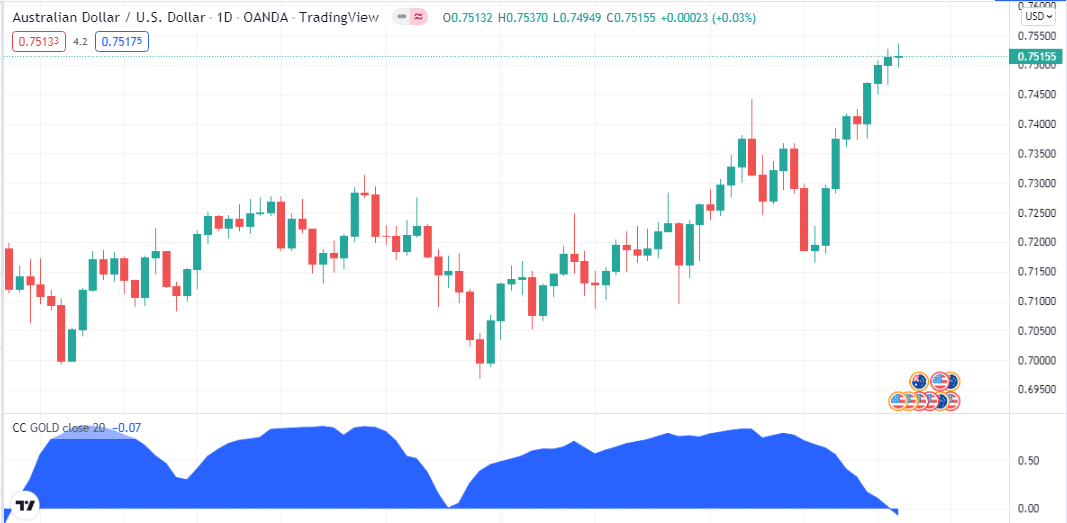
This indicator shows results in an independent window between 1 to -1 and a mid-level of 0. When the reading reaches above the “0” level, it declares a positive correlation between those assets, so when asset A will surges upside, asset B will reflect positively.
Meanwhile, the reading of the CC indicator drops below 0, declaring a negative correlation so the price movements will reflect each other conversely. For example, when assets A and B are negatively correlated, the price of asset B will drop during the uptrend on asset A. Additionally, when the reading is 0, it declares no correlation between those assets.
How to trade cryptos using the Correlation Coefficient indicator?
Crypto investors usually use this indicator to diversify their investments. For example, suppose crypto A and crypto B are positively correlated, and a crypto investor can buy both rather than invest in the same asset.
Crypto investors usually match data and enter trades according to their trading strategies. Meanwhile, if assets A and B are negatively correlated, investors may open buy positions in asset B while the price of asset A declines. The setting is easy; first, open your target asset chart, select the CC indicator, and set the asset you want to check correlation data.
Short-term trading strategy
We use the CC indicator to check the relationship between two cryptocurrencies in this trading method. It shows a positive correlation as per the example chart below. For example, we use the Ethereum and the Bitcoin correlation. Asset A is Ethereum or target asset, and asset B is Bitcoin in this case.
We use the volume and the parabolic SAR indicator to determine entry/exit positions. This trading method suits many time frame charts; we recommend using an hourly or a 15-min chart to catch the best short-term trades.
Bullish trade scenario
That asset A is positively correlated with asset B in this case. So check that asset B is rising, then seek opening buy trades in asset A when:
- The parabolic SAR dots start appearing below price candles.
- The volume indicator declares an increasing buy volume.
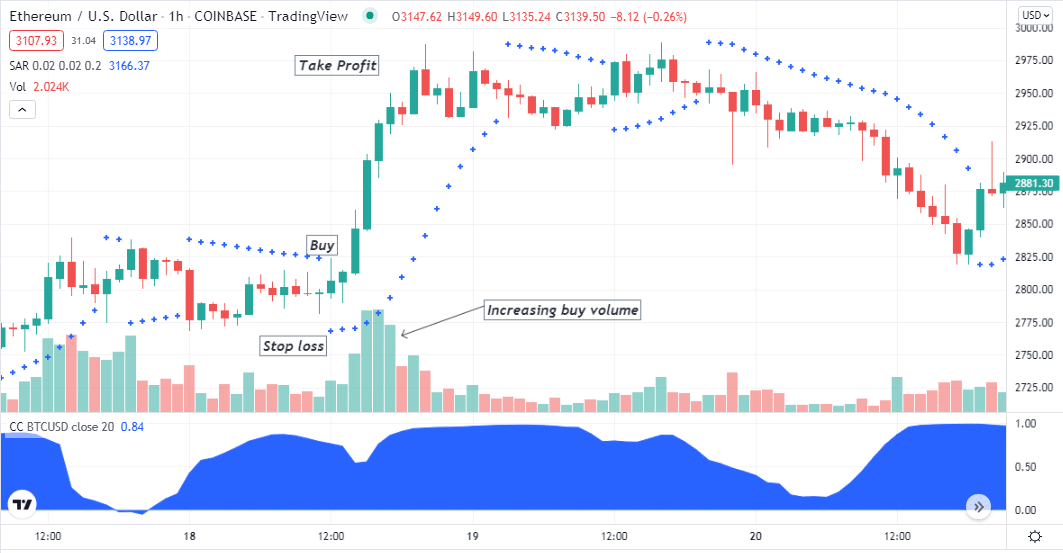
Entry
Match these conditions above and open a buy position.
Stop loss
Place an initial stop loss below the recent swing low with a buffer of 5-10pips.
Take profit
Continue the buy order till the uptrend fades. Close the buy order when:
- The parabolic SAR dots flip on the upside.
- The volume indicator declares an increasing sell volume.
Bearish trade scenario
That asset A is positively correlated with asset B in this case. So check that asset B is declining, then seek opening trades in asset A when:
- The parabolic SAR dots start appearing above price candles.
- The volume indicator declares an increasing sell volume.

Entry
Match these conditions above and open a sell position.
Stop loss
Place an initial stop loss above the recent swing high with a buffer of 5-10pips.
Take profit
Continue the sell order till the downtrend fades. Close the sell order when:
- The parabolic SAR dots flip on the downside.
- The volume indicator declares an increasing buy volume.
Long-term trading strategy
We use the CC indicator to determine the correlation impact between two assets in this trading method. When both are positively correlated, this method suggests opening a buy order when the price of asset B rises and vice versa when the asset price declines.
Meanwhile, open sell orders at asset A when the price of asset B declines while both assets are negatively correlated and vice versa. This trading method suits many trading instruments, and we use the golden crossover and death crossover. Crossover between EMA 50 (green) and EMA 200 (blue) lines. We recommend using a D1 chart to catch the best long-term trades through this trading method.
Bullish trade scenario
Check the EMA lines:
- Green EMA crosses the blue EMA on the upside (golden crossover).
- Both EMA lines start heading toward the upside.
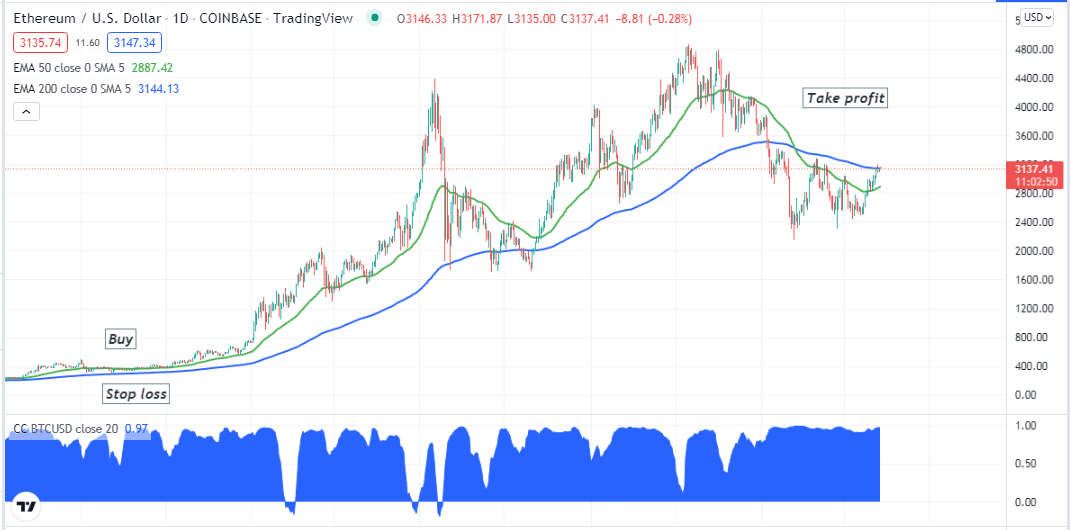
Entry
Match correlation coefficient indicator data with crypto charts and open a buy position.
Stop loss
Place an initial stop loss below the current bullish momentum.
Take profit
You can continue your buy trade till the price continues to rise. Close the buy order when the bullish momentum fades, or the Green EMA line drops below the blue EMA.
Bearish trade scenario
Check the EMA lines:
- Green EMA crosses the blue EMA on the downside (death crossover).
- Both EMA lines start heading toward the downside.
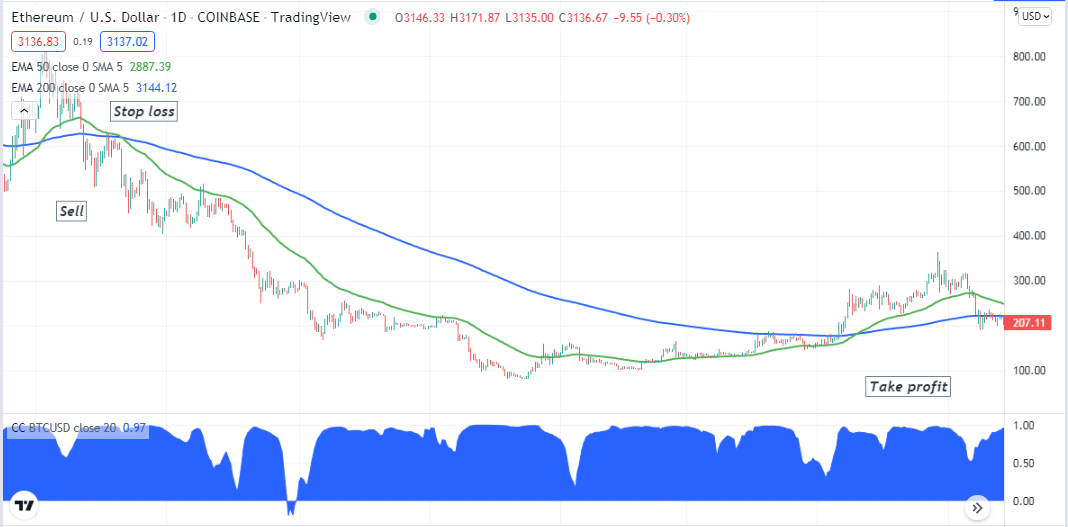
Entry
Match correlation coefficient indicator data with crypto charts and open a sell position.
Stop loss
Place an initial stop loss above the current bearish momentum.
Take profit
You can continue your sell trade until the price drops. Close the sell order when the bearish momentum fades or the green EMA line surpasses above the blue EMA.
Pros & cons
| Pros | Cons |
|
|
|
|
|
|
Final thought
Financial investors widely use the concept of correlation to determine the market context. You can generate enormous amounts of profits by effectively utilizing this concept. Don’t forget trade and money management rules while trading using this concept.


