
You can consider technical indicators as an unavoidable part of the financial market. These tools use various raw market data to obtain the market context, and traders use them readings to predict the future movements of particular financial instruments.
The KDJ is a popular trading indicator in the financial market that helps to identify potential trading positions. However, it requires having a certain level of understanding and knowing any indicator’s components while using them to create sustainable strategies.
Let’s discuss the KDJ indicator besides describing crypto trading methods using it.
What is the KDJ indicator?
It is a standard tool that makes technical analysis more effortless. Its calculation concept shares similarities with another popular stochastic oscillator. The primary difference between these two is it contains three dynamic lines, the %D, %K and the %J, whereas the SO indicator has only two dynamic lines.
These lines fluctuate between 0-100 range in an independent window. The oversold level is below 20%, and the overbought level is 80%. The %K and %D lines fluctuate between these levels. Meanwhile, the %J can reach beyond these levels for extreme bullish or declining forces of price movements.
How to identify trading points in crypto assets using the KDJ indicator?
Cryptocurrencies are decentralized financial assets. Although cryptos are new additions in the financial market, the primary technical factors for tradable financial assets remain the same. So investors frequently use the most effective technical indicators to generate trade ideas on crypto assets.
The KDJ indicator is a universal technical tool that you can use to determine trends and entry/exit points of trades. When the %K and %J line crosses above the %D line, it indicates that the price movement enters in bullish momentum.
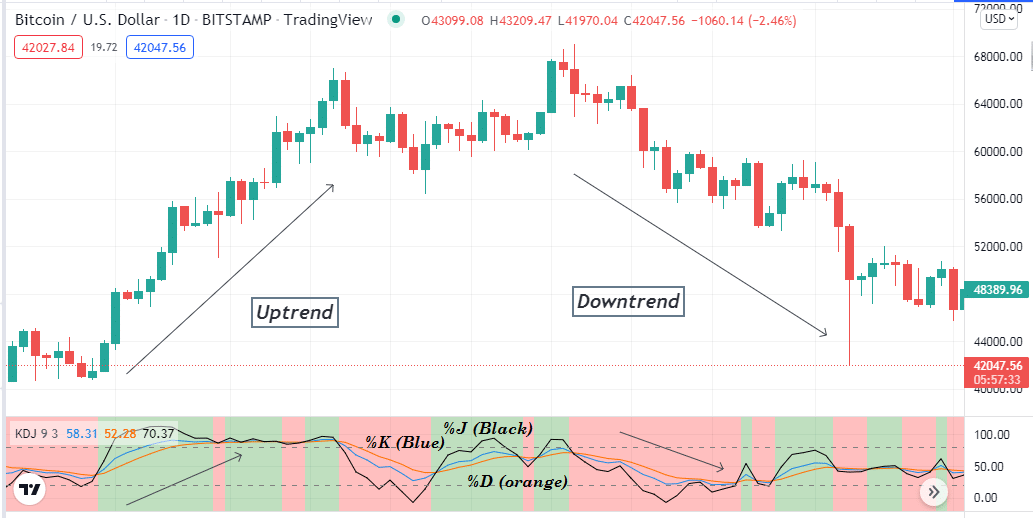
Conversely, the exact opposite crossover between these three dynamic lines signals the initiation of bearish momentum. The %D and %K line is at the upper (80) level, and the %J line reaching beyond that level means the price comes in an overbought condition.
Meanwhile, when the price goes to an oversold condition, these lines act the opposite at the lower (20) level. You can use the KDJ as a standalone indicator to create a completely sustainable crypto trading technique. Many traders combine other technical indicators and tools with the KDJ indicator to increase profitability.
A short-term trading strategy
This trading method uses the volume indicator to confirm the momentums alongside the KDJ indicator. This method determines the swing points through the KDJ indicator and confirms the volume indicator’s directions before entering any trade. It is a suitable trading method for any timeframe.
We recommend using an hourly or 15-min chart to catch the most potent short-term trades. Additionally, choose any crypto-asset with sufficient volatility to execute frequent trades through this method.
Bullish trade scenario
This indicator suggests opening buy positions when:
- The %K line crosses the %D line on the upside.
- The %J line reaches above the %D line on the KDJ indicator window.
- These crossovers occur near the bottom (20) line.
- The volume indicator declares increasing buy pressure on the asset price.
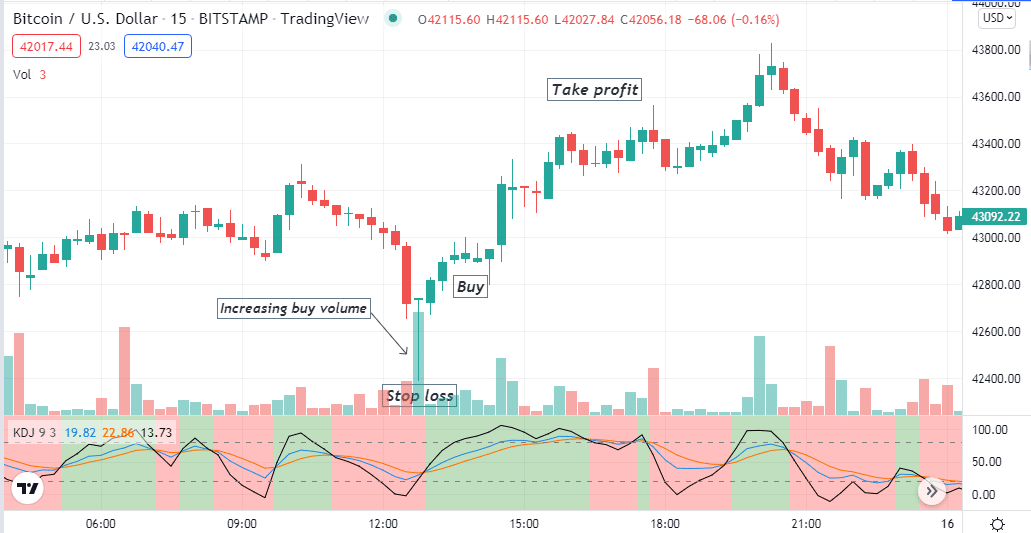
Entry
These conditions above are valid in any chart when the price enters on bullish momentum. Enter a buy trade after matching all.
Stop loss
The initial stop loss level will be below the recent swing low with a buffer of 5-10pips.
Take profit
Close the buy order when:
- The %K line crosses the %D line on the downside.
- The %J line reaches above the upper (80) line or crosses below the %D line after reaching that level.
- The volume indicator suggests increasing sell pressure on the asset price.
Bearish trade scenario
This indicator suggests opening sell positions when:
- The %K line crosses the %D line on the downside.
- The %J line reaches below the %D line on the KDJ indicator window.
- These crossovers occur near the upper (80) line.
- The volume indicator declares increasing sell pressure on the asset price.
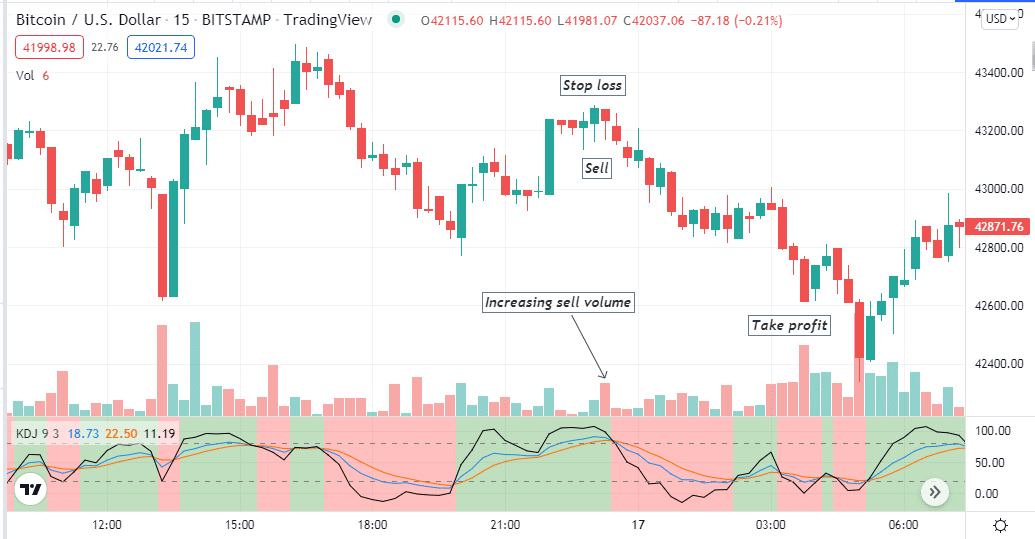
Entry
These conditions above are valid in any chart when the price enters on bearish momentum. Enter a sell trade after matching all.
Stop loss
The initial stop loss level will be above the recent swing high with a buffer of 5-10pips.
Take profit
Close the sell order when:
- The %K line crosses the %D line on the upside.
- The %J line reaches below the lower (20) line or crosses above the %D line after reaching that level.
- The volume indicator suggests increasing buy pressure on the asset price.
A long-term trading strategy
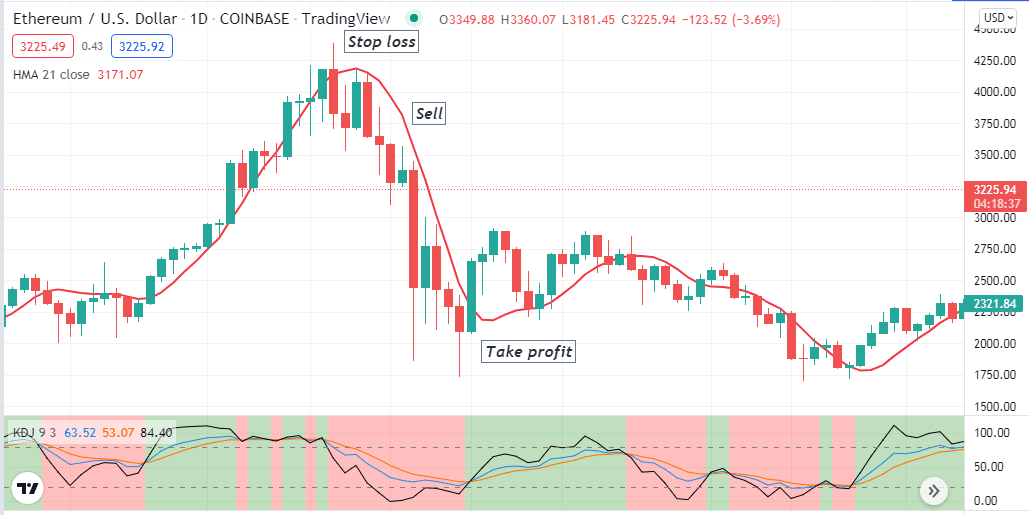
We use an HMA of 21 periods in this trading method as a supportive indicator beside the KDJ indicator. It is a suitable trading method for any trading asset; use an H4 or a D1 chart to catch the best long-term trades using this strategy.
Bullish trade scenario
Seek to open a buy position when three lines are getting together near the lower (20) level of the KDJ indicator. Observe when:
- The %K line crosses the %D line on the upside.
- The %J line reaches above the %D and %K lines.
- The HMA line starts sloping on the upside.
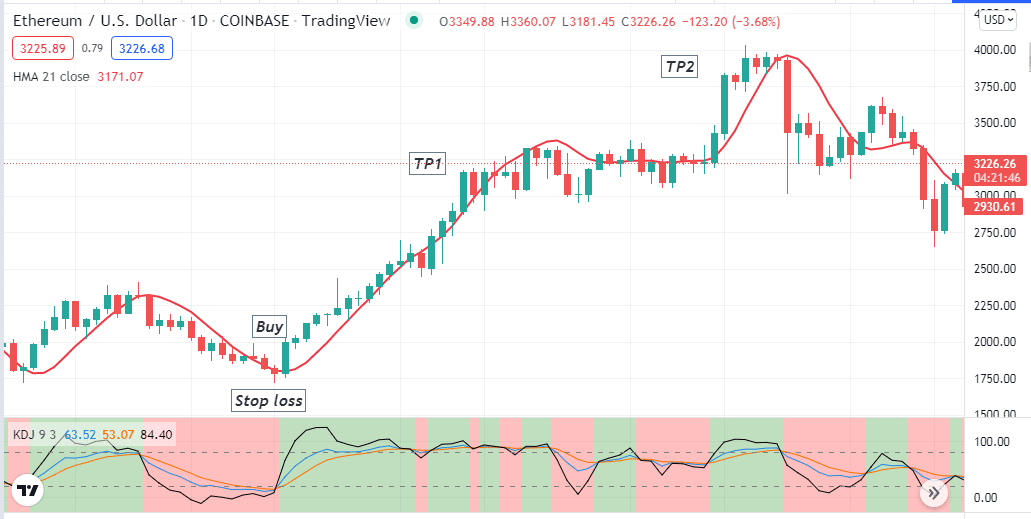
Entry
When these conditions above match your target asset chart, wait until the current bullish candle closes above the HMA line, then open a buy position.
Stop loss
Place a reasonable stop loss below the bullish momentum.
Take profit
Close the buy order when:
- The %J line reaches above the upper (80) line.
- The %K line crosses the %D line on the downside near the upper (80) level.
- The price closes below the HMA line.
- The HMA line starts sloping on the downside.
Bearish trade scenario
Seek to open a sell position when three lines are getting together near the upper (80) level of the KDJ indicator. Observe when:
- The %K line crosses the %D line on the downside.
- The %J line reaches below the %D and %K lines.
- The HMA line starts sloping on the downside.
Entry
When these conditions above match your target asset chart, wait until the current bearish candle closes below the HMA line, then open a sell position.
Stop loss
Place a reasonable stop loss above the bearish momentum.
Take profit
Close the sell order when:
- The %J line reaches below the lower (20) line.
- The %K line crosses the %D line on the upside near the lower (20) level.
- The price closes above the HMA line.
- The HMA line starts sloping on the upside.
Pros and cons
| Pros | Cons |
| It is an omnipresent indicator for any trading asset. | The indicator only depends on the technical info while ignoring many fundamental factors. |
| This indicator determines both swing points and trends. | This tool can fail due to fundamental reasons. |
| It allows executing both short-term and long-term trades. | The indicator is not among the built-in indicators in all trading platforms. |
Final thought
Finally, you know all the basic information about the KDJ indicator, one of the most popular, easily applicable trading indicators. You can use other technical indicators and tools such as the ADX, Fibonacci retracement, support and resistance, MACD, MA crossover, etc., alongside the KDJ indicator to execute constantly successful trading positions in crypto assets.


