

The diamond pattern is a reversal price pattern that appears at the swing level. It represents a story where the price makes a new higher high with a drop to the support level followed by a new swing high that moves down quickly.
When this pattern appears in the chart, we can say that the opposite party has joined the market, and a reversal may happen at any time.
In cryptocurrency trading, finding the top and bottom of a trend is significant as it allows market participants to remain at the beginning position of a swing. Therefore, if you are interested in building a solid crypto portfolio, you should keep the diamond pattern in your price action pattern watchlist. The following section will cover everything you should know about this pattern in crypto trading.
What is a diamond chart pattern?
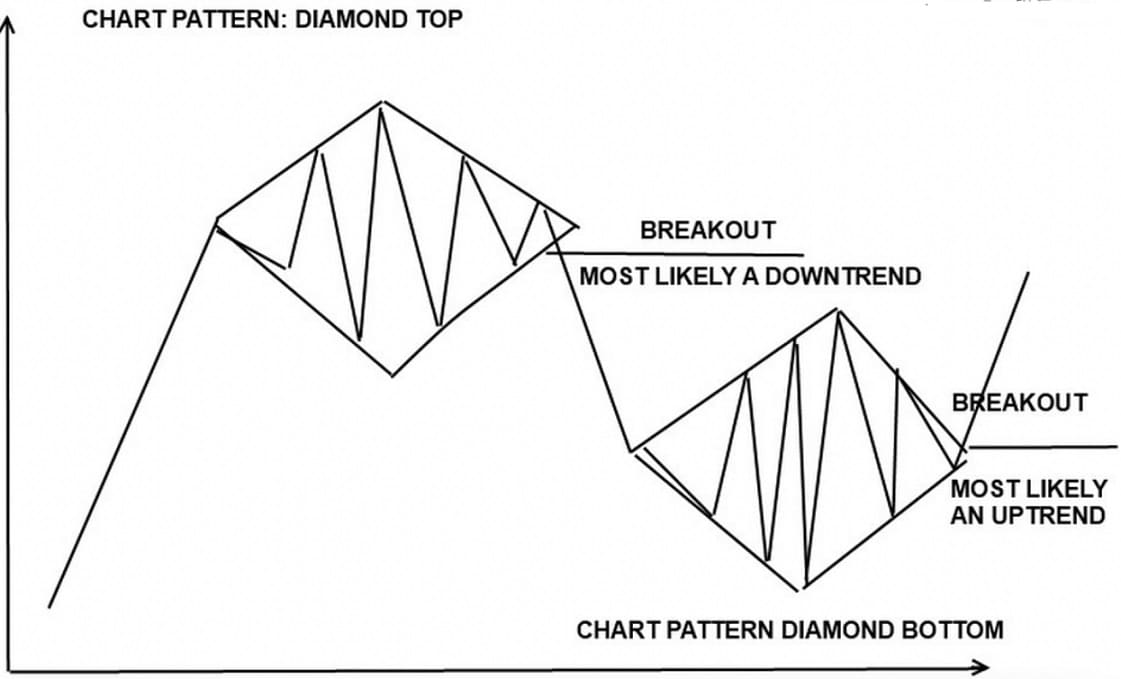
It appears at the top and bottom of a trend and shows the opposite party’s dominance. It is similar to the traditional head and shoulder pattern with a V-shaped neckline.
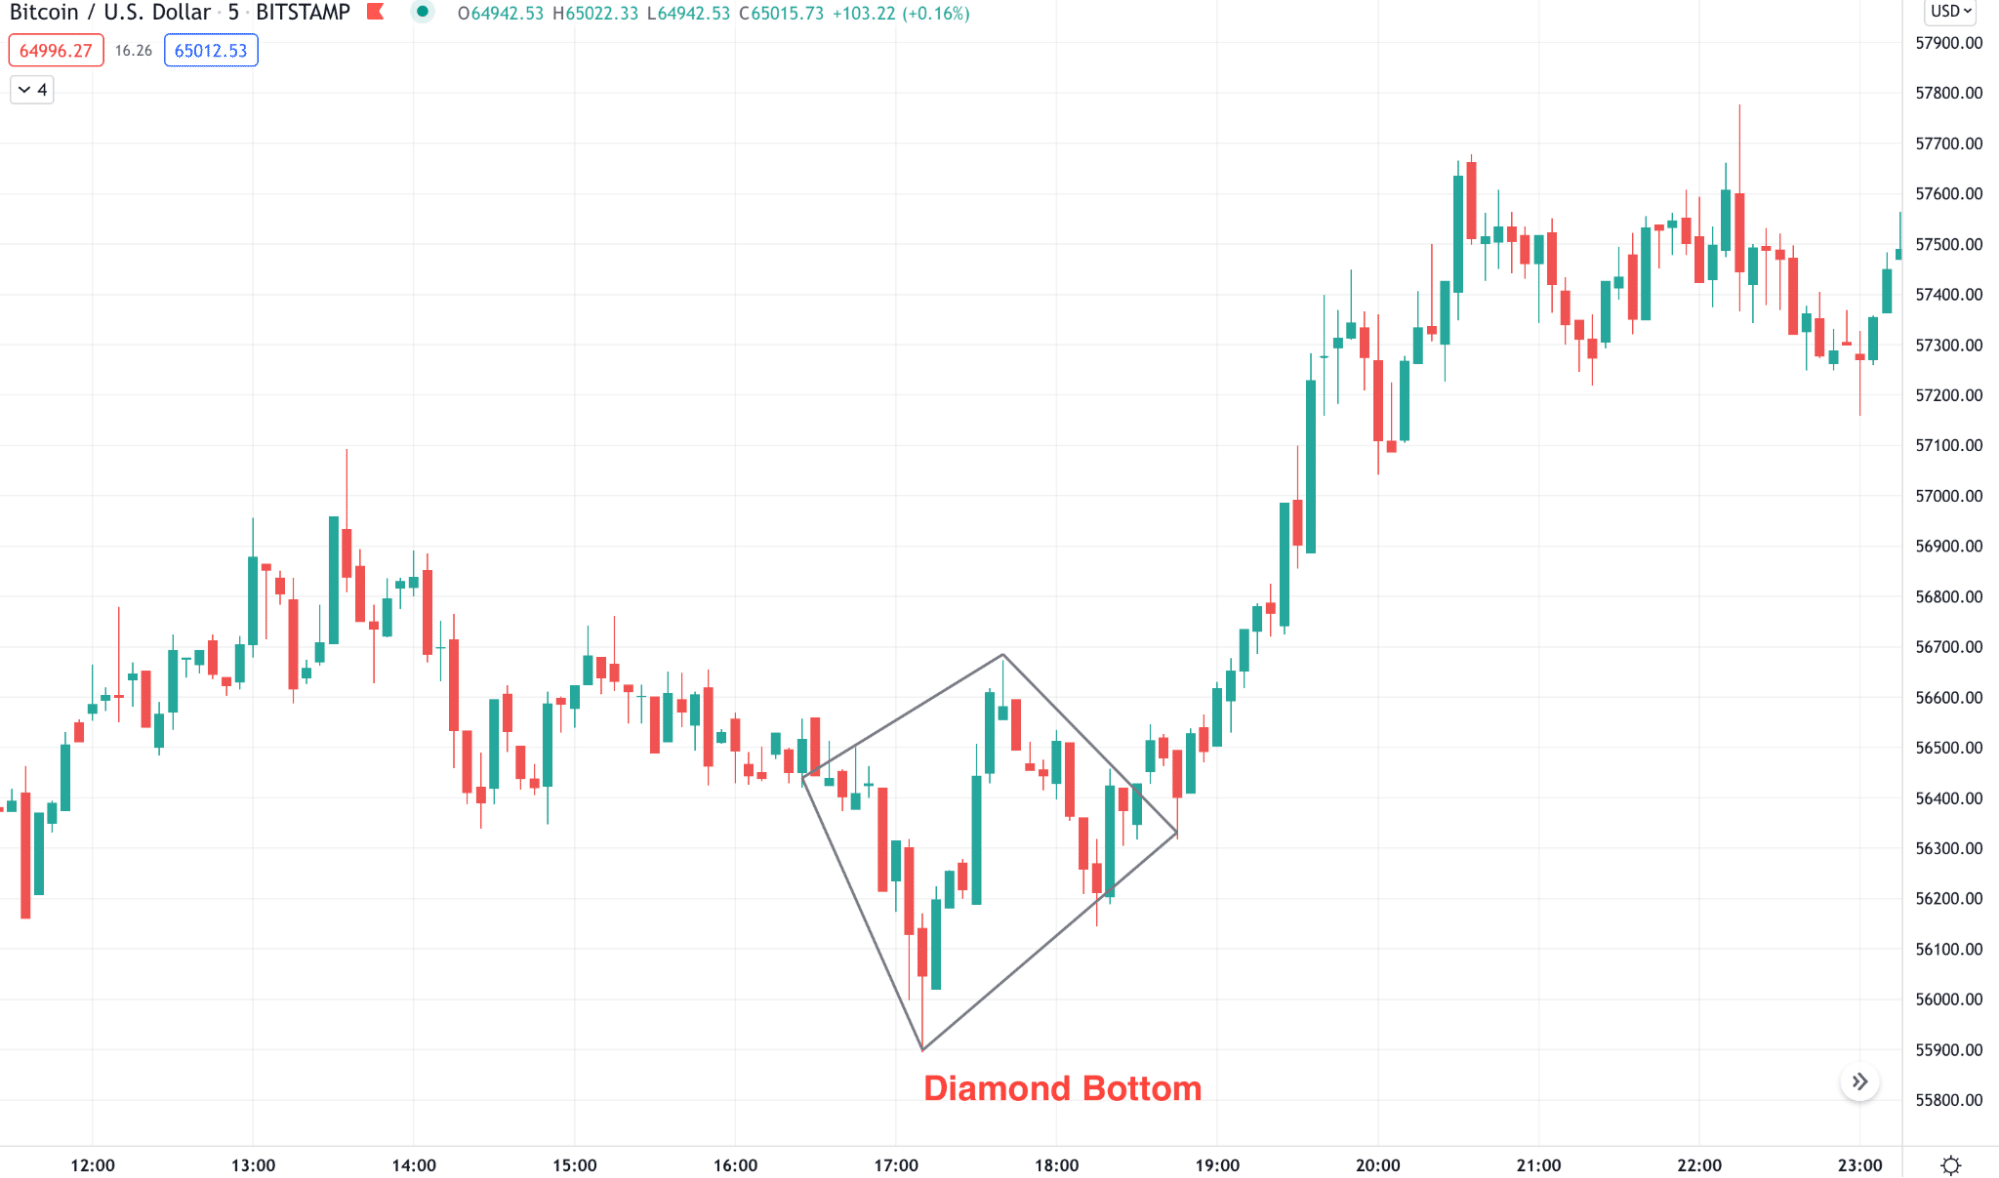
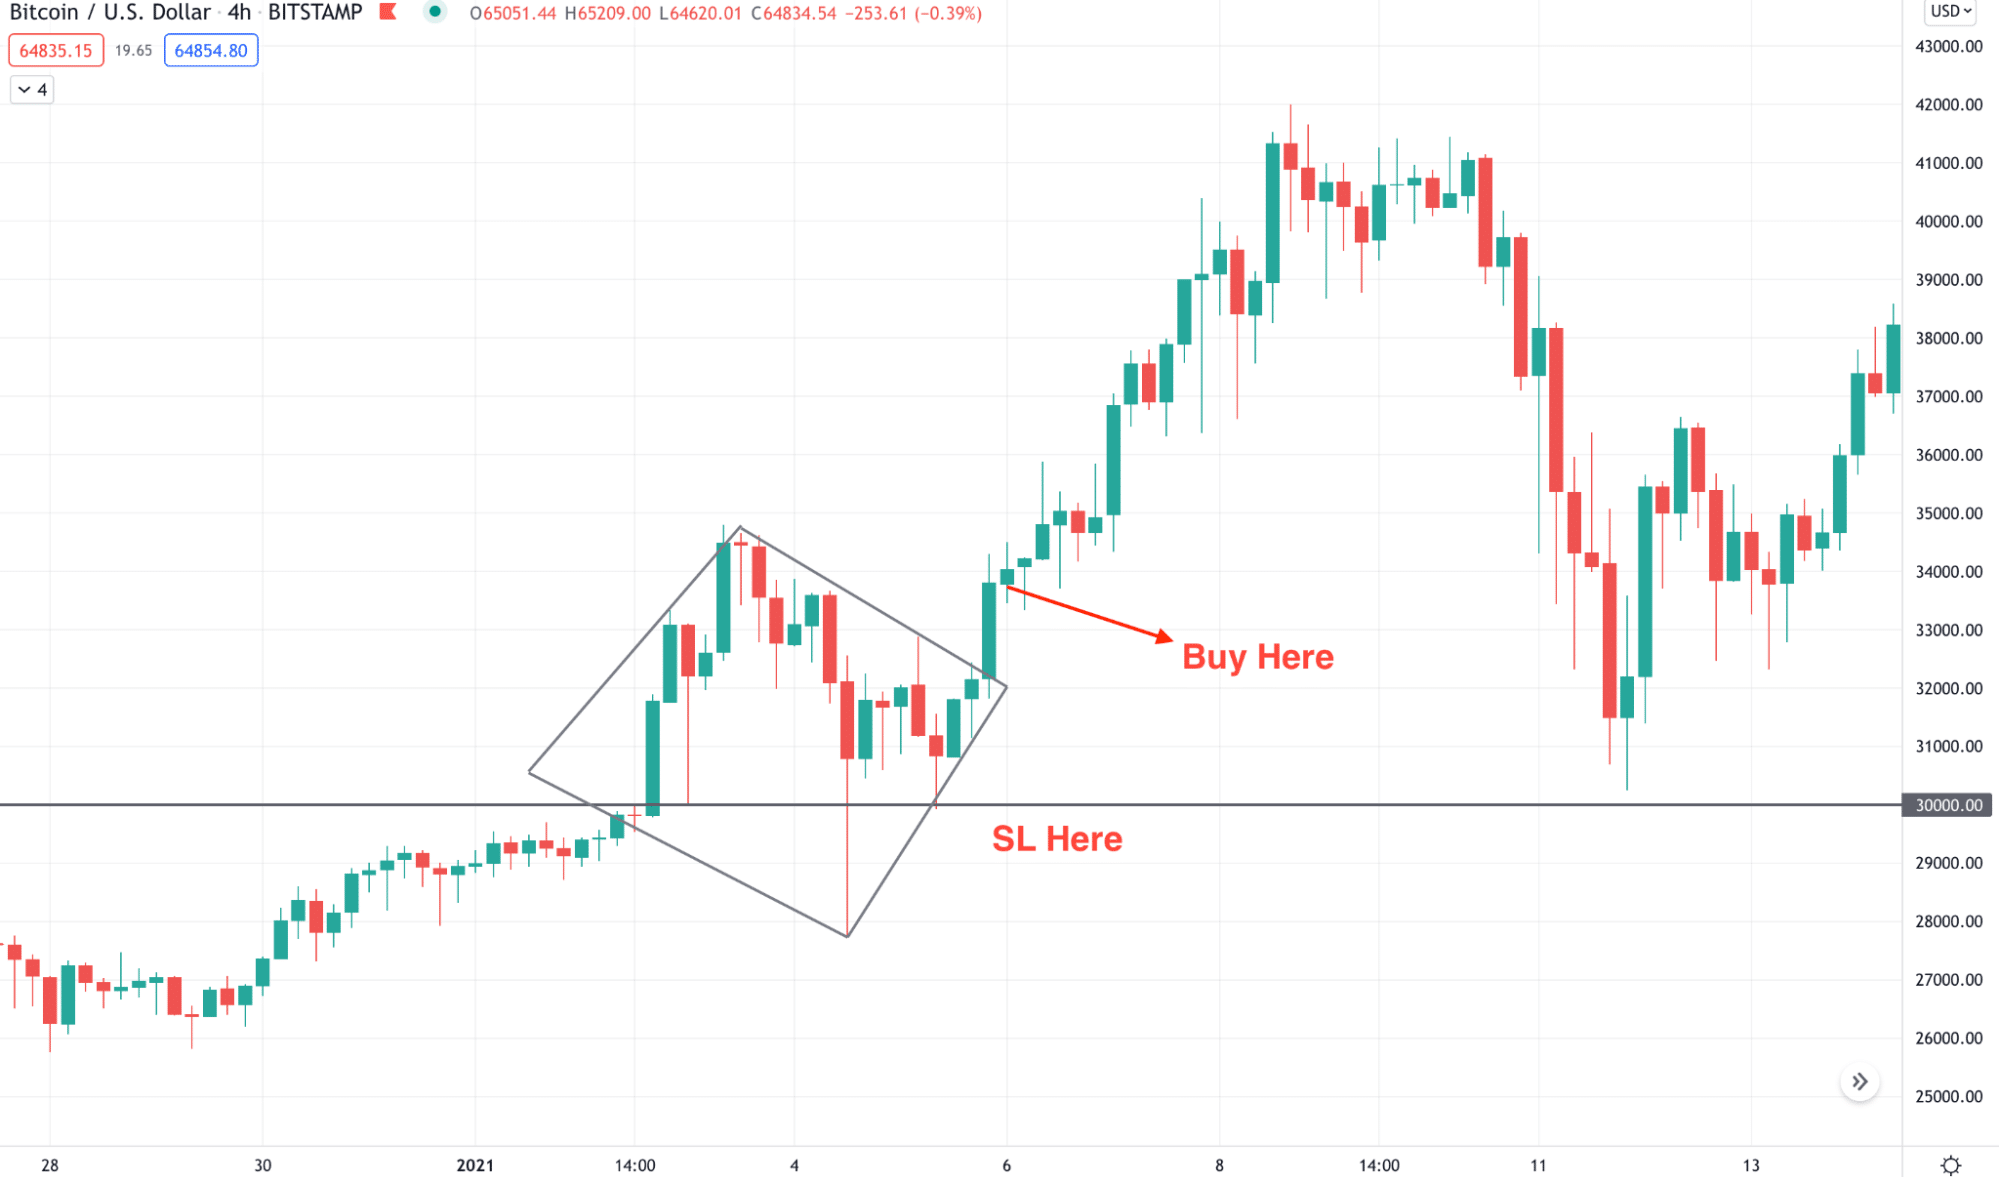
It is applicable in both bullish and bearish markets. Therefore, you can use it as both entry and exit confirmation. For example, when the diamond bottom formed in the swing low of an overall bullish trend, it creates a buying chance. In this system, the price makes a new high but drops immediately. Later on, the price moves higher for the second time and fails to break the high. As a result, the price came lower, but instead of making new lows, it began to rise just like the image below.
Here we can see that the price squeezes to a level by forming a pattern like a diamond. Before opening a trade using this pattern, traders should know how to explain the market utilizing this price structure.
Look carefully at the image. In both diamond top and diamond bottom patterns, the price makes new highs and lows, which signifies that bulls and bears became active in the price. However, we know the financial market is very uncertain where they might change the decision at any time. In this way, a few moments later, bulls and bears became indecisive about the future price.
As a result, the price becomes corrective after making a new high and low and squeezes to a level. Remember that when a squeeze or a correction appears, it has a higher possibility that the price will follow the trend. Therefore, diamond top from the bearish swing high and diamond bottom from the bullish swing low have higher success rates.
How do we identify a diamond bottom?
In crypto trading, finding a reliable entry area is essential. You cannot randomly open a buying position just with the hope that the coin’s price will rise. Therefore, opening a buy trade from a diamond bottom breakout would take your trading to the next level.
Let’s see conditions to identify the diamond bottom pattern:
- The overall market trend is down, and the price reaches a swing low.
- Price formed a shape like a diamond, tilted on one side.
- Price makes new highs and lows but starts to squeeze within the top and bottom.
- It follows the trendline from swing high and swings low.
How do we trade using a diamond chart pattern?
The diamond pattern indicates a reversal of the current momentum. Therefore, when it forms, we should look for a breakout towards the opposite side. The success rate of this pattern is reasonable if traders can match it with the overall market context.
Diamond bottom pattern
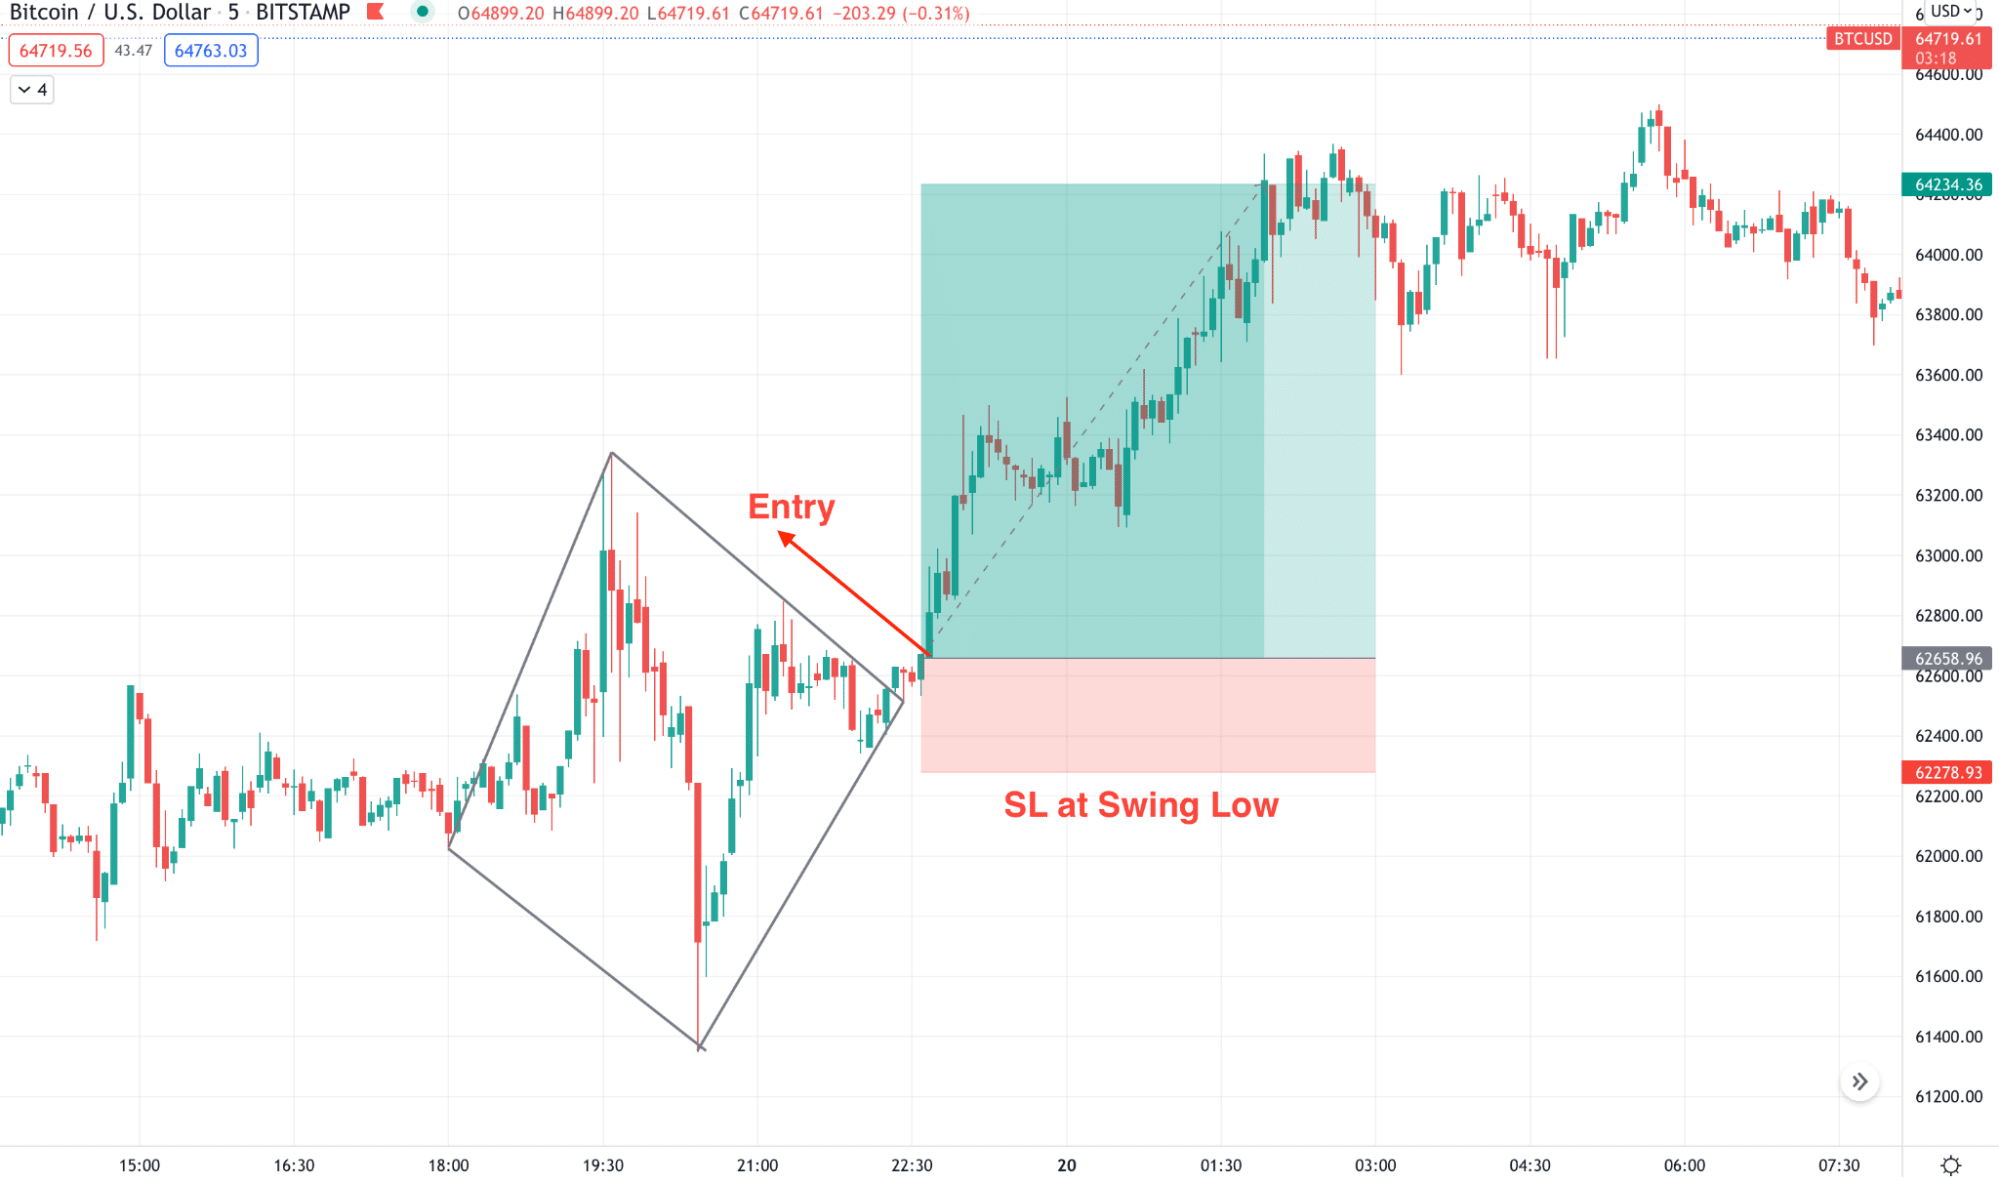
The diamond bottom shows the possible entry of bulls. Therefore, we should find it at a swing low. When we see this pattern, wait to complete it and open a trade after a considerable correction. Moreover, a strong trade management system is also applicable to this strategy.
Diamond top pattern
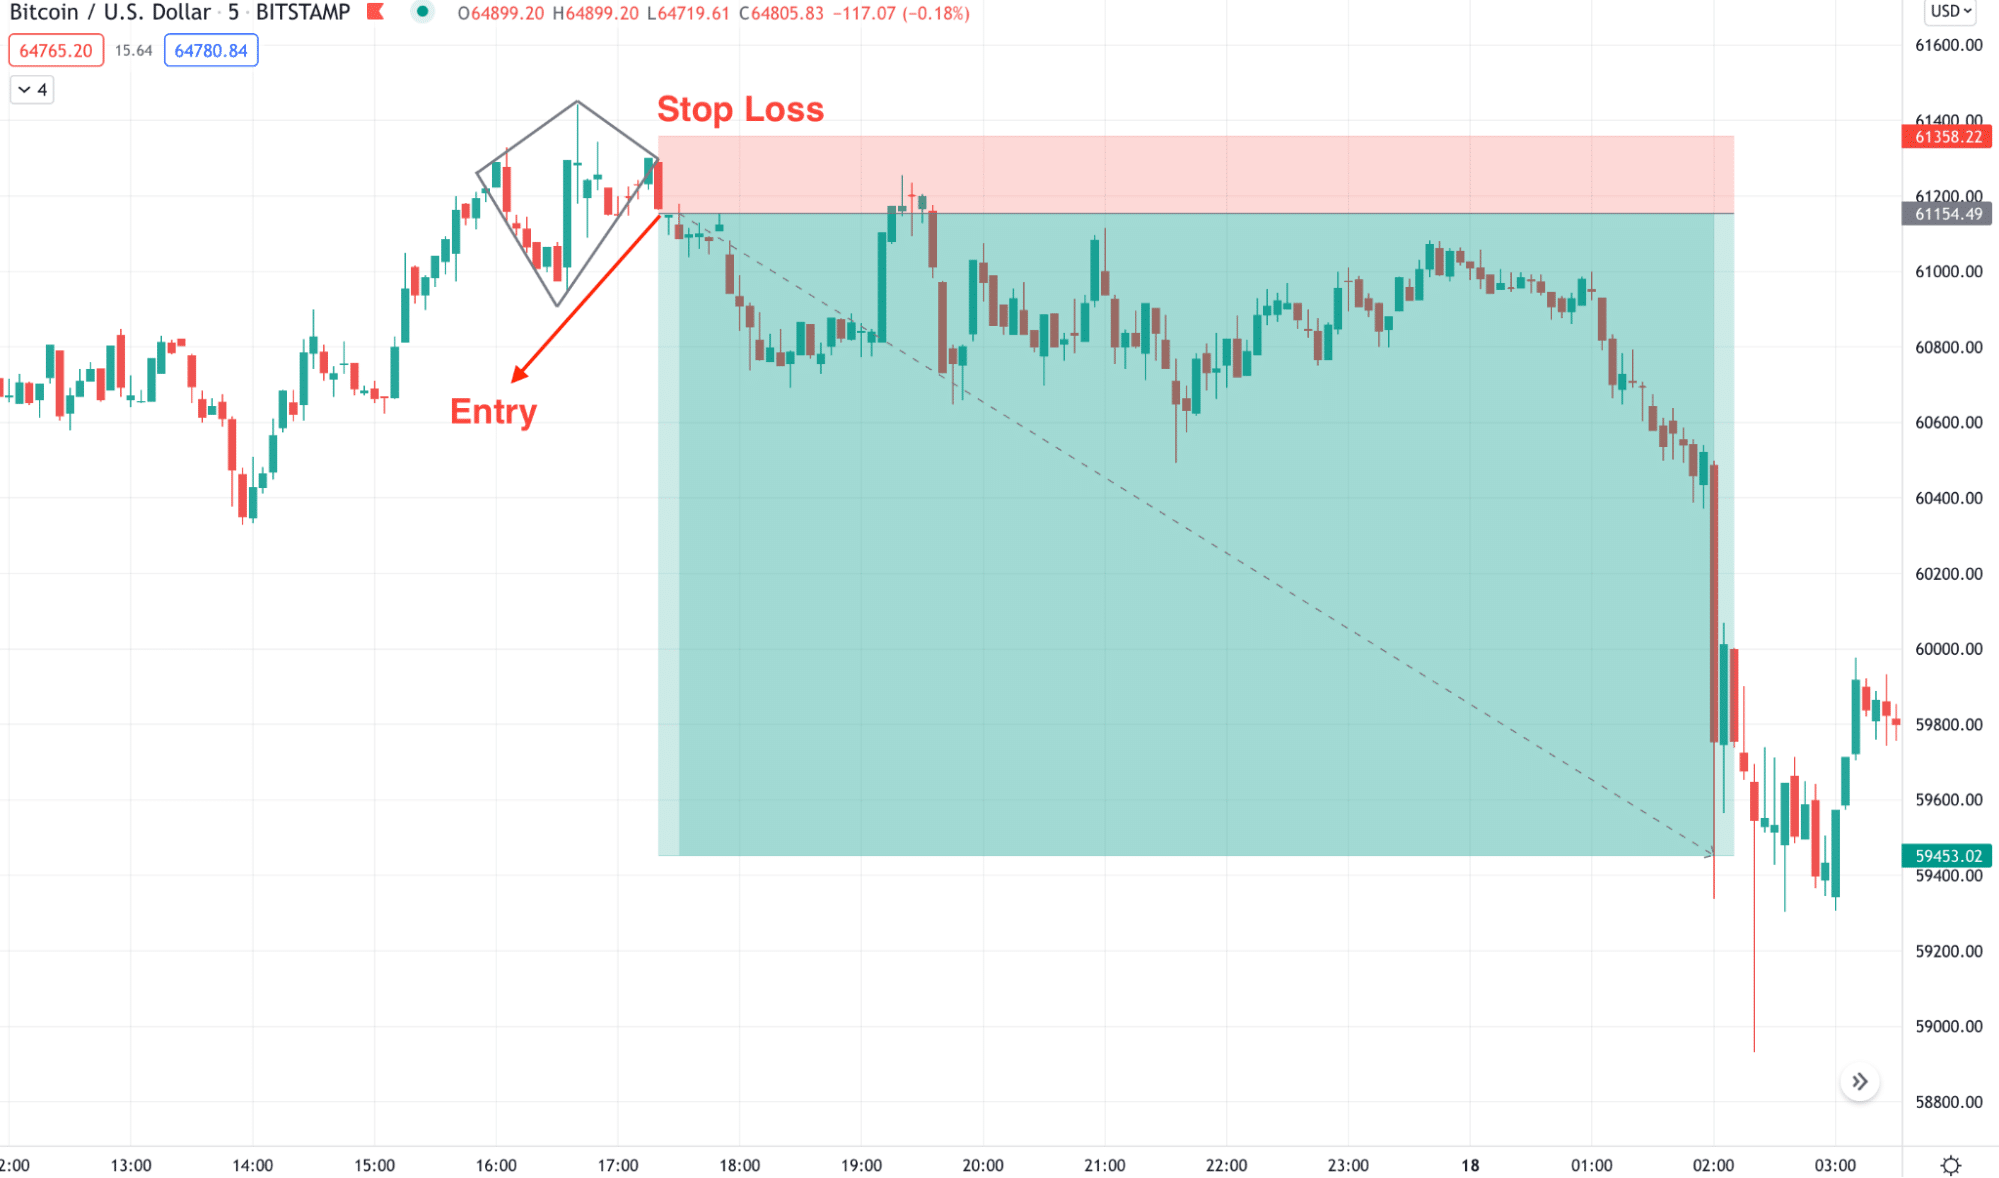
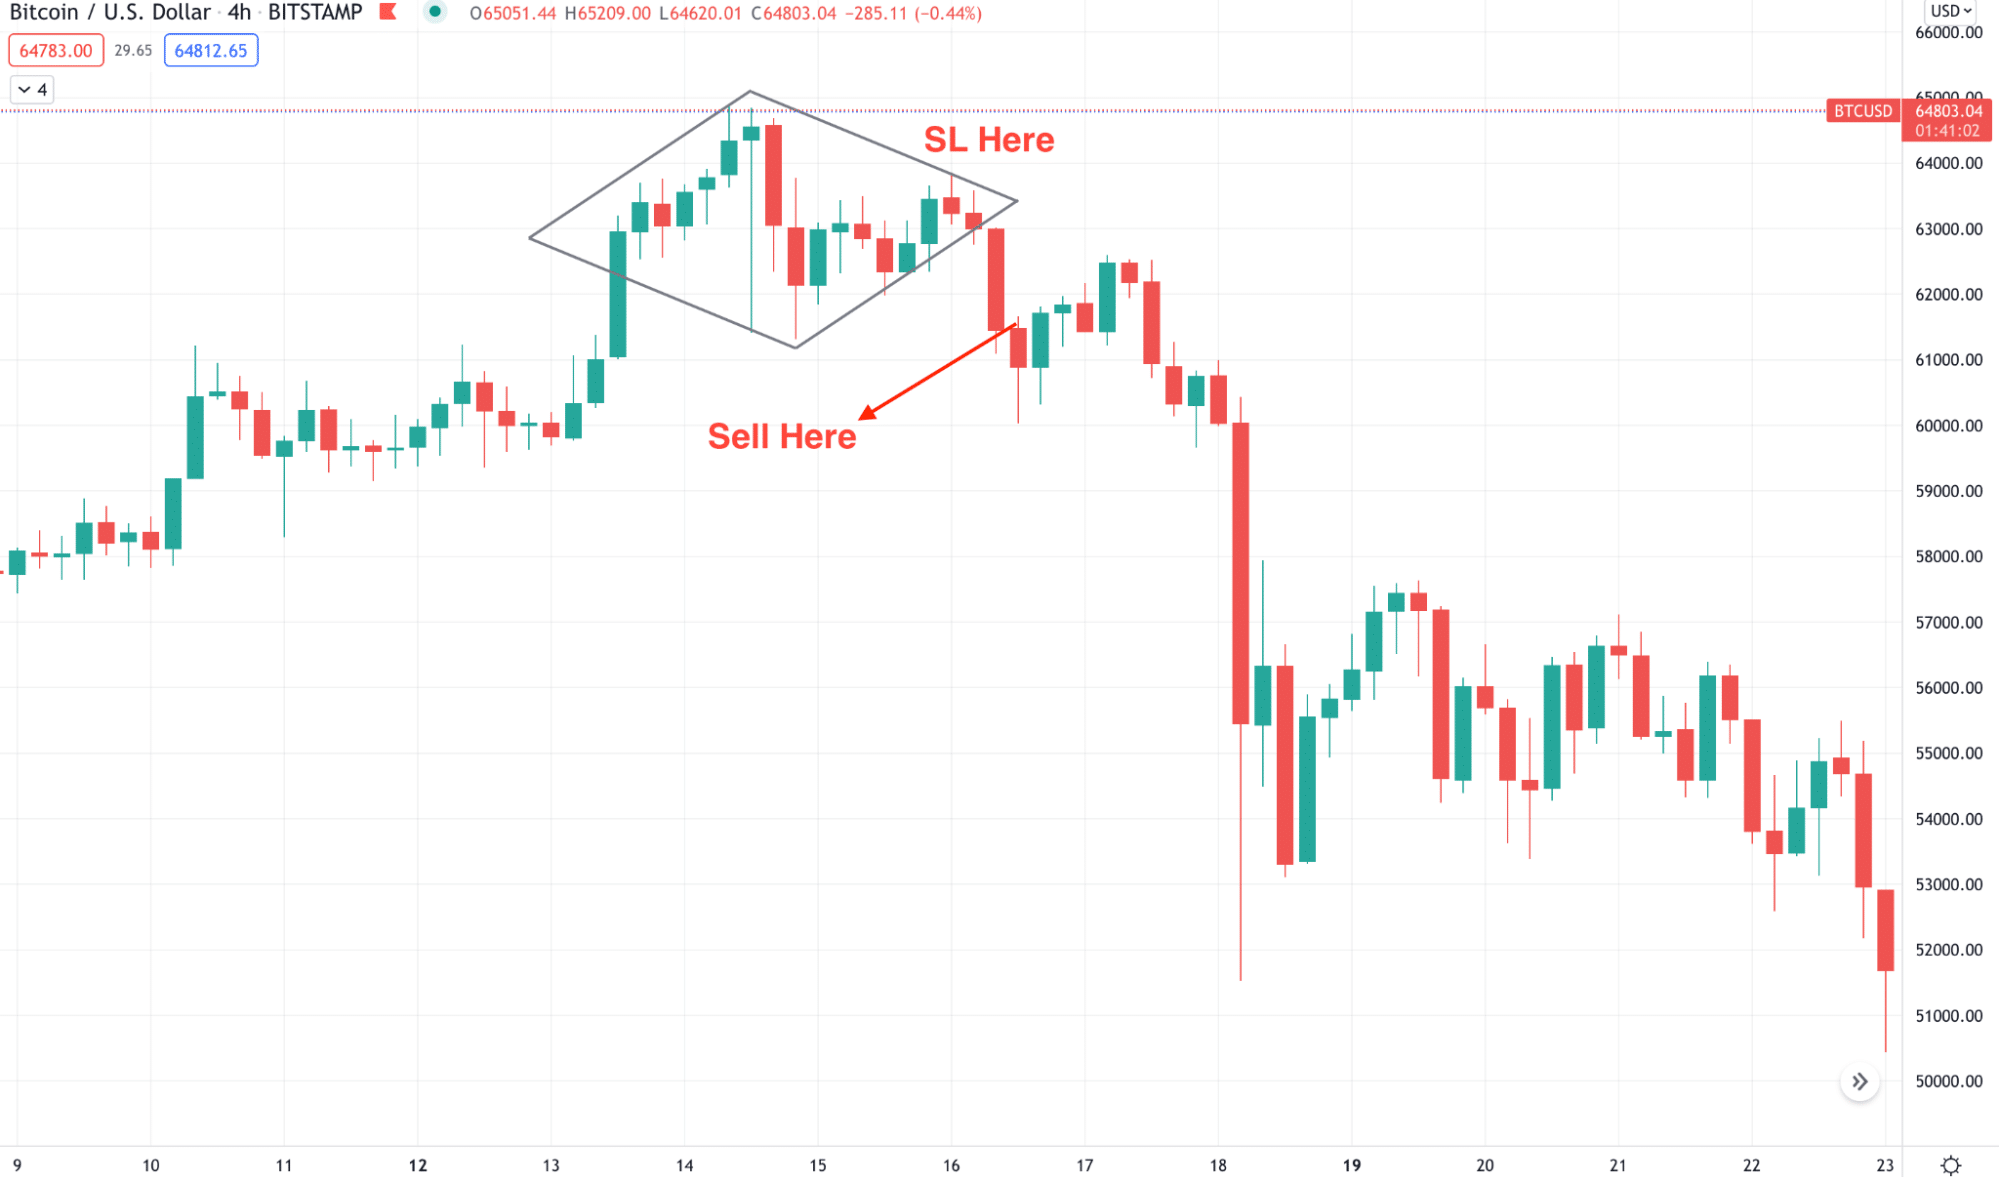
The diamond top shows the possible selling entry in a trend. Therefore, we should find it at a swing high. When we see this pattern, wait to complete it and open a trade after a considerable correction.
A short-term strategy
Let’s see how to make a buy and sell trade using the diamond pattern.
Bullish trade setup
- The broader market trend is bullish.
- Price reaches the swing low and forms a diamond bottom pattern in the m5 or m15 chart.
- Price breaks out from the diamond pattern swing and retraces the level.
- The trading entry is valid after a bullish candle forms from the retracement.
- Set the stop loss below the swing low and take profit based on risk and reward.
Bearish trade setup
- The broader market trend is bearish.
- Price reaches the swing high and forms a diamond top pattern in the m5 or m15 chart.
- Price breaks down from the diamond pattern swing and retraces the level.
- The trading entry is valid after a bearish candle forms from the retracement.
- Set the stop loss above the swing high and take profit based on risk and reward.
A long-term strategy
The long-term strategy applies H4 to the daily chart where traders are interested in holding the trade for more than a week and even months.
Bullish trade setup
- The broader market trend is bullish.
- Price reaches the swing low and forms a diamond bottom pattern in the daily or H4 chart.
- Price breaks out from the diamond pattern swing and retraces the level.
- The trading entry is valid after a bullish candle forms from the retracement.
- Set the stop loss below the swing low and take profit based on risk and reward.
Bearish trade setup
- The broader market trend is bearish.
- Price reaches the swing high and forms a diamond top pattern in the daily or H4 chart.
- Price breaks down from the diamond pattern swing and retraces the level.
- The trading entry is valid after a bearish candle forms from the retracement.
- Set the stop loss above the swing high and take profit based on risk and reward.
Pros & cons
Let’s see the pros and cons of such a strategy.
| Pros | Cons |
| It is a good price reversal pattern that is applicable in both bullish and bearish markets. | Less accurate in lower time frames. |
| This pattern appears at the swing high and low, so the risk and reward ratio remains stronger. | We need a strong trade management system. |
| Easy to spot with trendlines. | It does not work well in a volatile market. |
Final thoughts
Trading these patterns can seem a little daunting — it requires keen eyesight and a lot of practice. However, learning to spot this pattern can be helpful for both novice and experienced traders. Please note that no strategy or chart pattern can guarantee 100% success, so a robust risk management approach must be applied along with this.


