
The golden cross is one of the profitable FX trading methods with a higher success rate for many years. Finding a proper golden cross in the price chart would increase your trades probability to a level where you can enjoy profits without any risk.
Understanding the key concept of the golden cross is very important for a trader. You cannot open a trade by just looking at the golden cross on the chart. When we talk about the golden cross method in the FX market, we need to follow a systematic rule that includes understanding the pattern, reading the price, opening and managing trades.
In the next section, we will learn the anatomy of the golden cross pattern in forex trading. After completing the article, you can spot and trade this pattern in any pair.
What is the golden cross pattern?
The golden cross appears when the 50 day MA moves above the 200 days MA, pointing out that short-term bulls become more active while long-term bulls are still in action.
The moving average is a free forex indicator that works well to find where the price is heading. The ideal approach is to find the price above this tool to consider the market context as a buy. On the other hand, if the price moves below the MA, it may indicate a trend change to the downside.
Let’s check the image below.
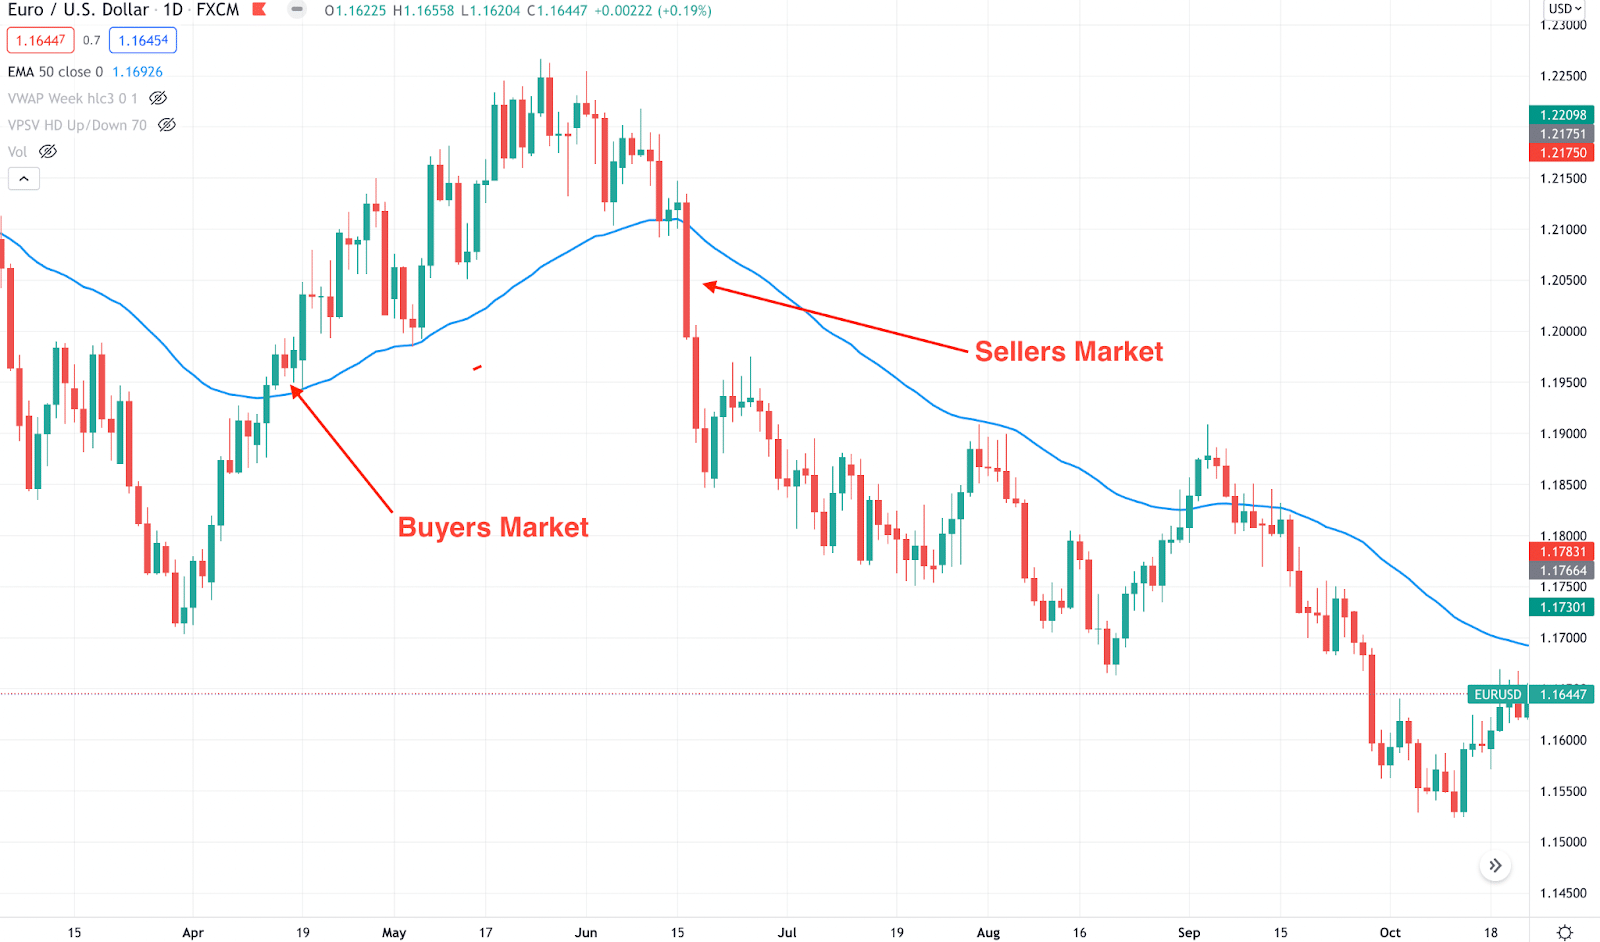
In the daily chart of EUR/USD, the buying pressure extended when the price moved above the 50 EMA. On the other hand, the selling pressure extended below the 50 EMA.
Why does the price extend from the EMA?
It is 50 EMA on the daily chart, so when the price moves above the 50 EMA, it signifies that bulls are strong. A similar theory is applicable for 200 days moving averages. If it moves above the 200 SMA, we can say that long-term bulls are active, and the trend may extend.
But what if the 50 EMA crosses above the 200 SMA?
It indicates that long-term investors are active while short-term bulls are following them more aggressively, resulting in a golden cross.
How to identify the golden cross?
The golden cross shows a bullish sign of a trend that is easy to spot by adding 200 SMA and 50 EMA. Later on, traders should find the following conditions in the chart:
- The price is above the 50 SMA and aims higher.
- 50 EMA is aiming higher and moves above the 200 SMA.
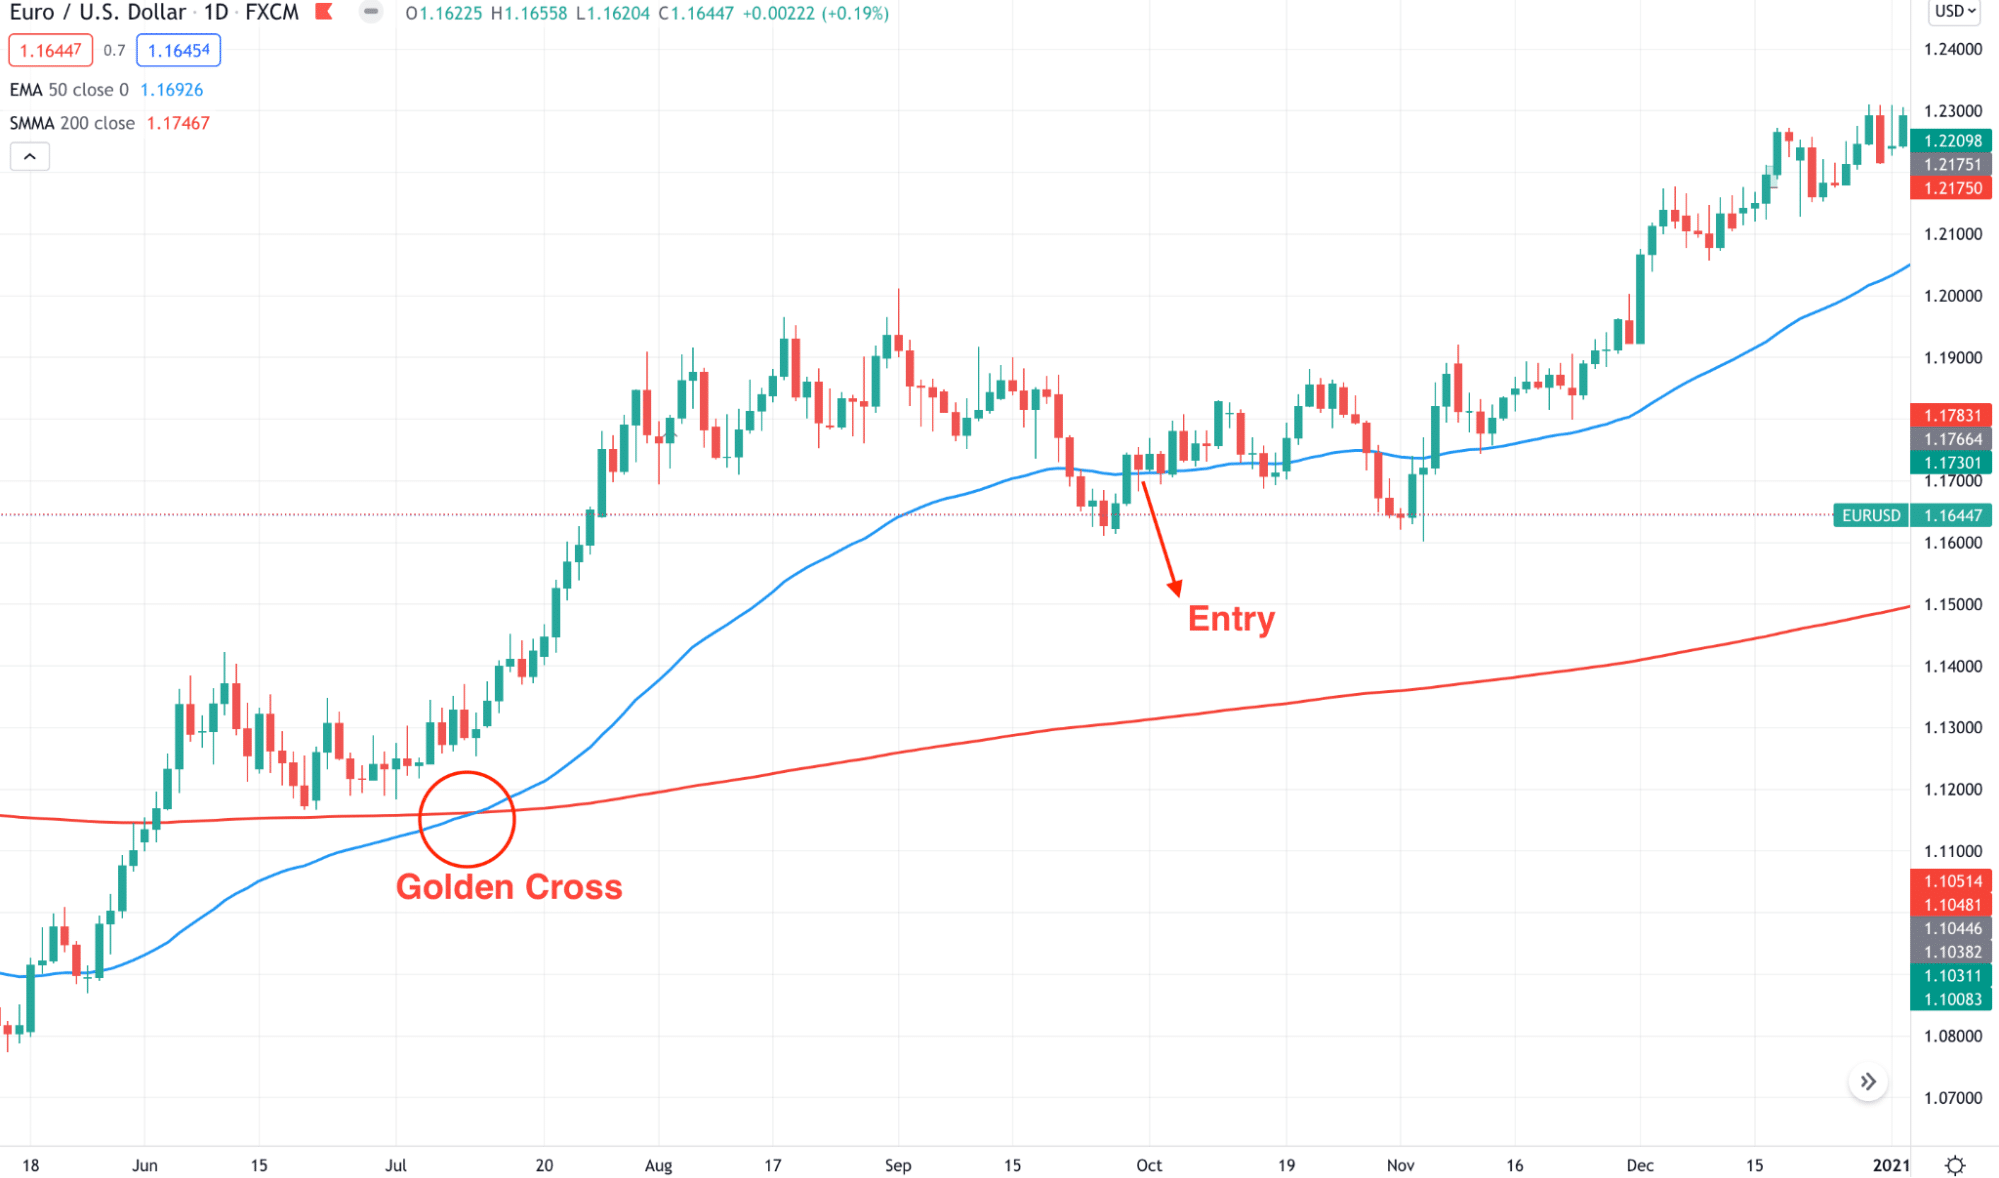
Let’s see an example from the real chart.
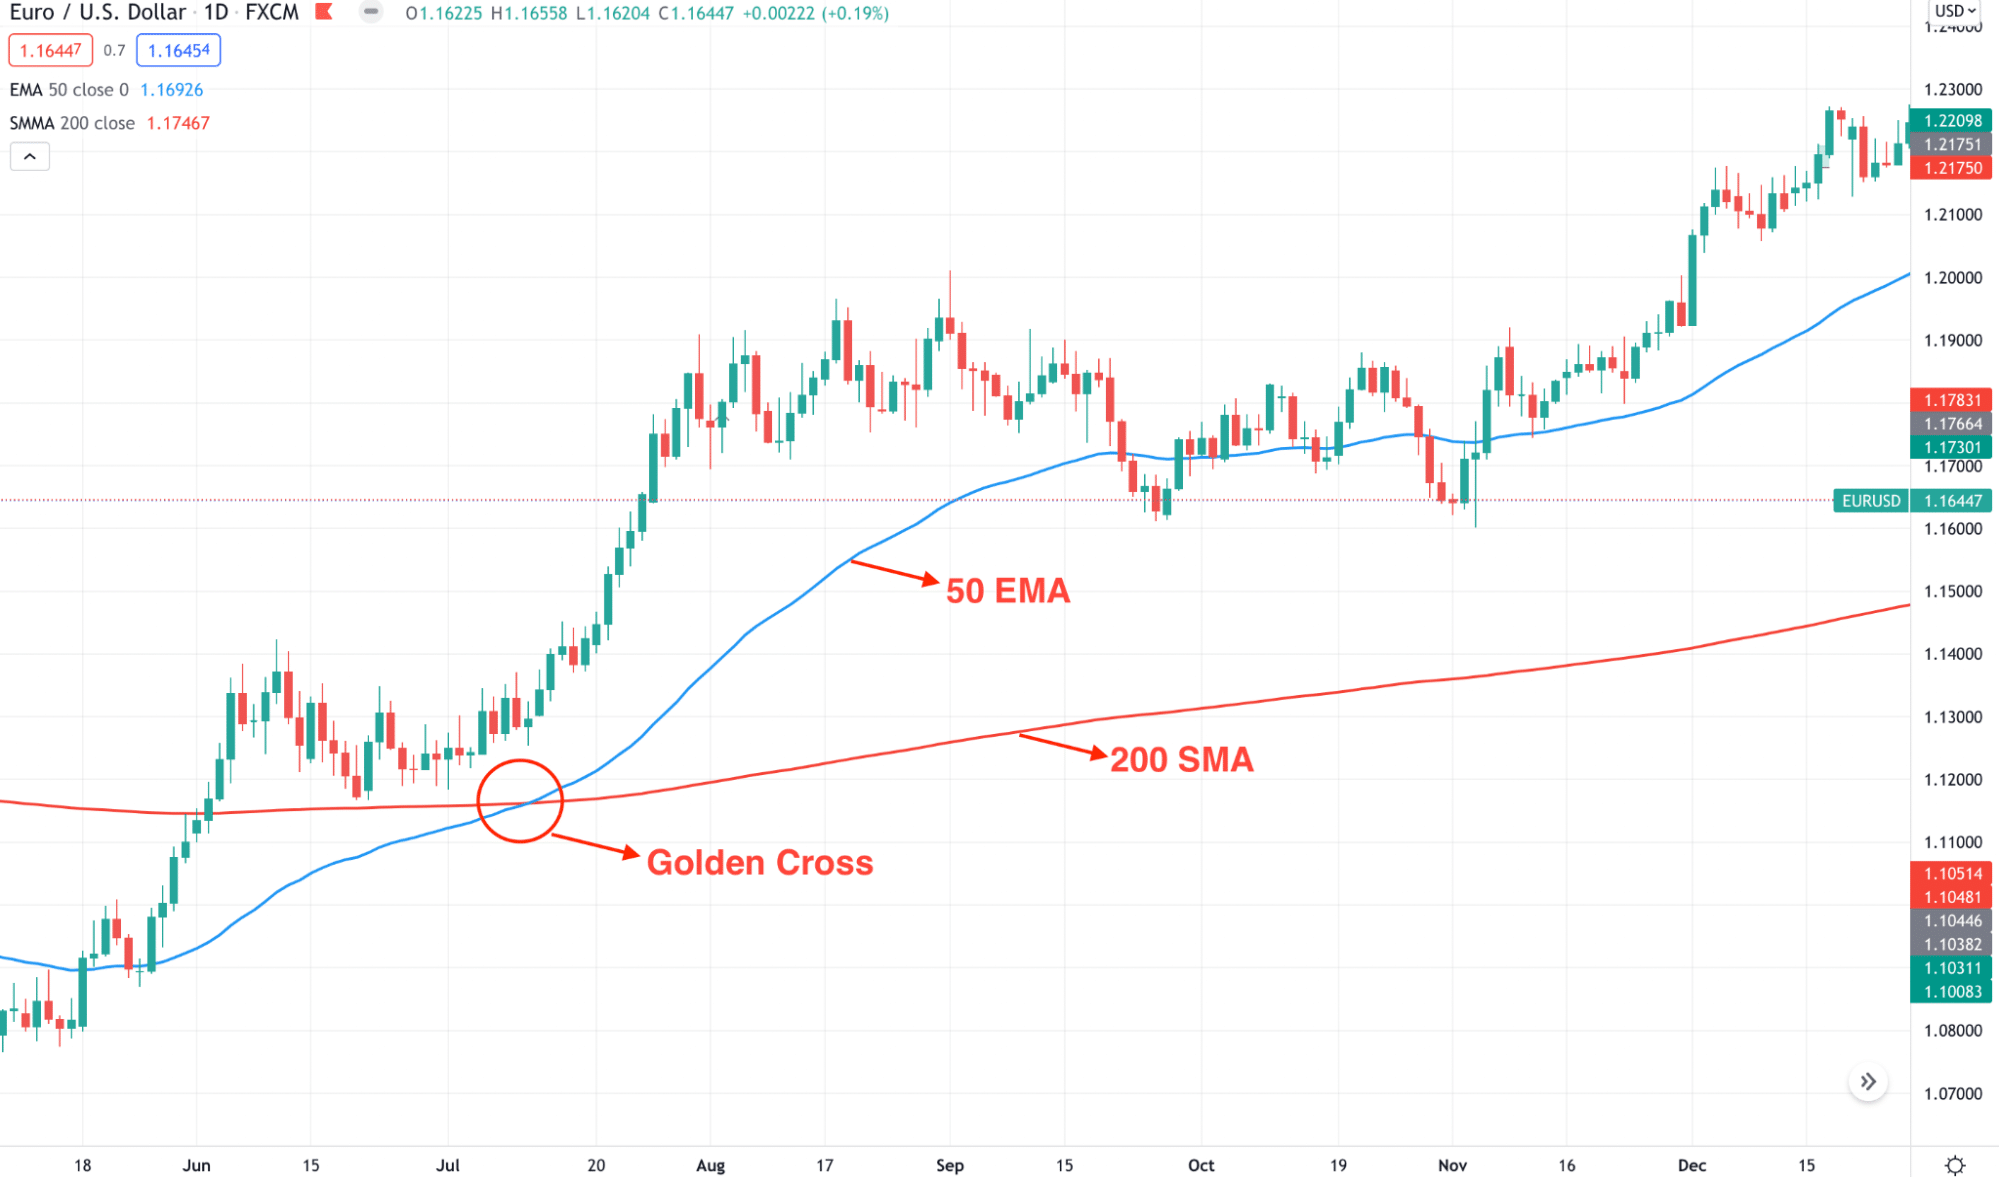
The above image illustrates that the 50 EMA (blue line) crosses above the 200 SMA (red line) and forms a golden cross. As a result, the price advanced higher by providing more profits to bulls.
A short-term strategy
The golden cross is suitable for daily chart trading, but you can use it on any time frame. However, the accuracy is less in short-term trading that may need to use additional confirmations.
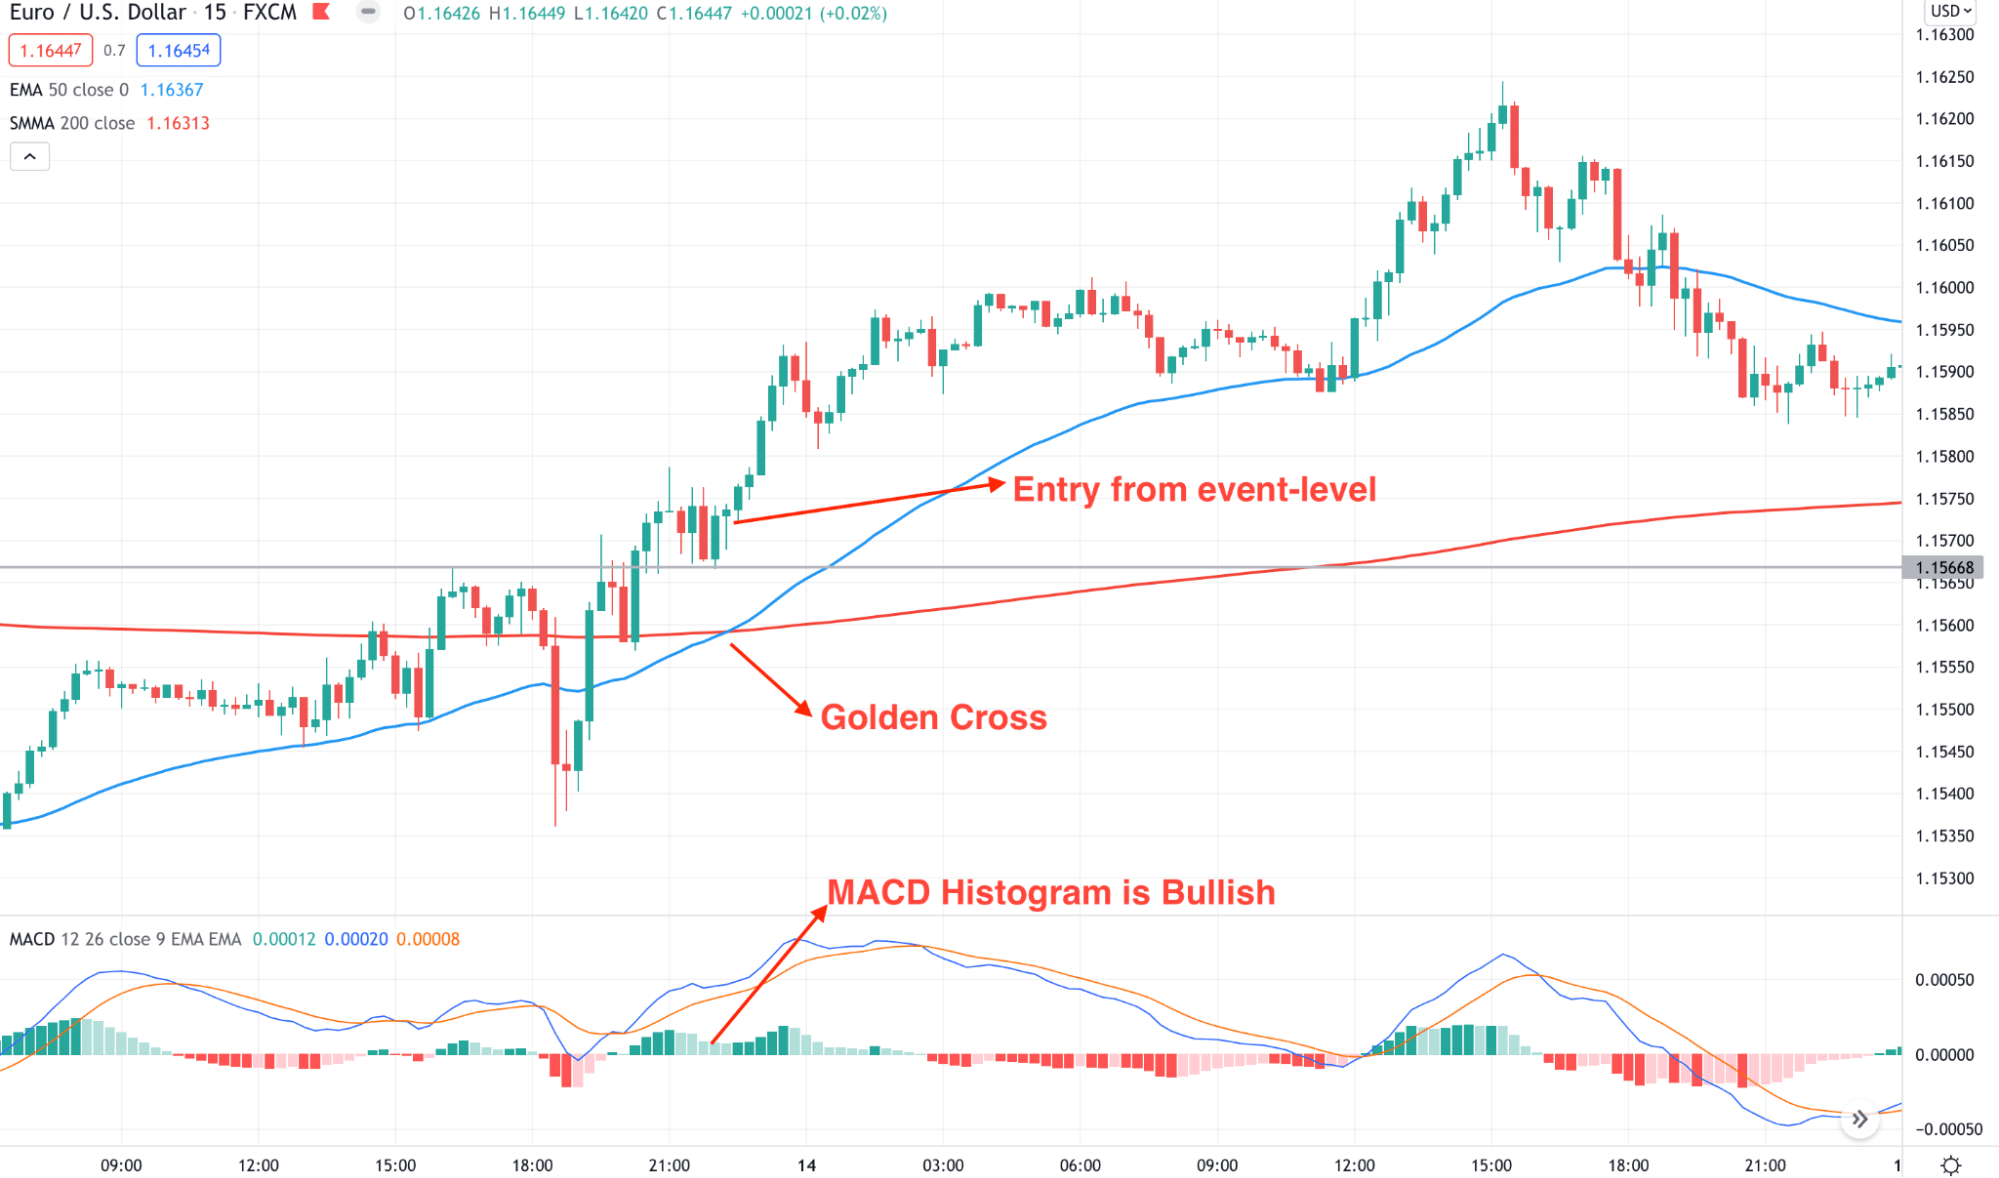
Bullish trade setup
Before opening a buy trade, make sure to find the following conditions:
- The overall market context is bullish
- The 50 EMA crossed above the 200 SMA on a 15 minutes chart, and the price remained above the 50 SMA.
- Price reaches an important intraday event level and shows a bullish rejection candle.
- Meanwhile, the MACD histogram is bullish and aiming higher.
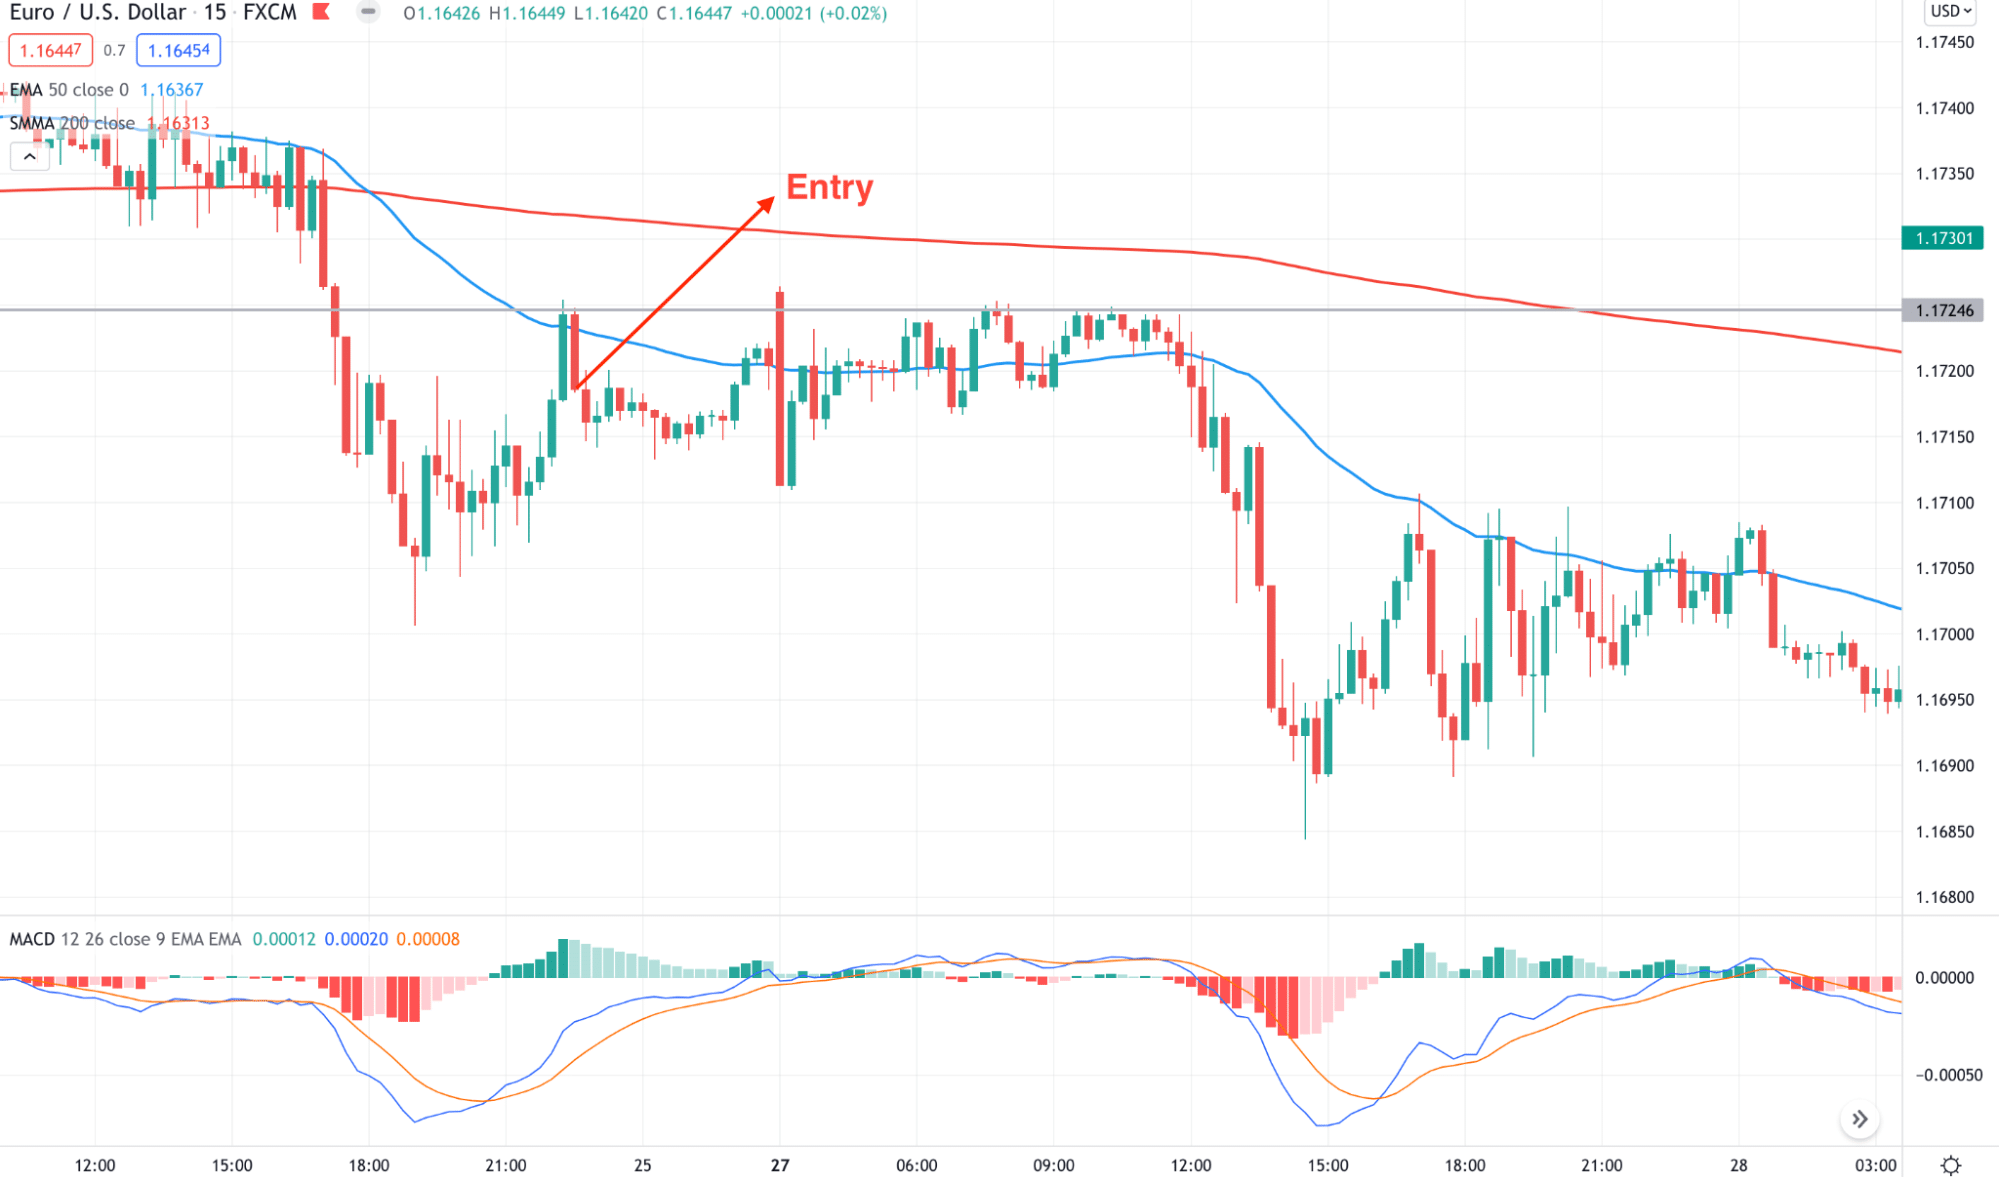
Bearish trade setup
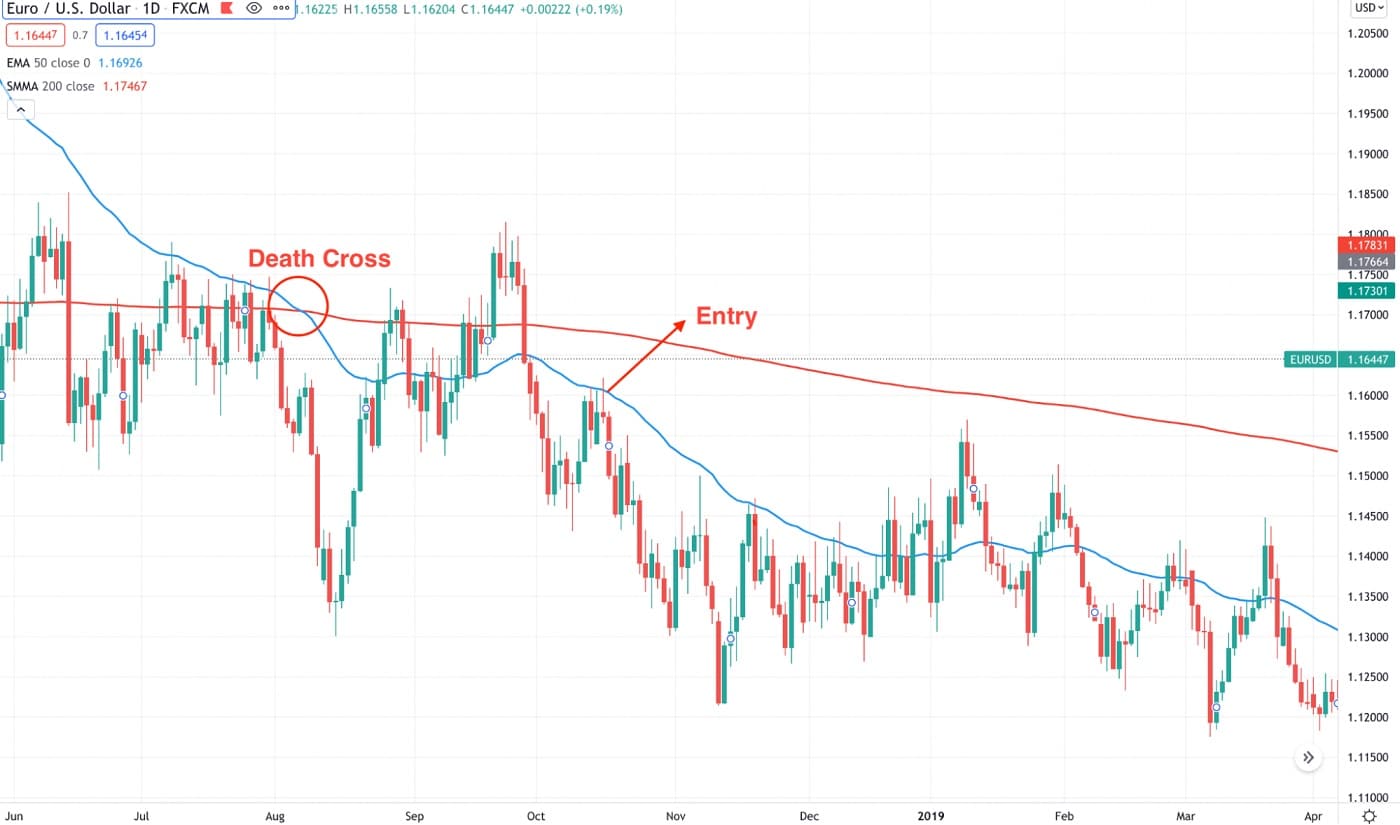
The bearish version of the golden cross or death cross happens where the 50 EMA should move below the 200 SMA while the price is below the 50 EMA. Make sure to find the following confirmations to open a death cross trading in the 15 minutes time frame:
- The overall market context is bearish.
- The 50 EMA crossed below the 200 SMA on a 15 minutes chart, and the price remained below the 50 SMA.
- Price reaches an important intraday event level and shows a bearish rejection candle.
- Meanwhile, the MACD histogram is bearish and aiming lower.
A long-term strategy
The long-term trading system uses the daily chart to use the price action of the last 50 days and 200 days. It provides more profitable trading opportunities than the short-term method.
Bullish trade setup
The buy trade is valid once the following conditions are present in the chart:
- The price is above the 50 days EMA.
- 50 EMA crosses above the 200 SMA.
- 50 EMA works as dynamic support to the price, so any bullish rejection from 50 SMA indicates a bullish trade.
- The aggressive stop-loss is below the rejection candle, and the conservative SL is below the 50 SMA.
Bearish trade setup
The death cross trading system in the daily chart is a process to open a sell position as soon as the 50 EMA moves down the 200 SMA with the following conditions:
- The price is below the 50 days EMA.
- 50 EMA crosses down the 200 SMA.
- 50 EMA works as dynamic support to the price, and a bearish rejection from 50 SMA appeared to confirm the entry.
- The aggressive stop-loss is below the rejection candle, and the conservative SL is below the 50 SMA.
Pros & cons
Let’s see the pros and cons of the golden cross trading system.
Pros
- Popular trend trading system that explains where the lower and higher time frame traders are heading.
- It is easy to combine the golden cross system with price action and trend.
- This method is applicable in lower and higher time frames.
Cons
- Moving average is a lagging indicator, so it needs additional confirmation while opening a trade.
- This method is not suitable for finding a reversal trade.
- It does not include the volatility and uncertainty of the market.
Final thoughts
Finally, we can say that the golden cross pattern is a profitable system to find the price direction. Therefore, whether you are a price action or indicator-based trader, you can easily compile this system with your trading strategy. Moreover, if you are new to forex trading, you can easily use this method as your primary trading system.