
The price chart in the financial market is like a book. If you can “read” it from left to right, you will understand how buyers and sellers are taking part.
So the price of a currency pair changes with the emotion of buyers and sellers. Therefore, it is known as a susceptible market. Any news of the financial disaster or economic uncertainty directly affects the forex, but why?
Because investors always try to avoid risks. Therefore, they alter trading decisions to keep themselves away from making losses. The interesting fact about the FX is that you can understand every footstep of investors by just reading the chart.
Is it possible?
Of course, it is possible to read the price chart using the MA, and there are many forex trading strategies based on it. So let’s have a look in detail.
Basics of moving average in forex
It shows the average price of the last number of candles that work as an essential trend identifier.
The MA of the last five candles would be = ( Sum ( Price, n ) ) / n, where n = period.
Based on the above calculation, MA 20 is the average price of the last 20 candles, where MA 100 is the average price of the previous 100 candles. There are many moving averages where the simple MA and the exponential MA are essential.
Although there are many types of MA, the main aim is to identify the average price. Therefore, it is essential to know why investors should need the average price. The answer is straightforward. Investors should know the average price to understand the market context.
The basic idea is that when the price moves above the MA line, the overall market sentiment will be bullish. Therefore, investors should focus on buying trades only. Similarly, if the price moves down to the MA, the view will change from bullish to bearish.
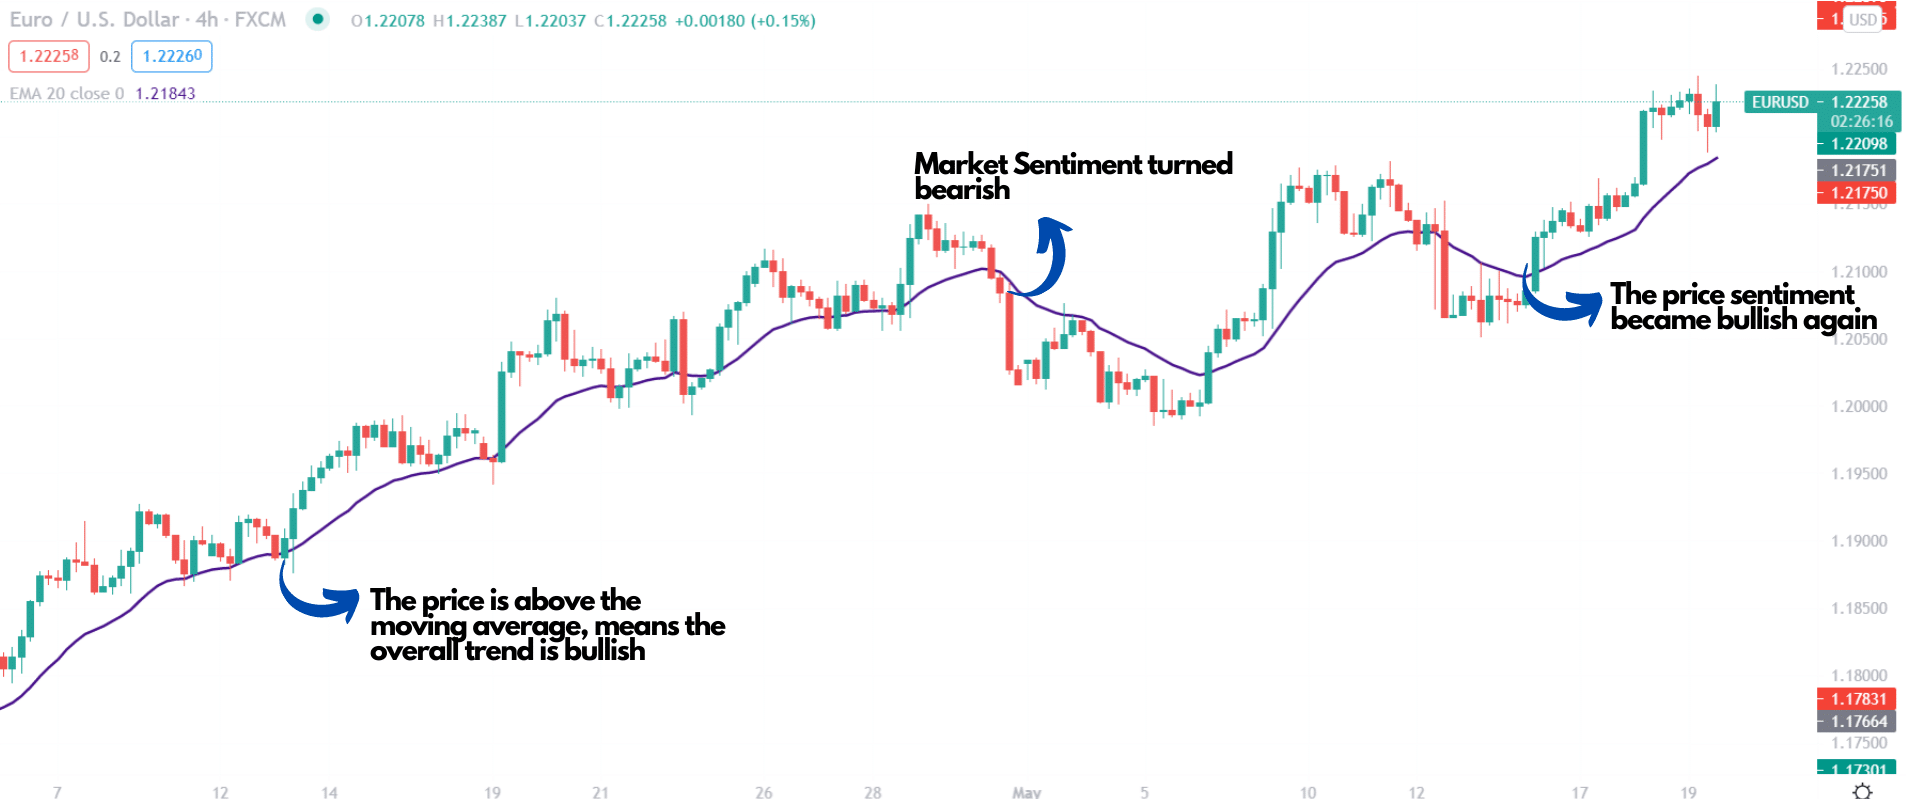
Here, we can see the H4 chart of EUR/USD, where the price trend is bullish, and MA worked as support. Moreover, the price moved lower and faced bearish pressure as soon as a candle closes below the MA.
Among other MA’s, the exponential MA (EMA) focuses on the most recent price that makes it essential for intraday trading. Moreover, the simple MA (SMA) effectively finds a long-term outlook on the market.
Best use of MA in forex
In the above section, we have seen what a trader should know about moving averages to be profitable in the industry. Now move to the core part of today’s learning — the chart reading techniques with moving averages.
Identify long-term trend
The long-term trend means long-term traders’ price direction. For example, traders and investors who trade in daily, weekly or monthly candles are long-term traders. Therefore, if you apply the moving average daily, weekly, or monthly candles, you can get the long-trend of price.
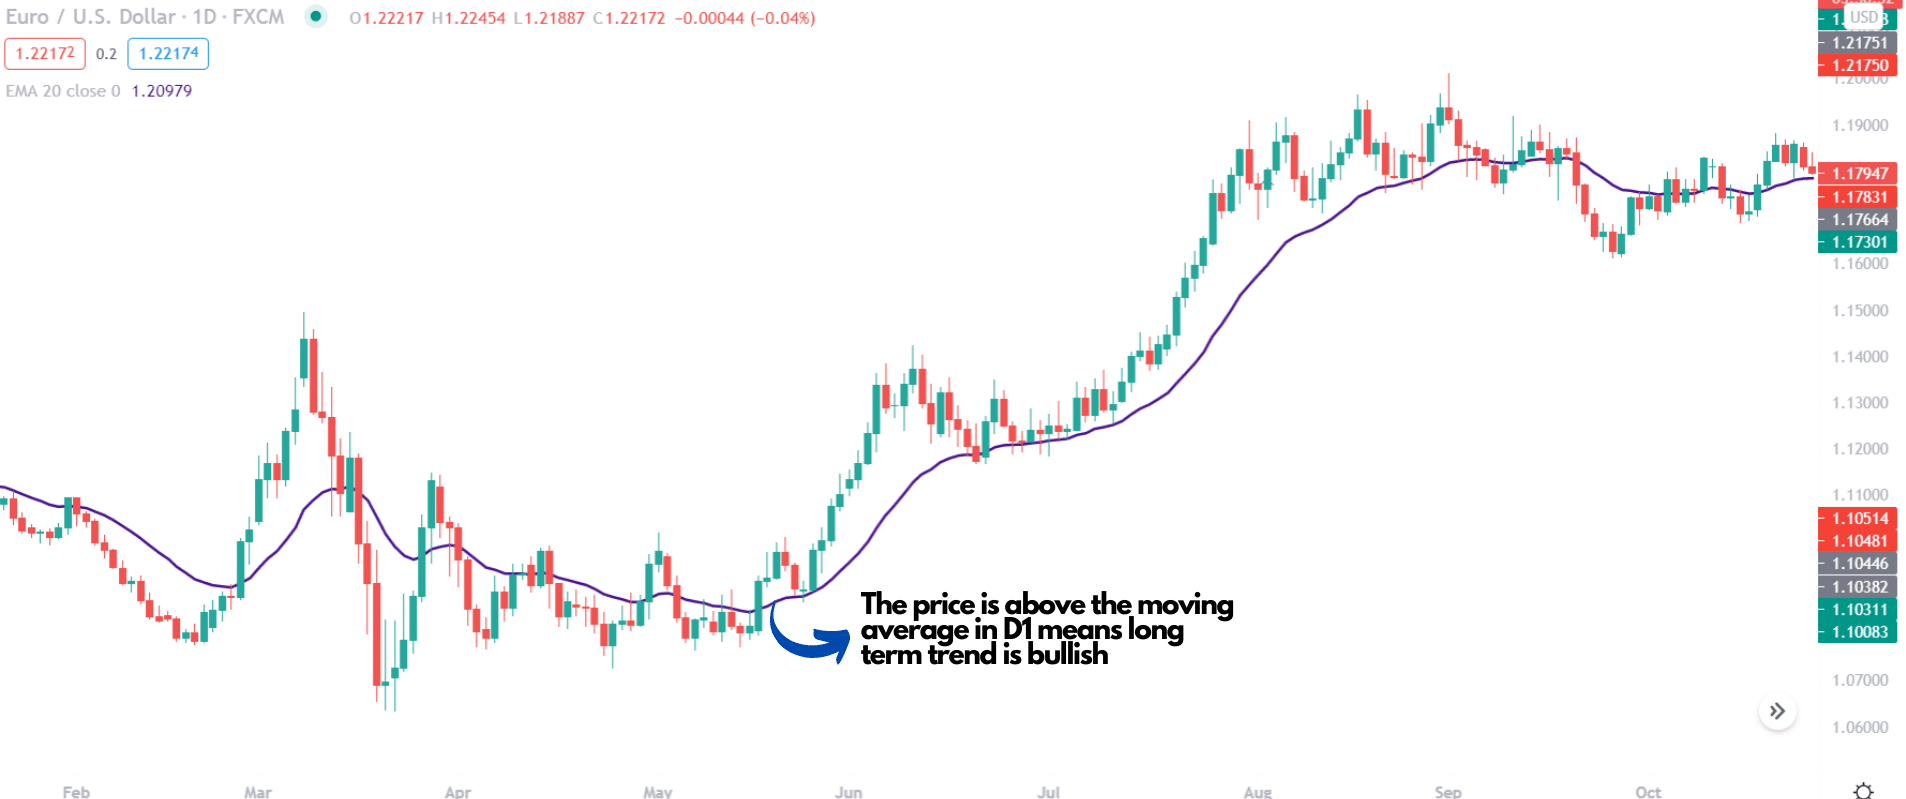
Here, we can see the example of the long-term trends in the daily chart of EUR/USD.
Another approach is to use a higher MA value. For example, if you use 200 SMA on the H4 chart, you will get the average price of the last 200 H4 candles. When the price is above the 200 SMA, you consider that the long-term trend is bullish and below the SMA as bearish.
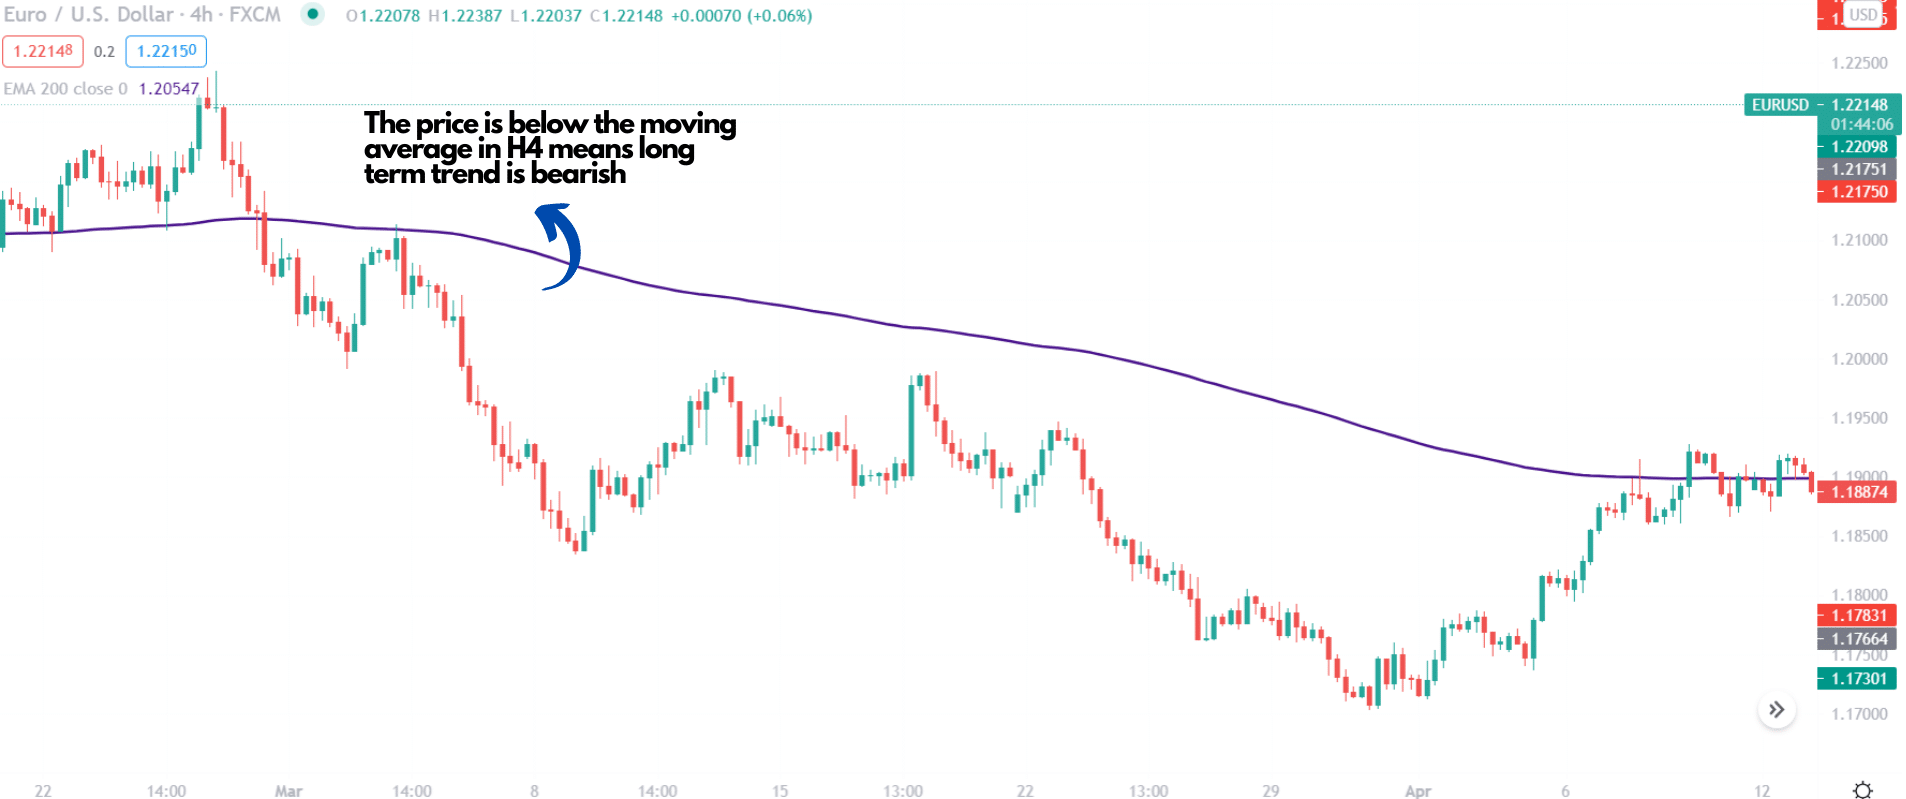
Here we can see the bearish market trend as the price remained below the 200 SMA.
Identify short-term trend
If you want to identify the intraday or short-term price trend, you can do it using a 20 EMA. Besides the static support and resistance, 20 EMA works as a dynamic support/resistance to the price that changes over time.
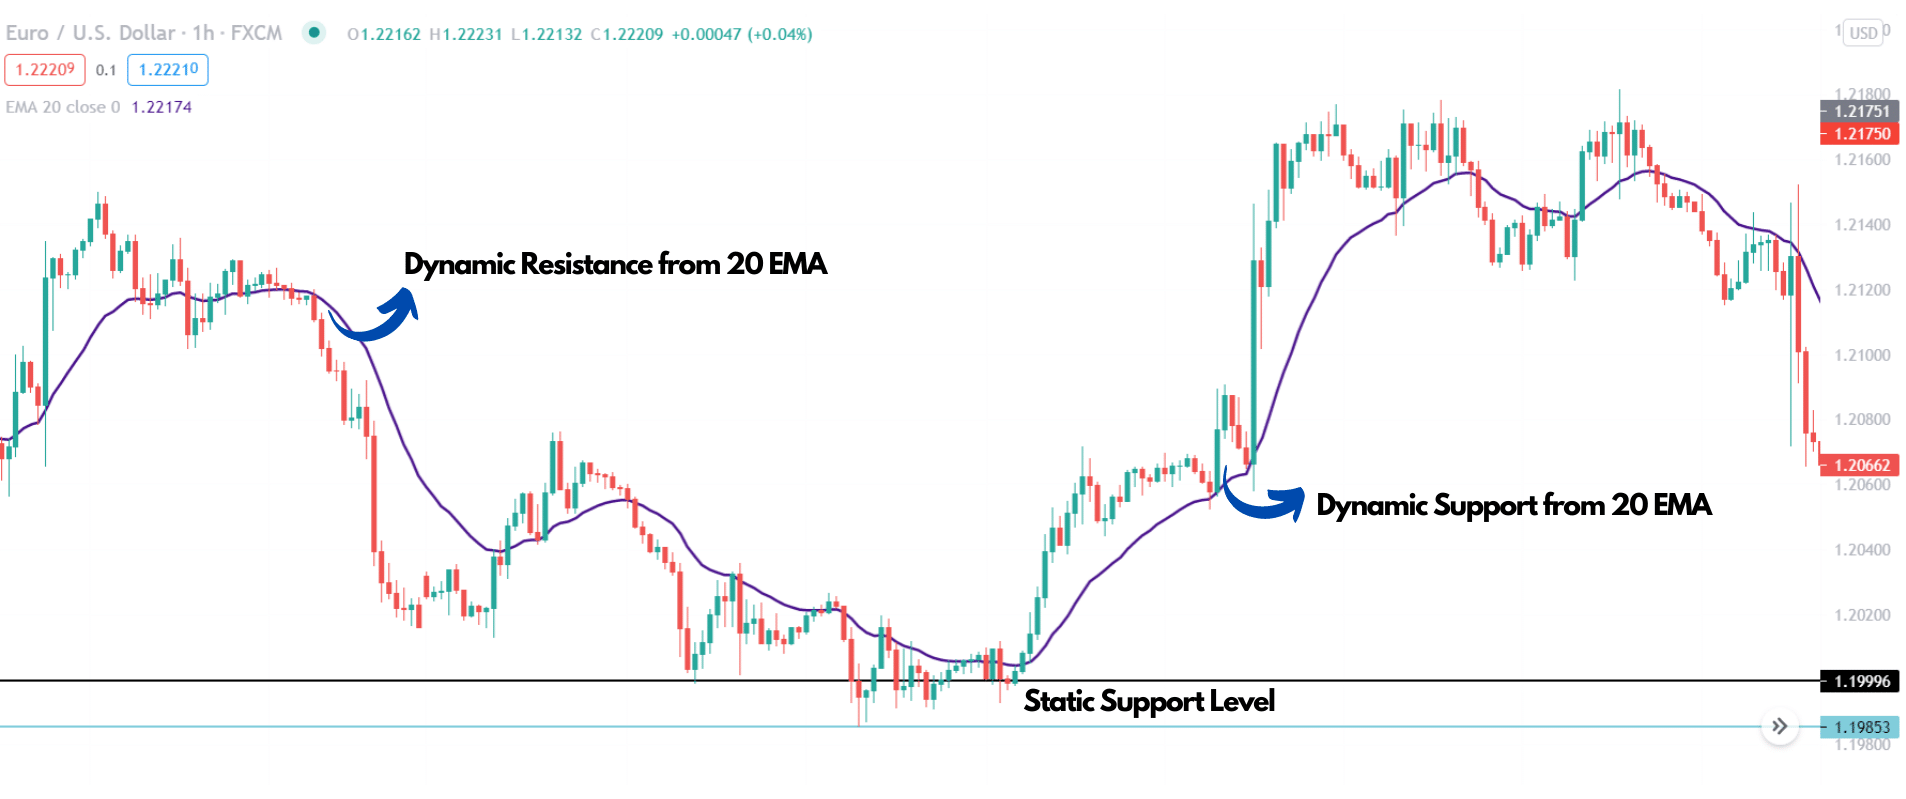
Here we can see how the dynamic 20 EMA worked as both support and resistance to the price and provided a trend direction.
Mean reversion
Another way to read the chart is by mean reversion. If the price moves higher or lower with aggressive pressure, the price and dynamic MA level will expand. Later on, they will come closer as mean reversion.
How to make trades based on mean reversion?
Taking trades based on mean reversion is tricky as it is a counter-trend movement. Therefore, you have to move higher time frames and see the price trend using MA 50 or MA 100. Only take a buy trade if the long-term trend is bullish and take sell trades if it is bearish.
At first, wait for the price to move higher or lower and find a bullish rejection candle for a bearish trade and a bearish rejection candle for a bullish trend.
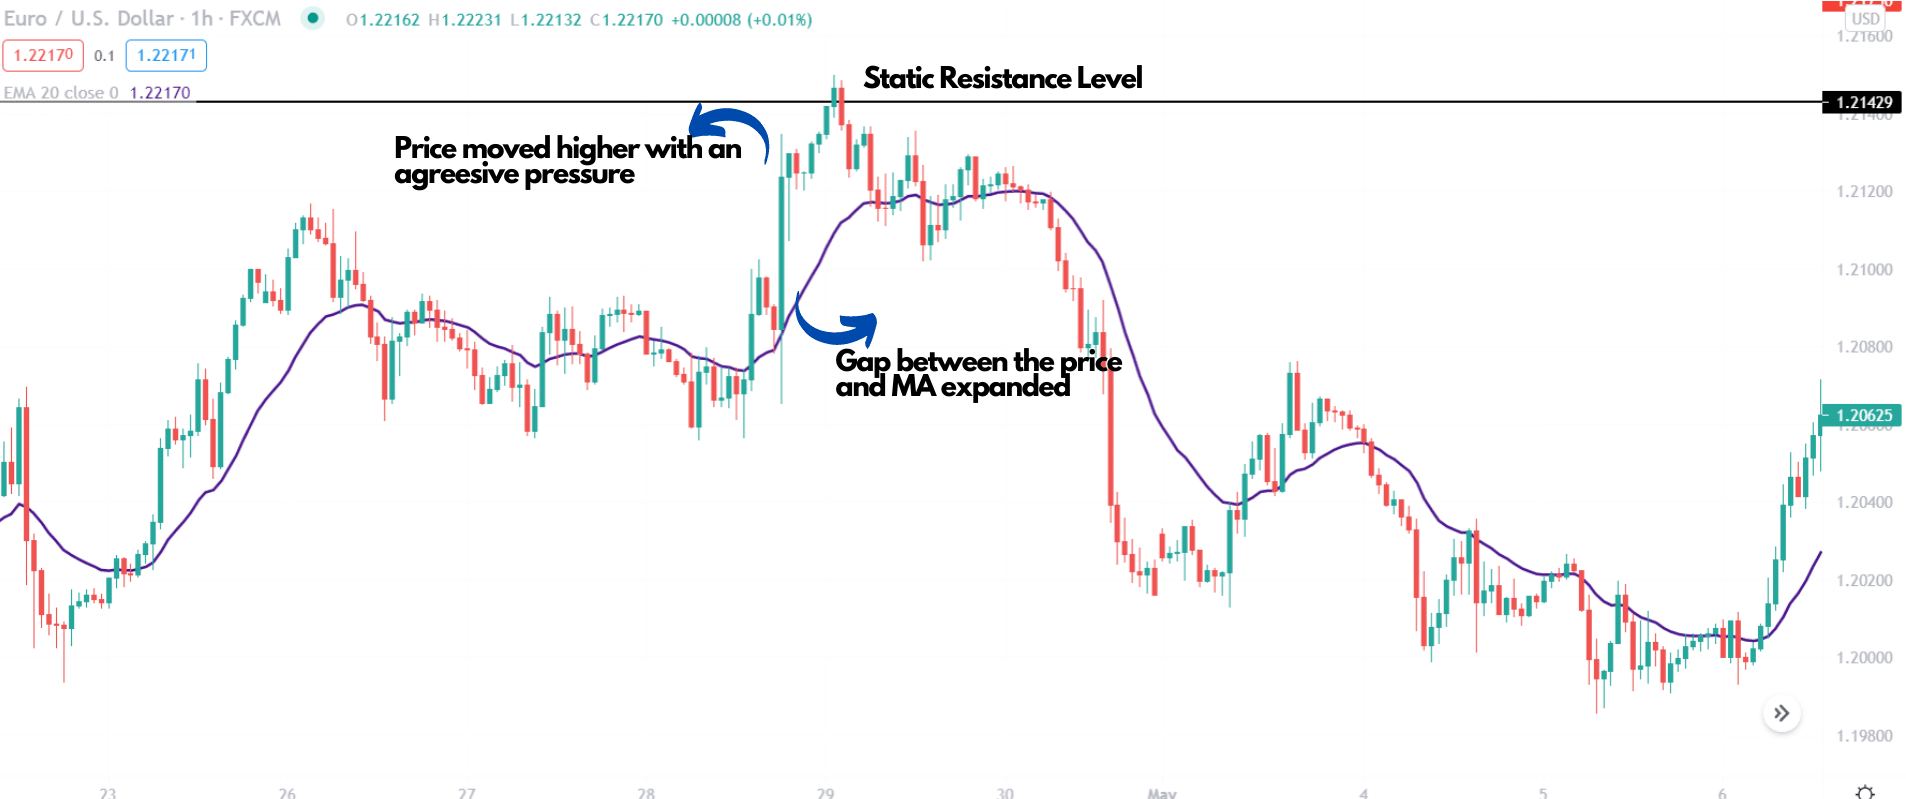
The above example shows that the price moved up with an impulsive bullish pressure where the gap between the price and dynamic 20 EMA expanded. Later on, the price came lower as a mean reversion besides the static resistance.
Identify price volatility
In the volatile market, the price will violate current swing levels. Therefore, it is often tricky for traders to follow the market trend in volatile market conditions. However, you can measure the price volatility using the MA.
Here we will use EMA with the value 20 to identify the price volatility. The process is straightforward, where you have to measure how the price is reacting with the MA. The price should remain close to the MA with multiple failures of breakout in the volatile market.
Here is the example.
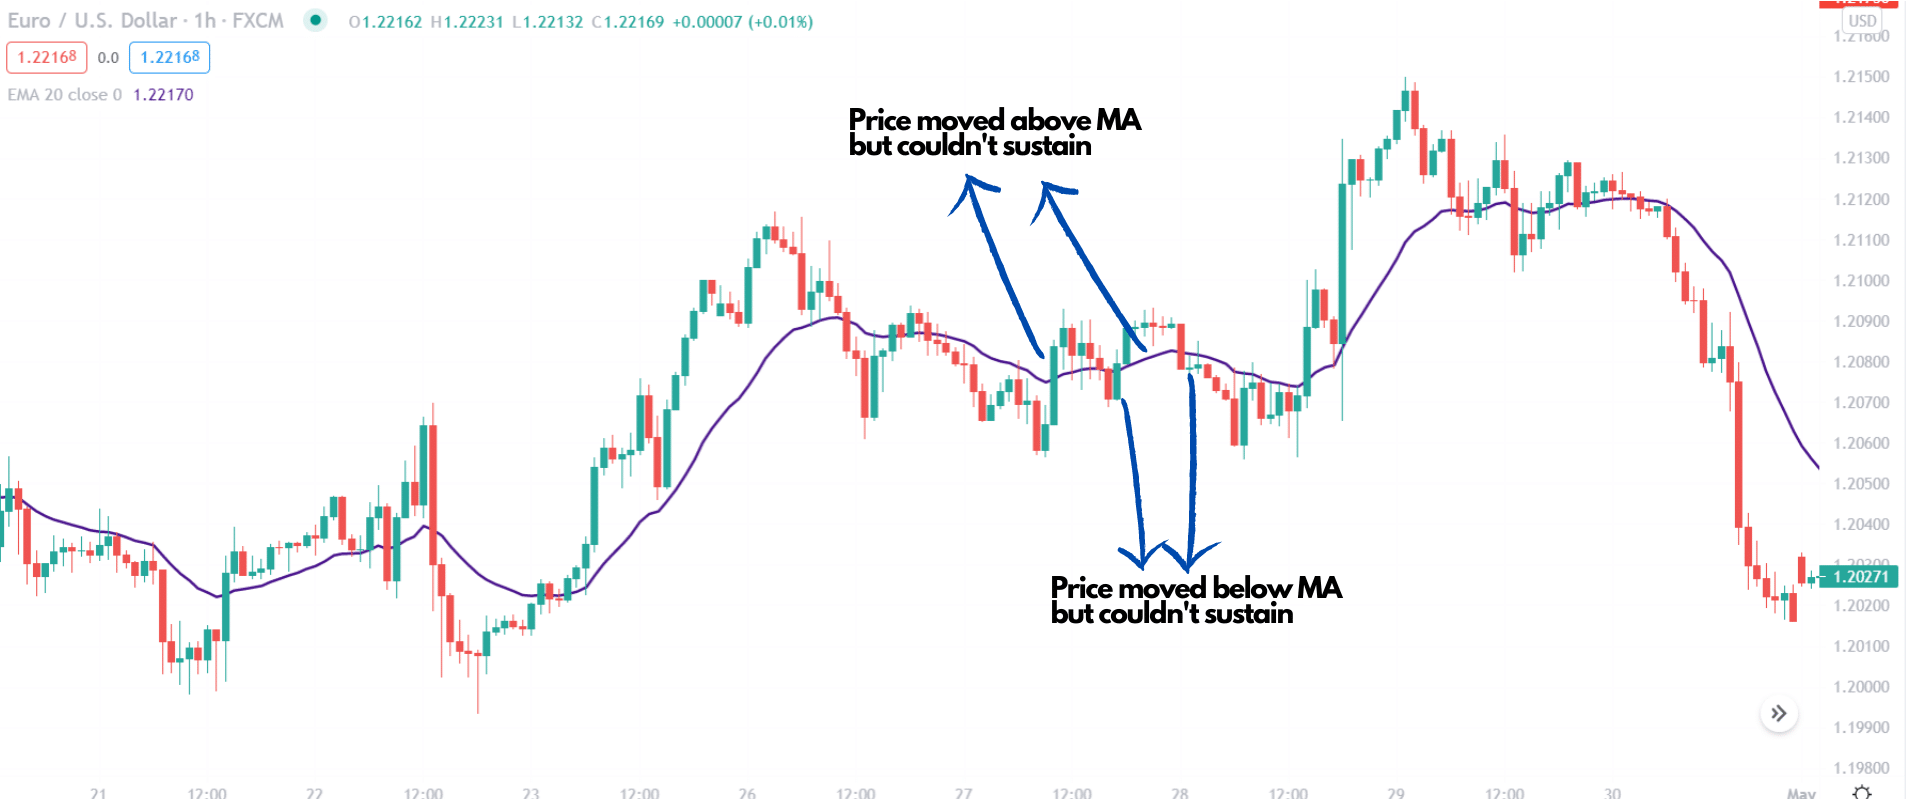
Here we can see that the price moved above the MA but failed to hold the momentum. Therefore, the price came lower below the MA but was unable to sustain, which is a sign of price volatility.
Conclusion: best use of MA
In the above section, we have seen four ways to read the chart using MA’s. Besides the above example, there are more ways to use the MA in the price chart but based on the accuracy.
We will see the best moving average values for the above use:
- Identify long-term trend: simple MA — value 200
- Identify short-term trend: exponential MA — value 50
- Mean reversion: exponential MA — value 20
- Identify price volatility: exponential MA — value 20
Lastly, make sure to implement a proper trade management system to get the maximum benefit. Do not take many risks per trade and do a lot of practice before moving with the real money.