
Candlestick patterns are an unavoidable part of the financial market. Technical analysts are permanently prior candlestick formations to obtain the market context besides determining trading positions. So undoubtedly, traders who understand the market context through candlestick formations can catch trades with more potential. Financial traders consider the Adam and Eve patterns among the most effective chart patterns group.
However, seeking trading opportunities using any candlestick pattern requires learning the entire formations and functionalities to obtain the best results. This article will introduce the Adam and Eve patterns besides explaining identifying procedures and successful trading methods with chart attachments.
What are Adam and Eve patterns?
The Adam and Eve patterns are multi candle formations during the price movement of any financial instrument signaling an upcoming reversal. Thomas Bulkowski’s Encyclopedia Of Chart Patterns contains brief descriptions of these chart patterns, usually two types: Adam and Eve top and Adam and Eve bottom.
Adam and Eve top
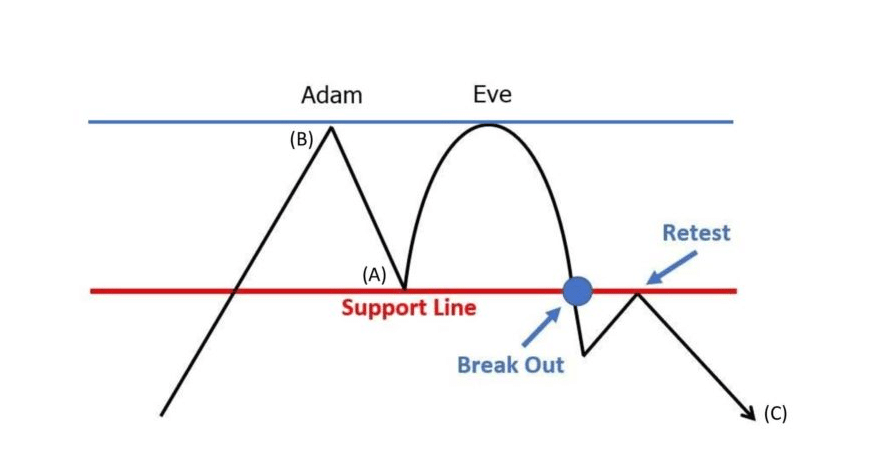
After a sharp bullish price movement, Adam and Eve’s top usually appears near resistance levels. There is an inverted “V” shape at the initial stage, then the price declines a bit to a neckline and again rises and creates an inverted “U” shape. The inverted “V” is the adam, and the “U” is the eve. Together it is considered the Adam and Eve top pattern.
Adam and Eve bottom
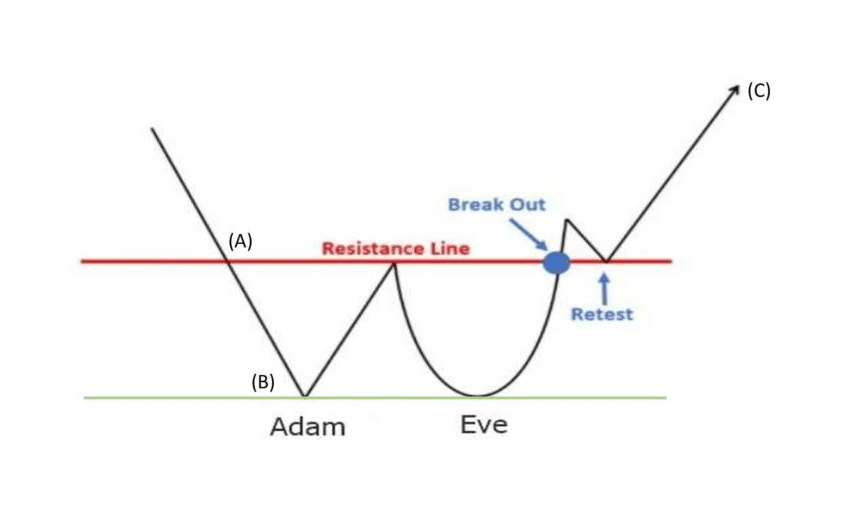
It occurs after a sharp downtrend. The initial step creates a “V” shape, the Adam part. Then the price surges upwards to a neckline and then makes a round “U” shape which is the eve part. Together it’s an Adam and Eve bottom pattern.
In both cases, some divergence in Adam and Eve range is allowable. The price movement always doesn’t create ideal pattern formations. The eve top can have a bit of a downside than the adam top in Adam and Eve top. Again, the low of the eve part can be a little upside than the adam low in Adam and Eve bottom pattern.
How to identify and trade using Adam and Eve patterns?
You already know the formation of the Adam and Eve patterns. The most potent of these patterns are at different phases of price movements. The Adam and Eve top is most potent near any resistance level, and the Adam and Eve bottom is most potent near any support level. After completing the pattern, these patterns generate trading signals when the price breaks above or below the neckline. Traders often use technical indicators or tools to determine entry/exit positions and more accurate trading signals.
A short-term strategy
In this short-term trading method, we use the RSI and the volume indicators to confirm the breakout on Adam and Eve patterns. Then determine trading positions by combining all those info and pattern formations. This strategy suits any timeframe; the 15-min chart is preferable to generate short-term trade ideas.
Bullish trade setup
Spot an Adam and Eve bottom pattern near any support level. When the price breaks above the neckline, observe indicators readings when:
- The volume indicator declares an increasing buy volume.
- The RSI line is above the central (50) line heading more upside.
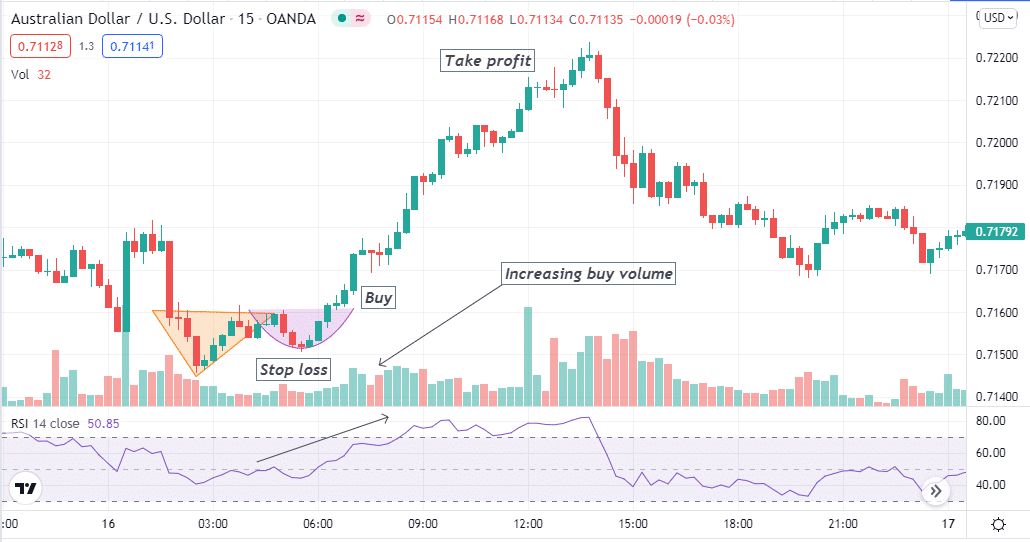
Entry
Match these conditions above and place a buy order.
Stop loss
The reasonable stop loss level will be below the current swing low.
Take profit
Continue the buy position till the bullish momentum remains intact. Close the buy position when the price starts to decline, sell volume increases, and the RSI line moves downward after reaching the upper (70) level.
Bearish trade setup
Spot an Adam and Eve top pattern near any resistance level. When the price breaks below the neckline, observe indicators readings when:
- The volume indicator declares an increasing sell volume.
- The RSI line is below the central (50) line heading to the downside.
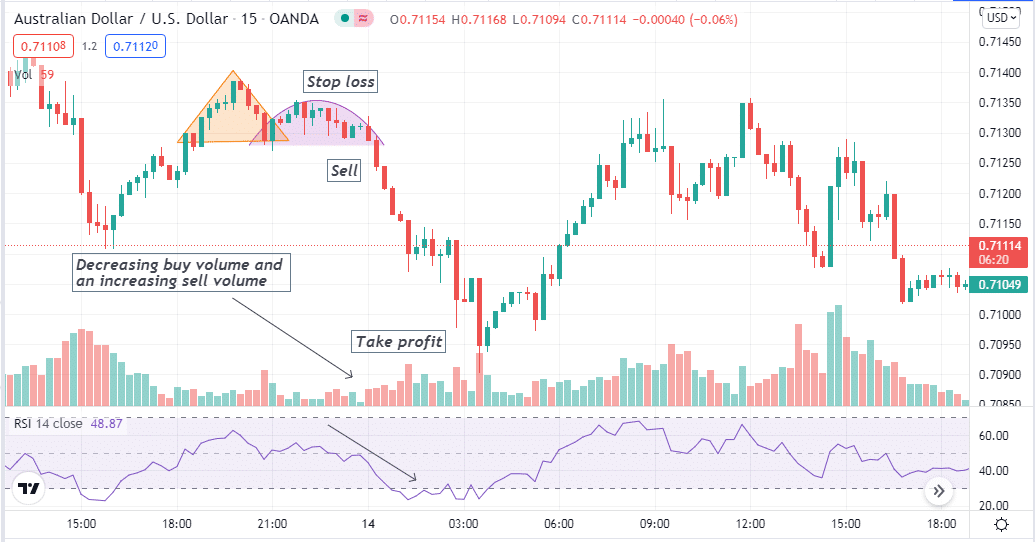
Entry
Match these conditions above and place a sell order.
Stop loss
The reasonable stop loss level will be above the current swing high.
Take profit
Continue the sell position till the bearish momentum remains intact. Close the sell position when the price starts to surge upwards, buy volume increases, and the RSI line moves upward after reaching the lower (30) level.
A long-term strategy
We use the MACD and EMA crossover alongside chart patterns in this trading method. We use EMA 50 (red) and EMA 200 (blue). When the red EMA crosses above the blue EMA line, a golden crossover in a daily chart declares a bullish pressure on the asset price.
Meanwhile, the exact opposite crossover is a death crossover that declares declining pressure on the asset price. The daily chart is most suitable for this trading method to catch potential long-term trades.
Bullish trade setup
Spot an Adam and Eve bottom pattern near any support level when the price crosses above the neckline, then observe indicator readings:
- Golden crossover occurs between those EMA lines.
- The dynamic blue line crosses above the dynamic red line on the MACD window.
- MACD green histogram bars appear above the central line.
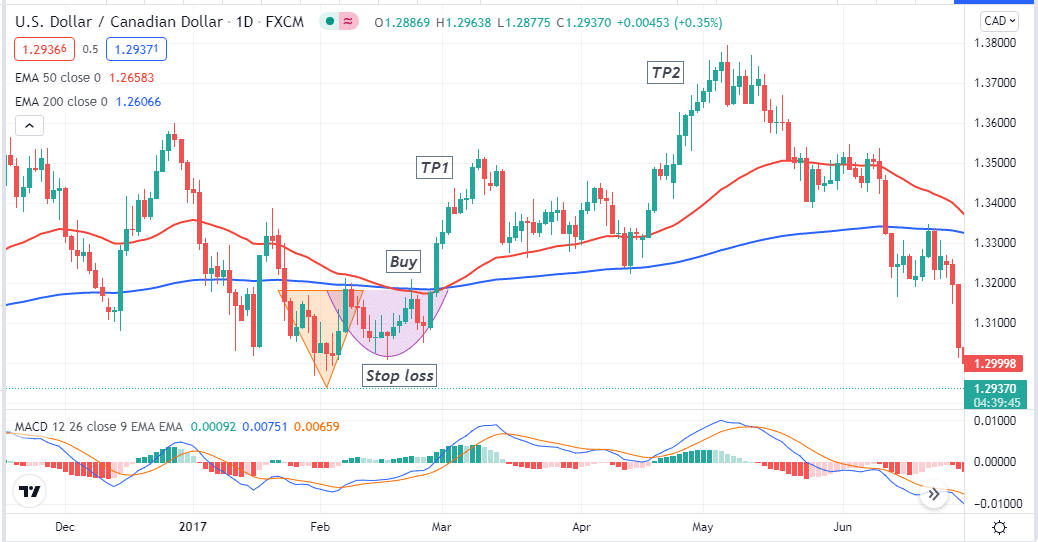
Entry
Match these conditions above and place a buy order.
Stop loss
The reasonable stop loss level for your buy order will be below the current swing low.
Take profit
Close the buy position when bullish momentum ends. When the dynamic blue line crosses below the dynamic red line on the MACD window, and MACD red histogram bars take place below the central line, close the buy order.
Bearish trade setup
Spot an Adam and Eve top pattern near any resistance level when the price crosses below the neckline, then observe indicator readings:
- Death crossover occurs between those EMA lines.
- The dynamic blue line crosses below the dynamic red line on the MACD window.
- MACD red histogram bars appear below the central line.
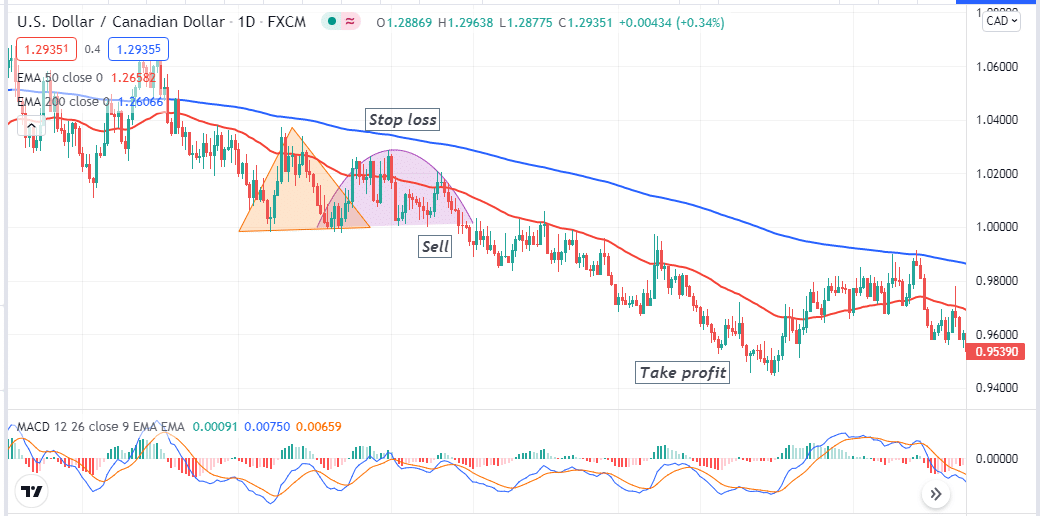
Entry
Match these conditions above and place a sell order.
Stop loss
The reasonable stop loss level for your sell order will be above the current swing high.
Take profit
Close the sell position when bearish momentum ends. When the dynamic blue line crosses above the dynamic red line on the MACD window, and MACD green histogram bars take place above the central line, close the sell order.
Pros & cons
| Pros | Cons |
| These patterns apply to many trading assets. | These patterns can fail due to fundamental reasons. |
| The figures have satisfactory results in successful trading. | They don’t suggest complete trade setups. |
| These patterns suggest trades that support price action concepts. | It requires using other technical tools and indicators to trade using these patterns. |
Final thought
Adam and Eve’s patterns are among the most effective candlestick patterns in the financial market. We suggest applying money and trade management concepts to risk management while trading these patterns. Moreover, checking on fundamental events before opening any trading position will reduce risks on trading and increase profitability.