
Trading the currency market is one of the most exciting ventures you can embark on. Just think about what life awaits you if you manage to conquer this field. You could gain time and financial freedom if that happens. It takes one successful trading strategy to make this a reality.
That is why people come in droves to currency trading, seeing the splendid reward that lies ahead for the lucky souls. The hard reality, though, is that most folks lose money. Despite this truth, some of these folks get back to trading to try again, hoping they could unlock the secret to profitability one day.
Why does pattern trading work?
There are many ways to trade the currency market. You can use either fundamental or technical analysis. Technical analysis alone comes in various flavors, the most popular being price action trading. In turn, price action trading has many subsets, one of which is pattern trading.
Why do price patterns such as head & shoulders, wedges, AB=CD, Wolfe wave, and others work? Sure, they do not work all the time. You can lose your capital if you are not careful with pattern trading. Still, many traders use them. What is it in this type of trading that traders find attractive?
What makes price patterns unique is that they give you an idea of what type of trade to expect when they form on the chart. For instance, if you see a rising wedge, you will seek to find a sell entry rather than a buy entry. If you cannot find an entry, you pass up on the opportunity instead of trading long.
Prediction is key
Of course, certainty does not exist in trading. What is essential in currency trading is being able to predict the next market movement. However, the experience can tell you that something often happens when you see a specific market scenario. For example, if you notice that an indicator gives you an oversold signal while a market is an uptrend, that is a good time to take a long position.
Therefore, you must find a trading method that allows you to predict where the market will go next. Knowing that the market is bearish after it made a big sell-off and reached an oversold condition is helpful information. However, when that happens, looking for a sell entry does not make any sense. This is where indicators known as currency meters are not helpful.
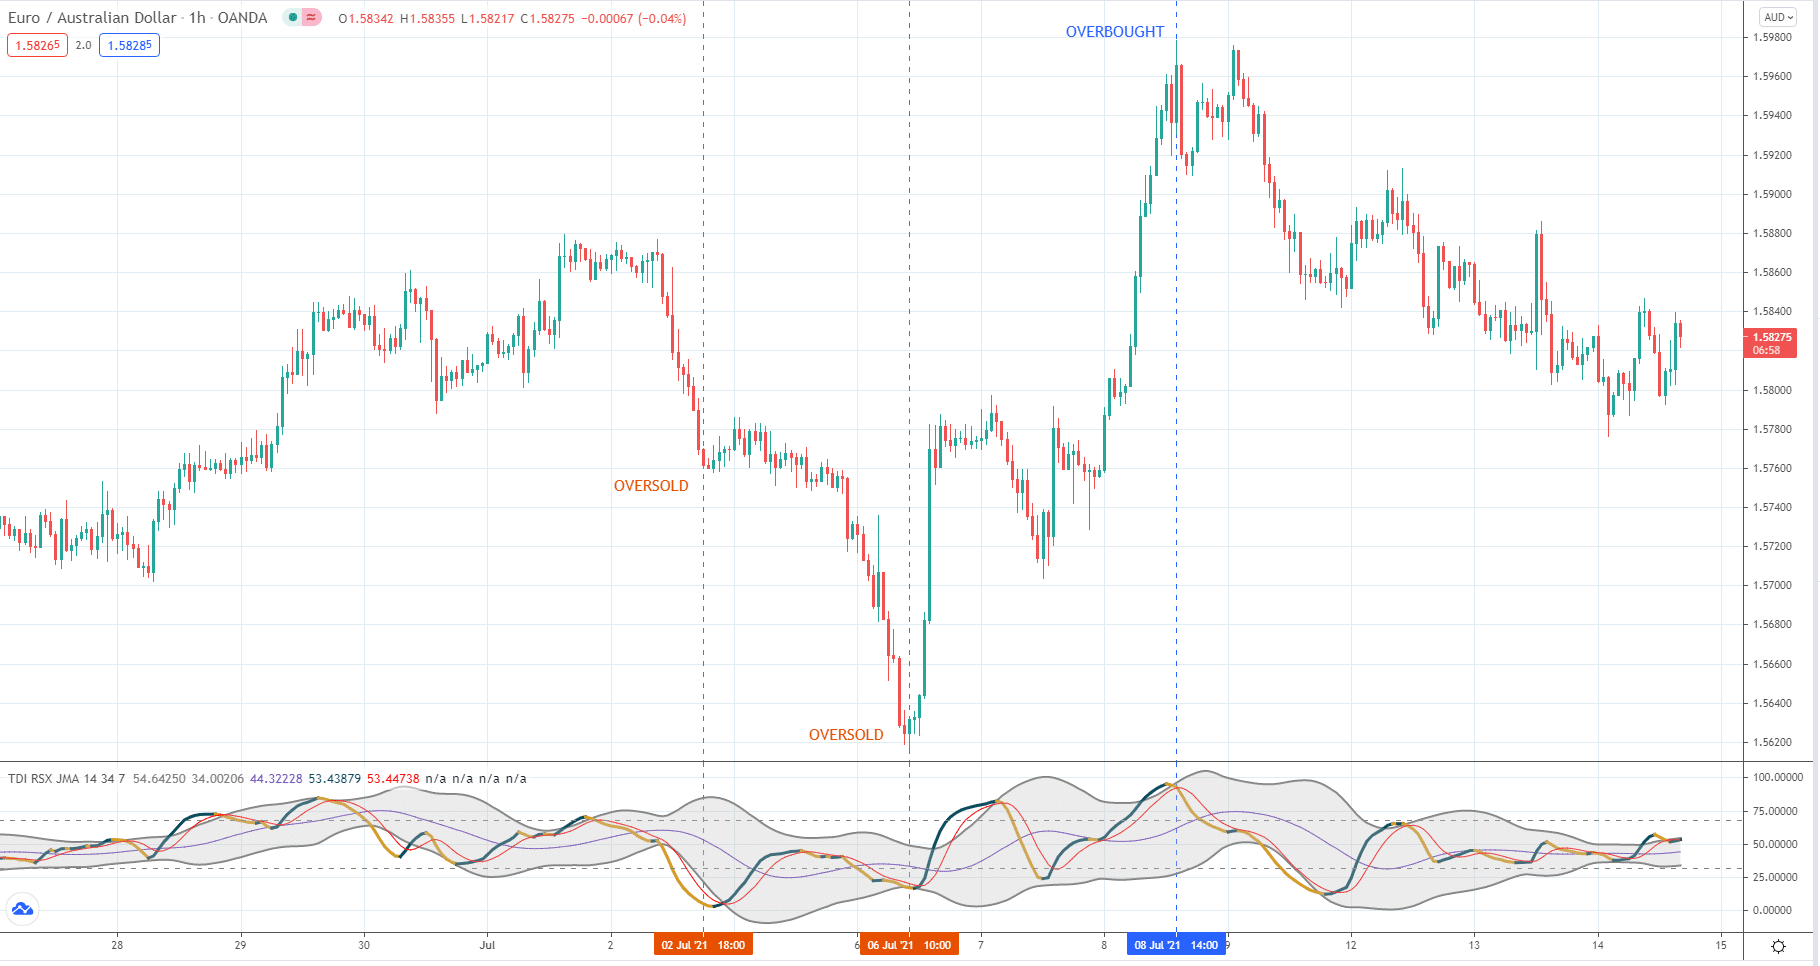
Consider the above EUR/AUD hourly chart. It shows two occasions when the traders’ dynamic index (TDI) is oversold and one situation when it is overbought.
- During oversold conditions, currency meters would indicate a strong sell because the price moved dramatically lower.
- When the market is overbought, they will show a strong buy. When you use these tools to enter trades, you are in for a surprise when the market moves the other way just when you trade in that direction.
In this article, you will learn one concept about the trend. This will allow you to find the current trend and trade in this direction all the time. You might have learned this idea somewhere, but perhaps it did not sink in. Here you will hear it once again. We hope this time it will make a more lasting impression on you.
Finding the real trend
The best trading strategy is always to trade with the trend. This idea is so simple, and it could simplify your trading. However, every trader has his interpretation of the trend. You may have your interpretation as well. To give you an objective way of understanding the trend, we will share our way of looking at the trend.
Just open any chart of any symbol. Go to the daily time frame and apply the 100 EMA and 200 EMA. Do not look at the relationship of price and the moving averages (MA). Typically, we consider a market bullish if the price is above long-term MAs and think of it as bearish if the price is below long-term MAs.
Focus on the moving averages
To find the current trend, focus on the two MAs. Is 100 EMA above 200 EMA? If so, the trend is bullish. If 100 EMA is below 200 EMA, then the trend is bearish. Even if price chops around and occasionally goes below the MAs, for example, as long as 100 EMA is above 200 EMA, maintain your bullish bias.
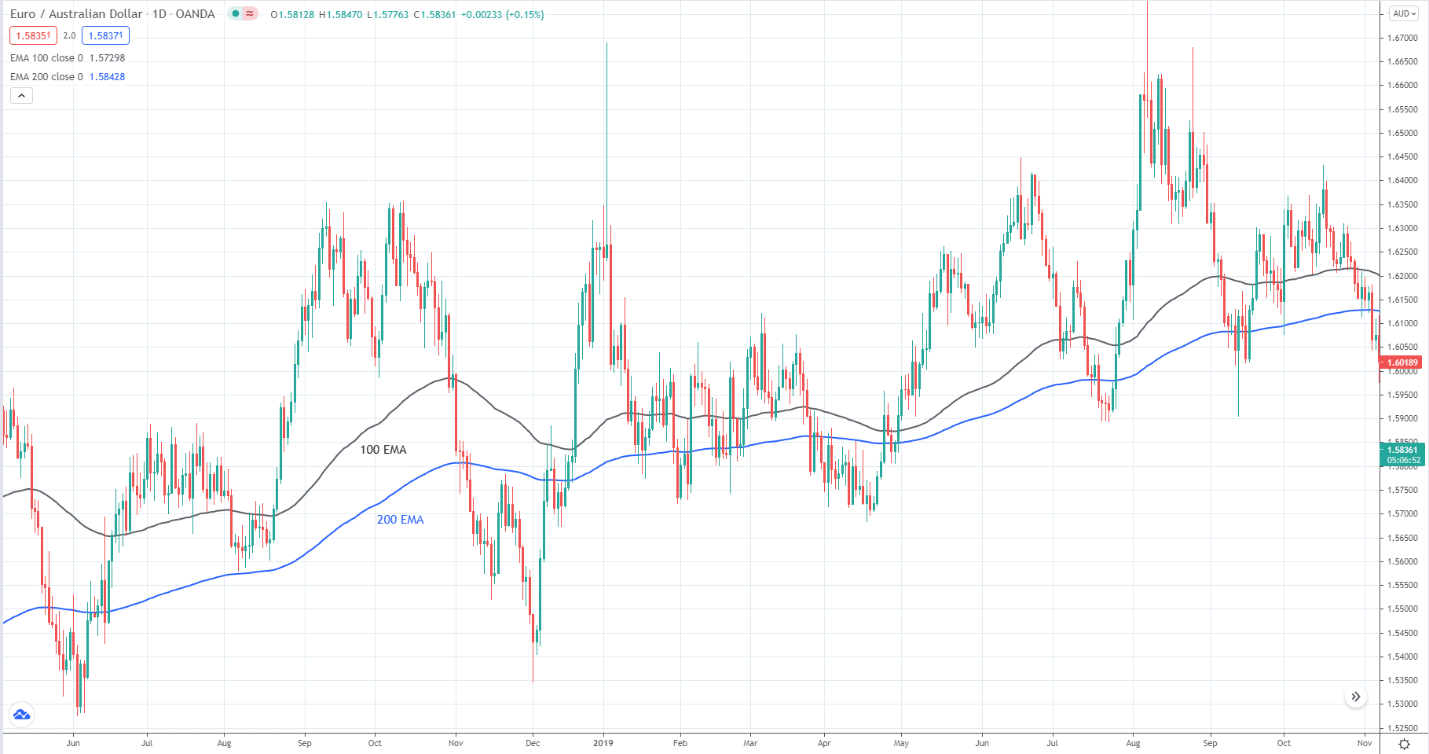
Let us see an example to illustrate the concept better. The above graphic shows the daily EUR/AUD chart with the 100 and 200 EMAs plotted. On several occasions, price penetrated and plunged below the MAs, but the uptrend continued. Therefore, you can maintain your bullish bias as long as the shorter MA is above, the longer MA, and the two moving averages keep a distance from one another.
Once you learn and understand this concept, you can reconfigure your trading method to align with this idea if you are using multiple time frame analyses when trading is hunting, keeping the daily trend in mind, and finding trade setups in this direction. This method of analyzing the movement could greatly simplify your market analysis. Frequently, over-analysis is counterproductive to traders.
What it takes to reverse the trend
We all know that a trend can persist for a long time, so market mavens counsel us to trade with it. However, we also know very well that a trend has an end. How can we tell that the current trend has ended? The answer is simple, that is, if the 100 EMA and 200 EMA switch places.
A related question might come up. What does it take to switch the positions of these two moving averages and confirm the trend change? Here is the answer. The market must make a big, decisive move in the opposite direction to change the trend. You can see this market action over and over again on your charts, in any time frame.
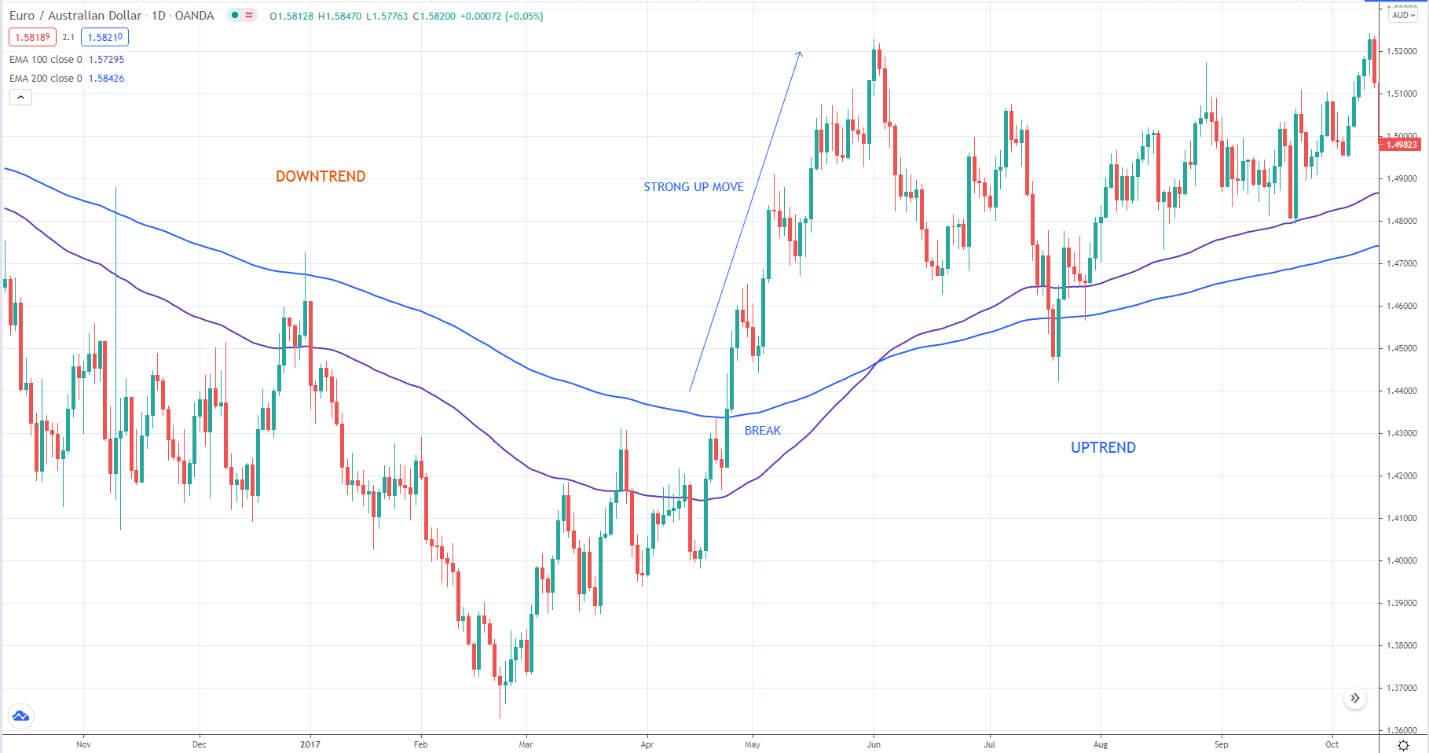
As you can see in the above EUR/AUD daily chart. The downtrend changed to an uptrend after the price made a solid move to the upside. Typically, a break of the two moving averages presages this trend change. After the strong upside breakout, the two MAs crossed the other way, confirming the new uptrend.
Final thoughts
While predicting the next market movement is not an easy task, you should spend time on it. Prediction holds the key to market riches. It would help if you had an idea where the price will likely go next. Then you can develop a plan to trade in that direction. Corollary to this is the concept of trend. It would help if you assumed the price would go in the trend direction until it tells you otherwise. This is where the 100 EMA and 200 EMA combination comes into play.