
OBV or on-balance volume indicator is a trading tool that shows the change in volume for a crypto asset and helps anticipate the price movement. Besides, this tool is effective in any crypto asset, and market participants can easily combine it with other tools.
Taking trades from OBV includes higher accuracy rates only when traders utilize it effectively. The following section is interested in learning the trading system using this indicator. Here we will discuss the core concept of OBV, including the exact buying and selling method using it.
What is the on-balance volume indicator?
The core idea of OBV is to anticipate the price movement of a crypto asset using the change in volume for a particular time. This trading tool uses the volume on up days and down days and gauges the possible buying or selling pressure for a particular time.
According to the OBV precondition:
- If the asset price is above the previous trading day, it considers the volume “up-volume.”
- If the asset price remains below the last trading days territory, we can feel it as a “down-volume.”
This tool works as an exchange volume, like other trading indicators.
The founder of the MBV metric is Joseph Granville, who considers the tool as an important method that is used to know how financial markets work. The founder thinks that the price of a trading instrument may show a strong movement when there is a large number of volume changes. The OBV indicator can quickly determine the price change with the calculator of today’s and previous days trading behavior:
For the bearish context, the price should be below the previous day’s price, where the OBV should be as follows:
OBV = Previous OBV – Current Day’s Volume
Now, if the price of today and previous days remain almost the same when can calculate the OBV using the following formula:
OBV = Previous OBV
The same concept applies to the bullish market where:
OBV = Current Day’s Volume + Previous OBV
How to identify the price trend using the on-balance volume?
Considering the OBV indicator as the ultimate solution for your financial trading career is not wise. The indicator is an effective tool to determine the trend of a trading instrument. The first approach is to find the market trend using the OBV. Later on, make sure to find the price on a favorable zone based on the support/resistance area.
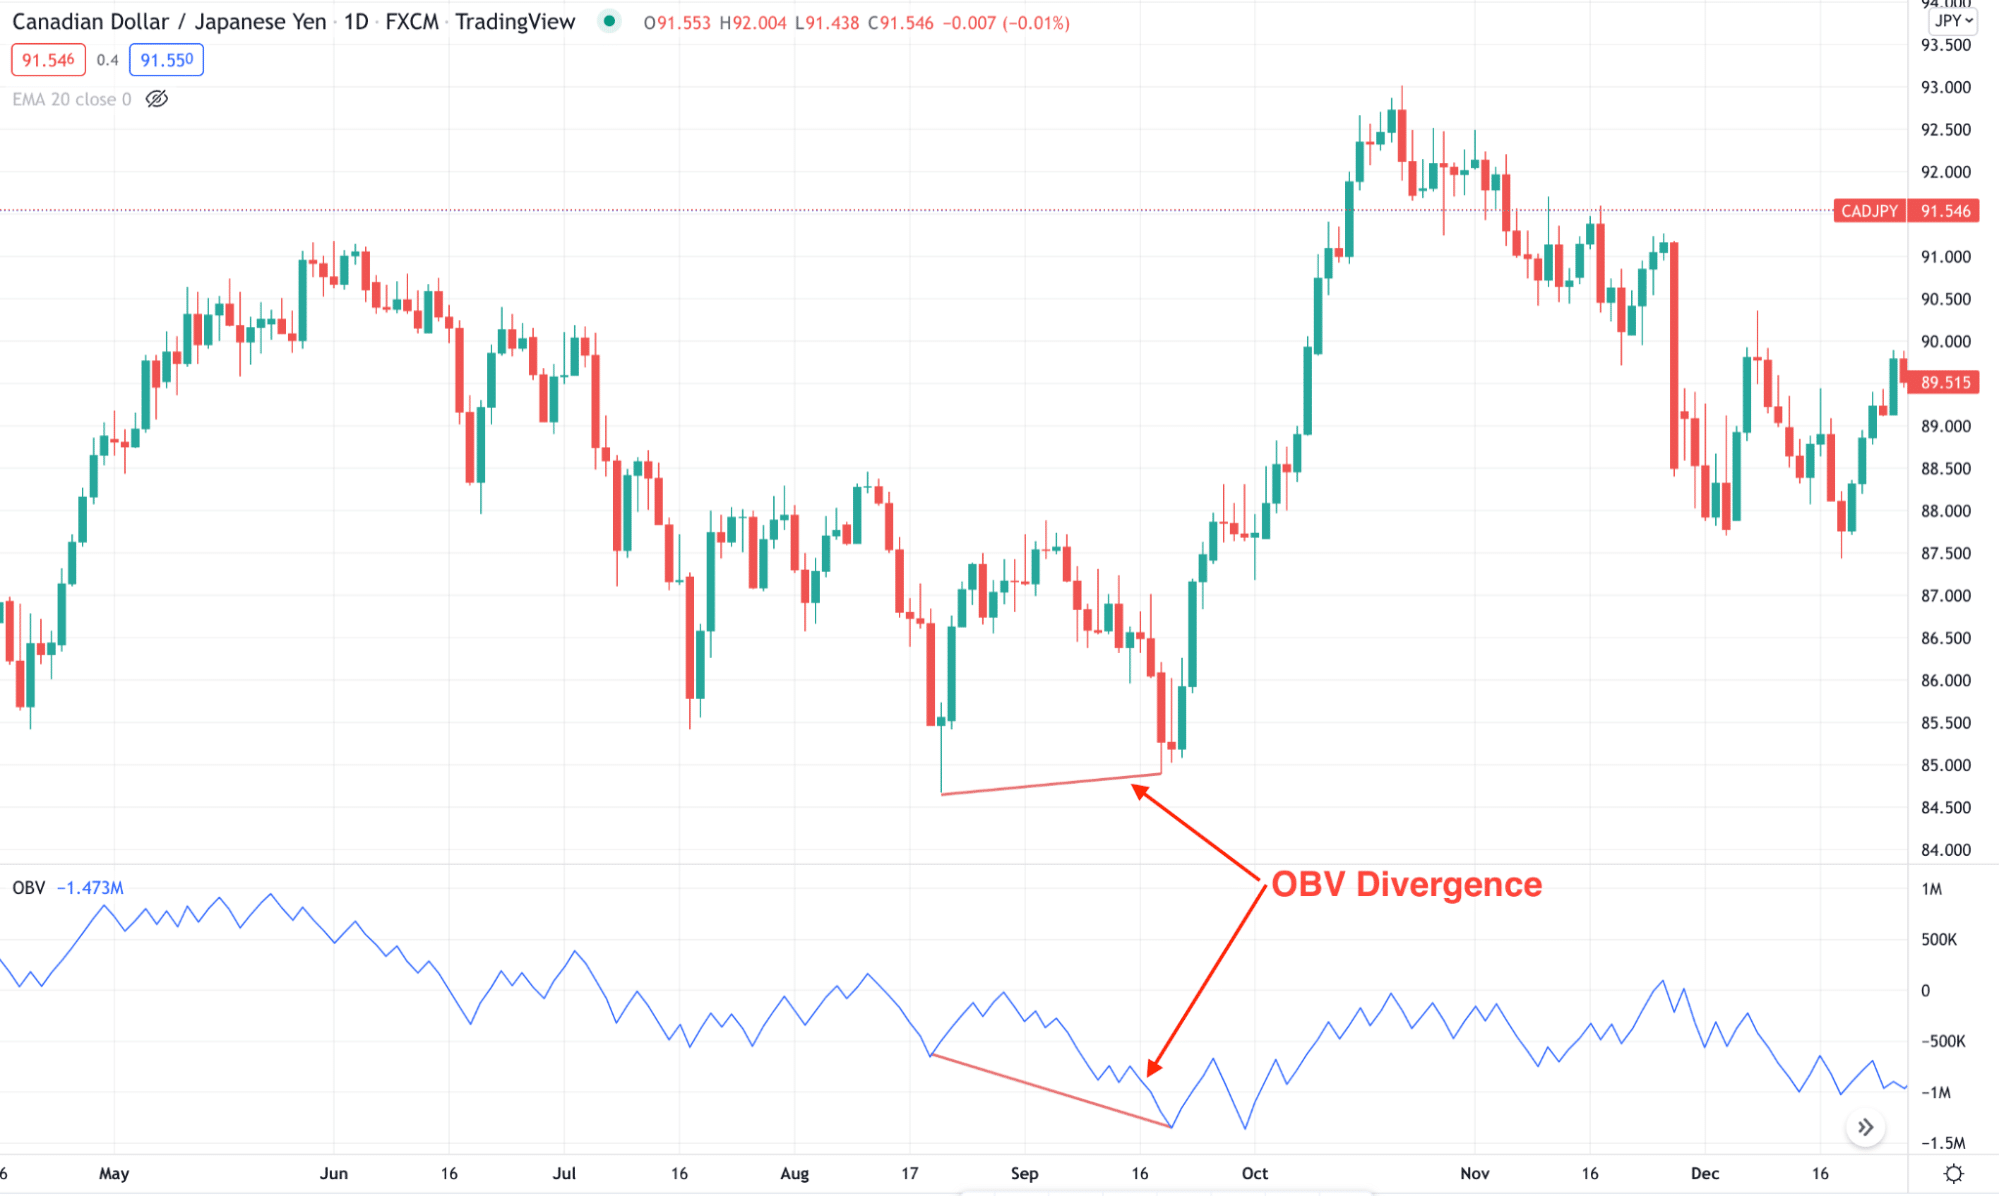
If the OBV lines show a breakout on support/resistance levels, it signals a buy or a sell position. On the other hand, the trend reversal in buying or selling may come from the divergence signal. If the price shows a direction but the volume shows another sentiment, we can call it a divergence. Any sign of divergence from a significant price level is a potential reversal signal.
The bearish divergence comes when the OBV moves lower, but the price remains bullish. Conversely, the bullish divergence comes when the OBV moves higher, but the price remains lower. Investors should ensure that the OBV alone is not enough to provide a reliable price direction in both cases. It needs additional signals from other indicators like MACD, RSI, or Stochastic oscillator.
A short-term strategy
The short-term approach is to identify the price direction based on the OBV indicator. This method applies to any trading instrument from FX, stocks, indices, or cryptos. However, investors should use the additional indicator to confirm this method.
Bullish trade setup
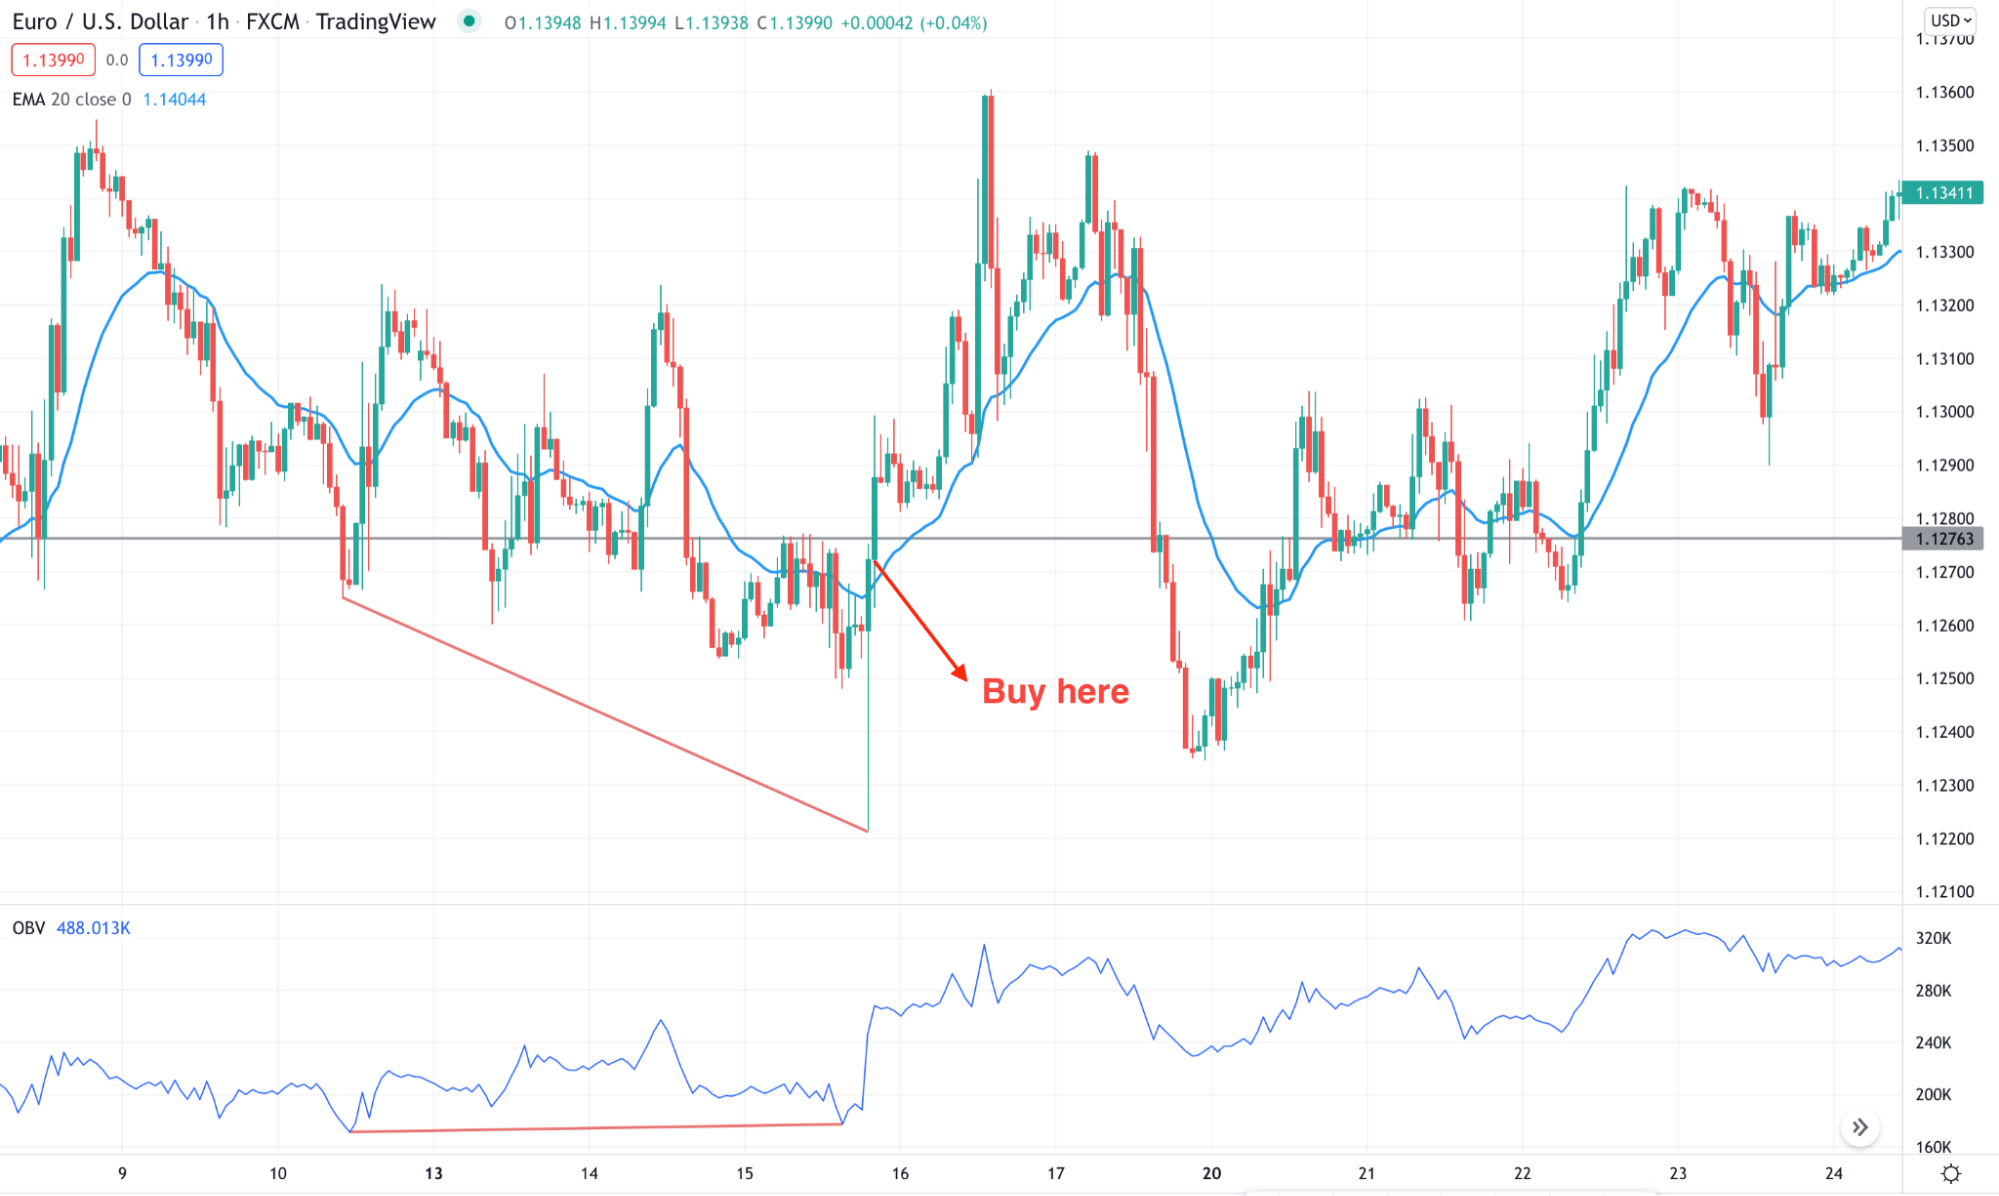
Before opening a buy trade, make sure to find the following condition in the trading chart:
- The broader market context is bullish.
- The price moved lower, but the OBV moved higher, pointing out a divergence.
- The divergence happens from a significant demand area.
- The price moves above the dynamic 20 EMA and closes.
- Buy the instrument from the closing candle above the dynamic 20 EMA with the SL below the near-term swing low.
Bearish trade setup
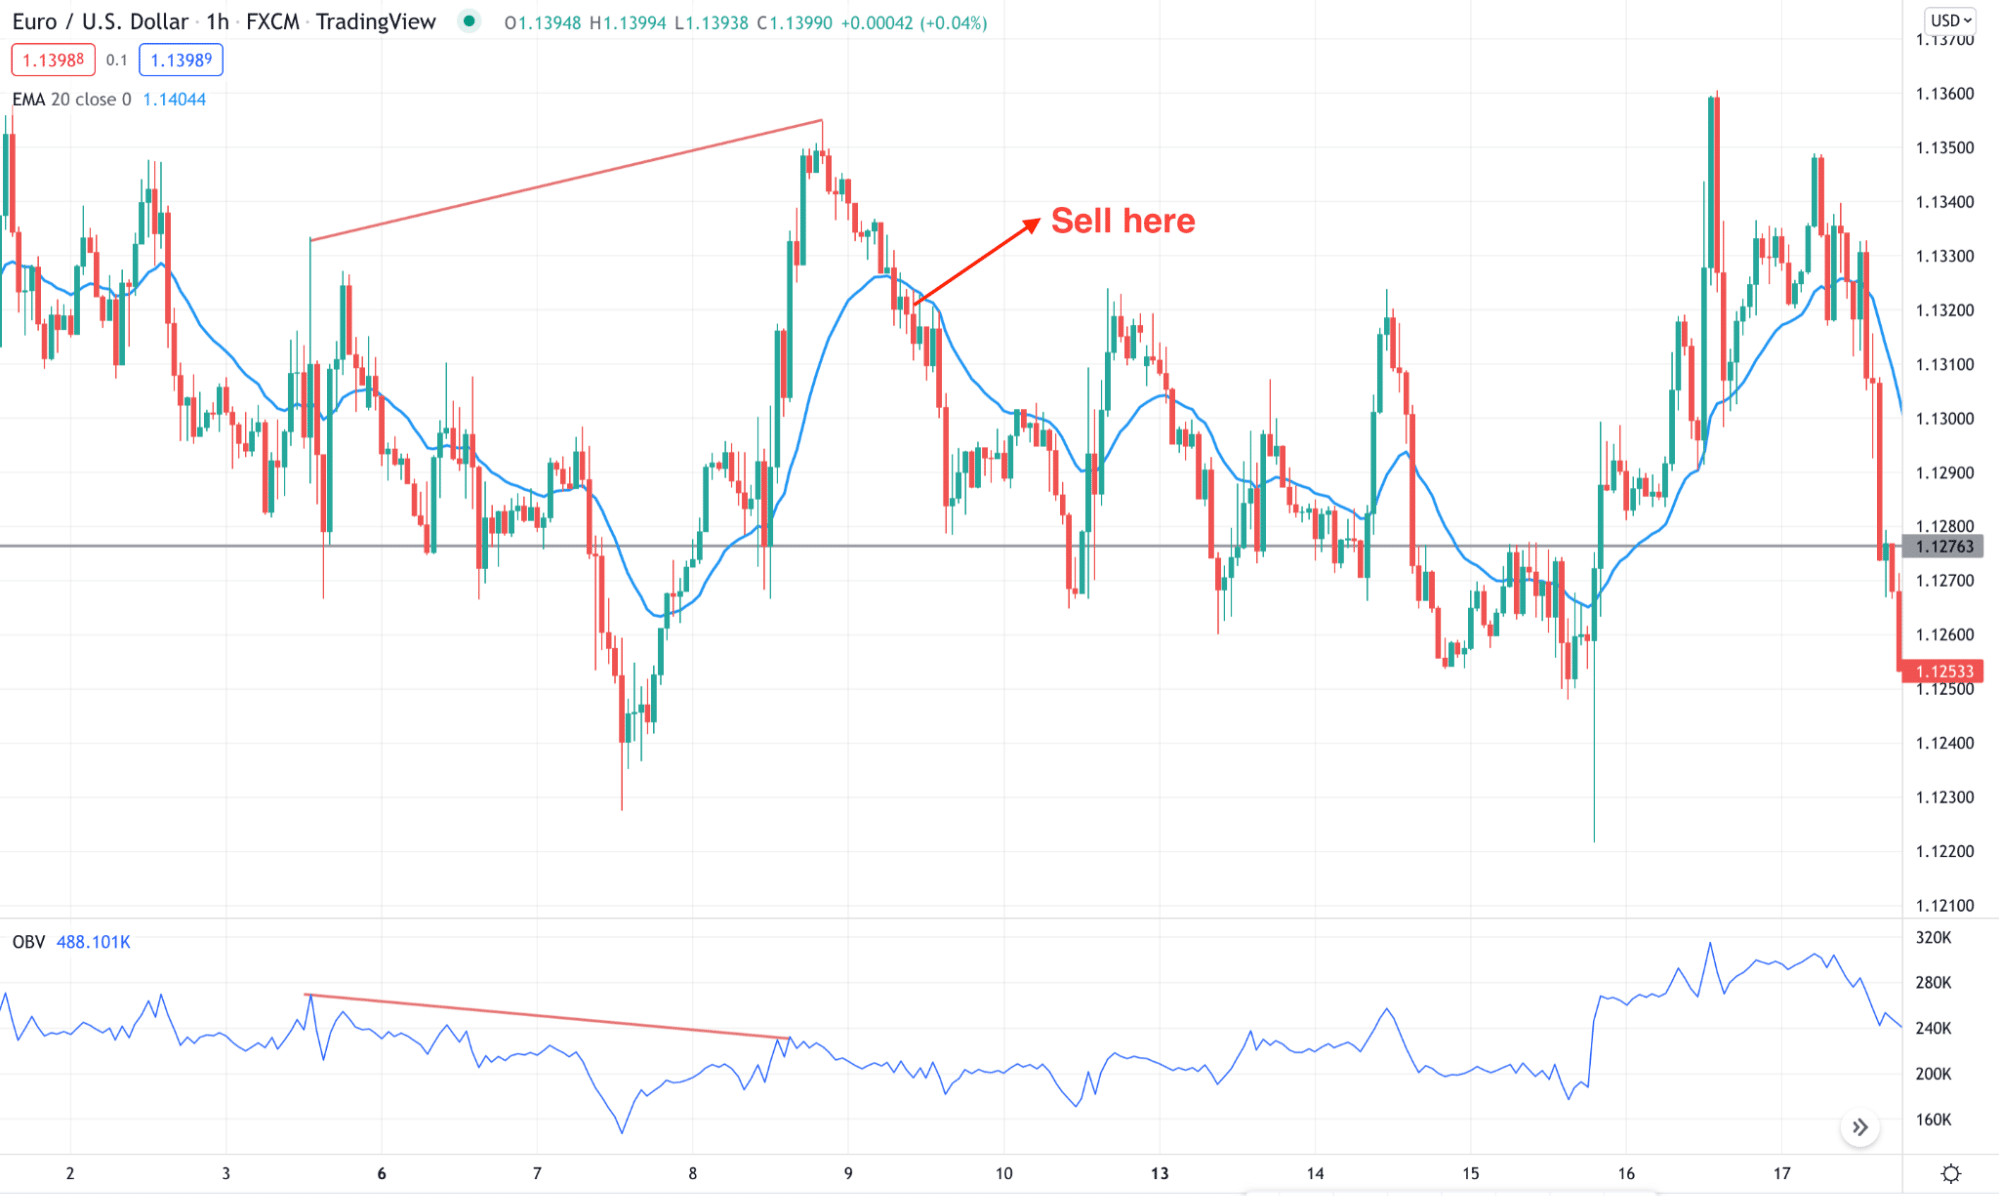
Before opening a sell trade, make sure to find the following condition in the trading chart:
- The broader market context is bearish.
- The price moved higher, but the OBV moved lower, pointing out a divergence.
- The divergence happens from a significant supply area.
- The price moves below the dynamic 20 EMA and closes.
- Sell the instrument from the closing candle below the dynamic 20 EMA with the SL above the near-term swing high.
A long-term strategy
It is similar to the short-term method, but investors should make sure to use additional indicators and read the price action clearly before opening a buy or sell trade.
Bullish trade setup
Before opening a buy trade, make sure to find these conditions in the price chart:
- The market is trending up above any key support level.
- OBV moves above the zero line.
- MACD histogram turned bullish.
- A daily candle closes above the dynamic 20 EMA.
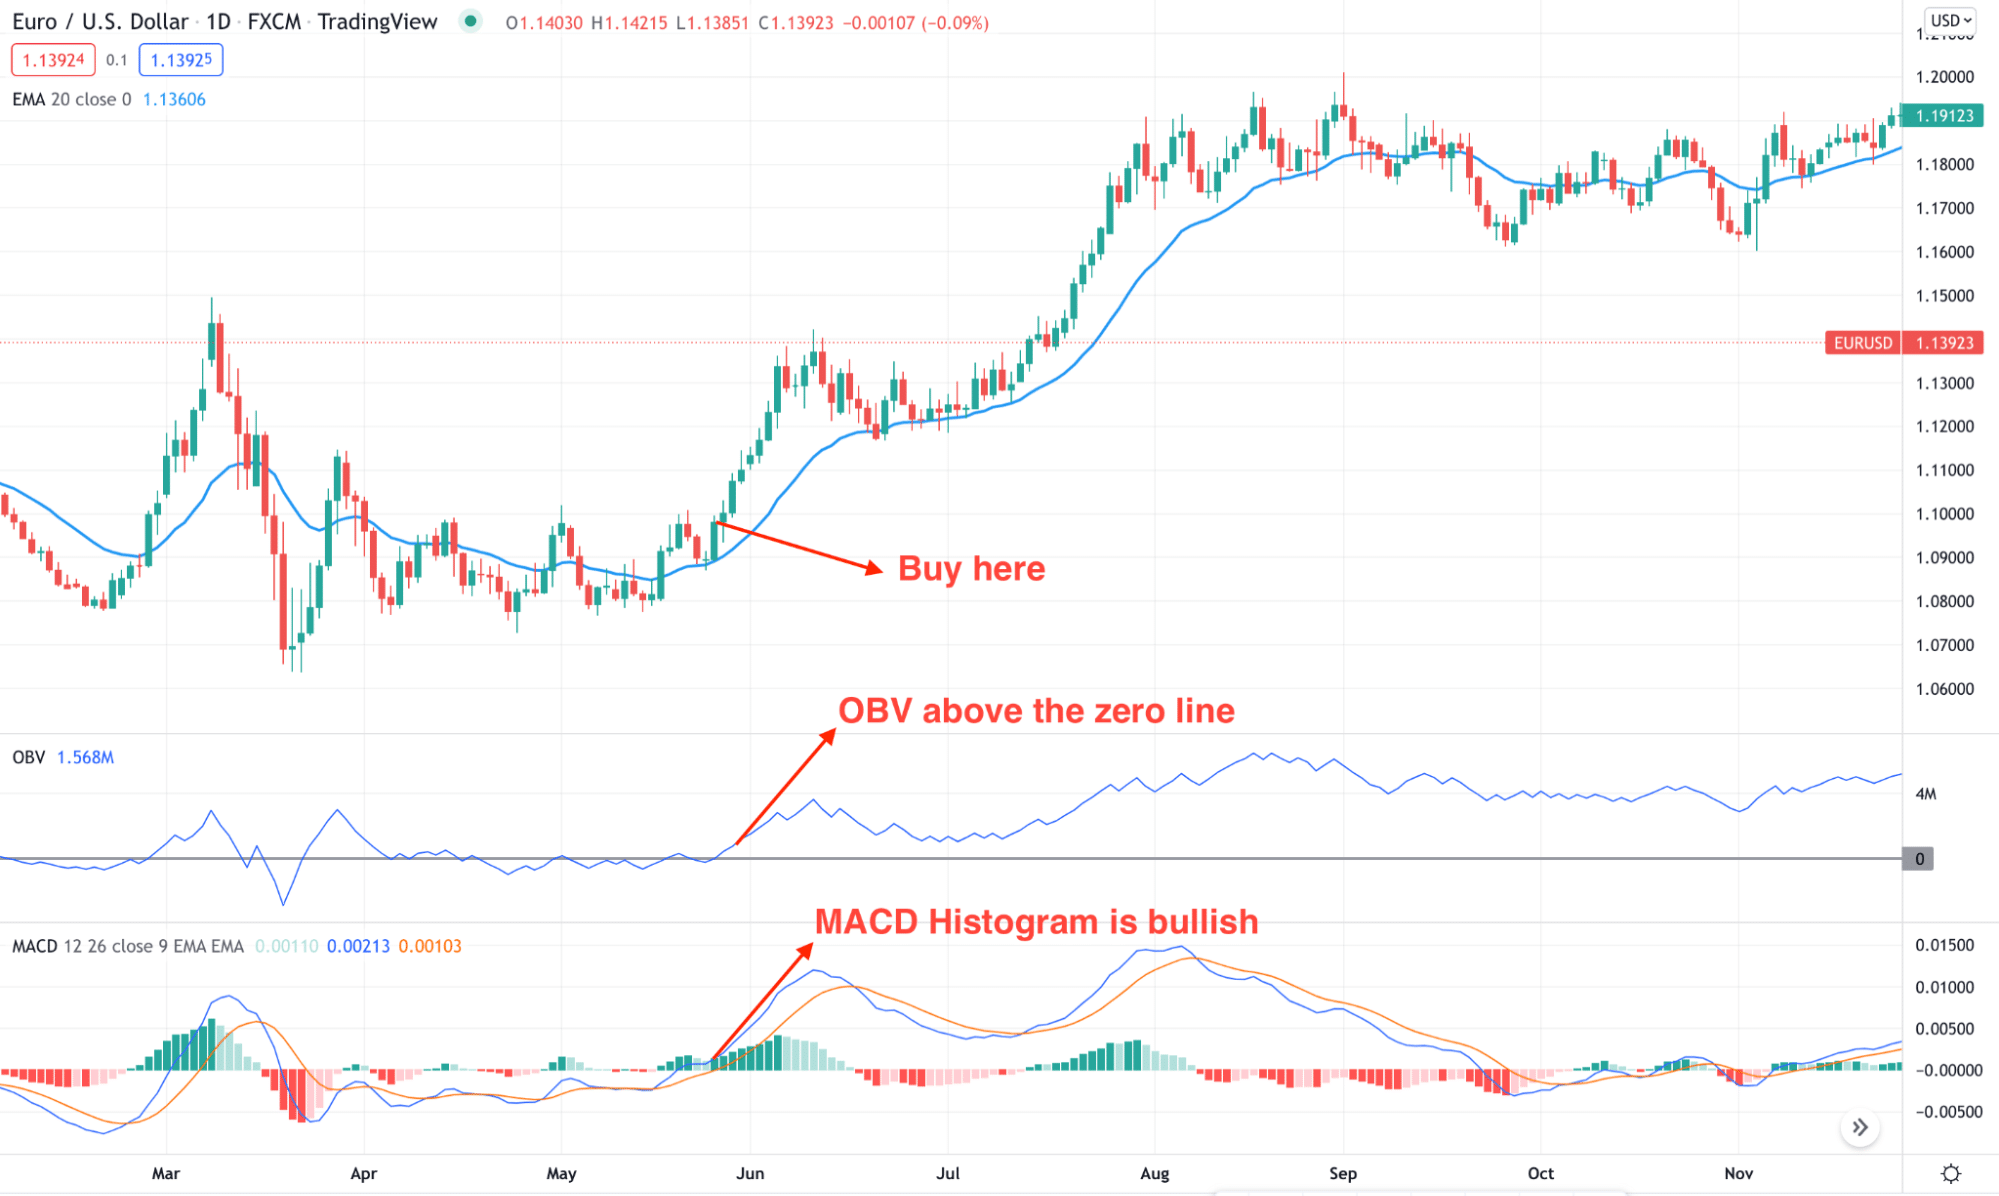
Once you find these conditions in the chart, open a buy trade with the SL below the swing low of dynamic 20 EMA and TP at near-term resistance.
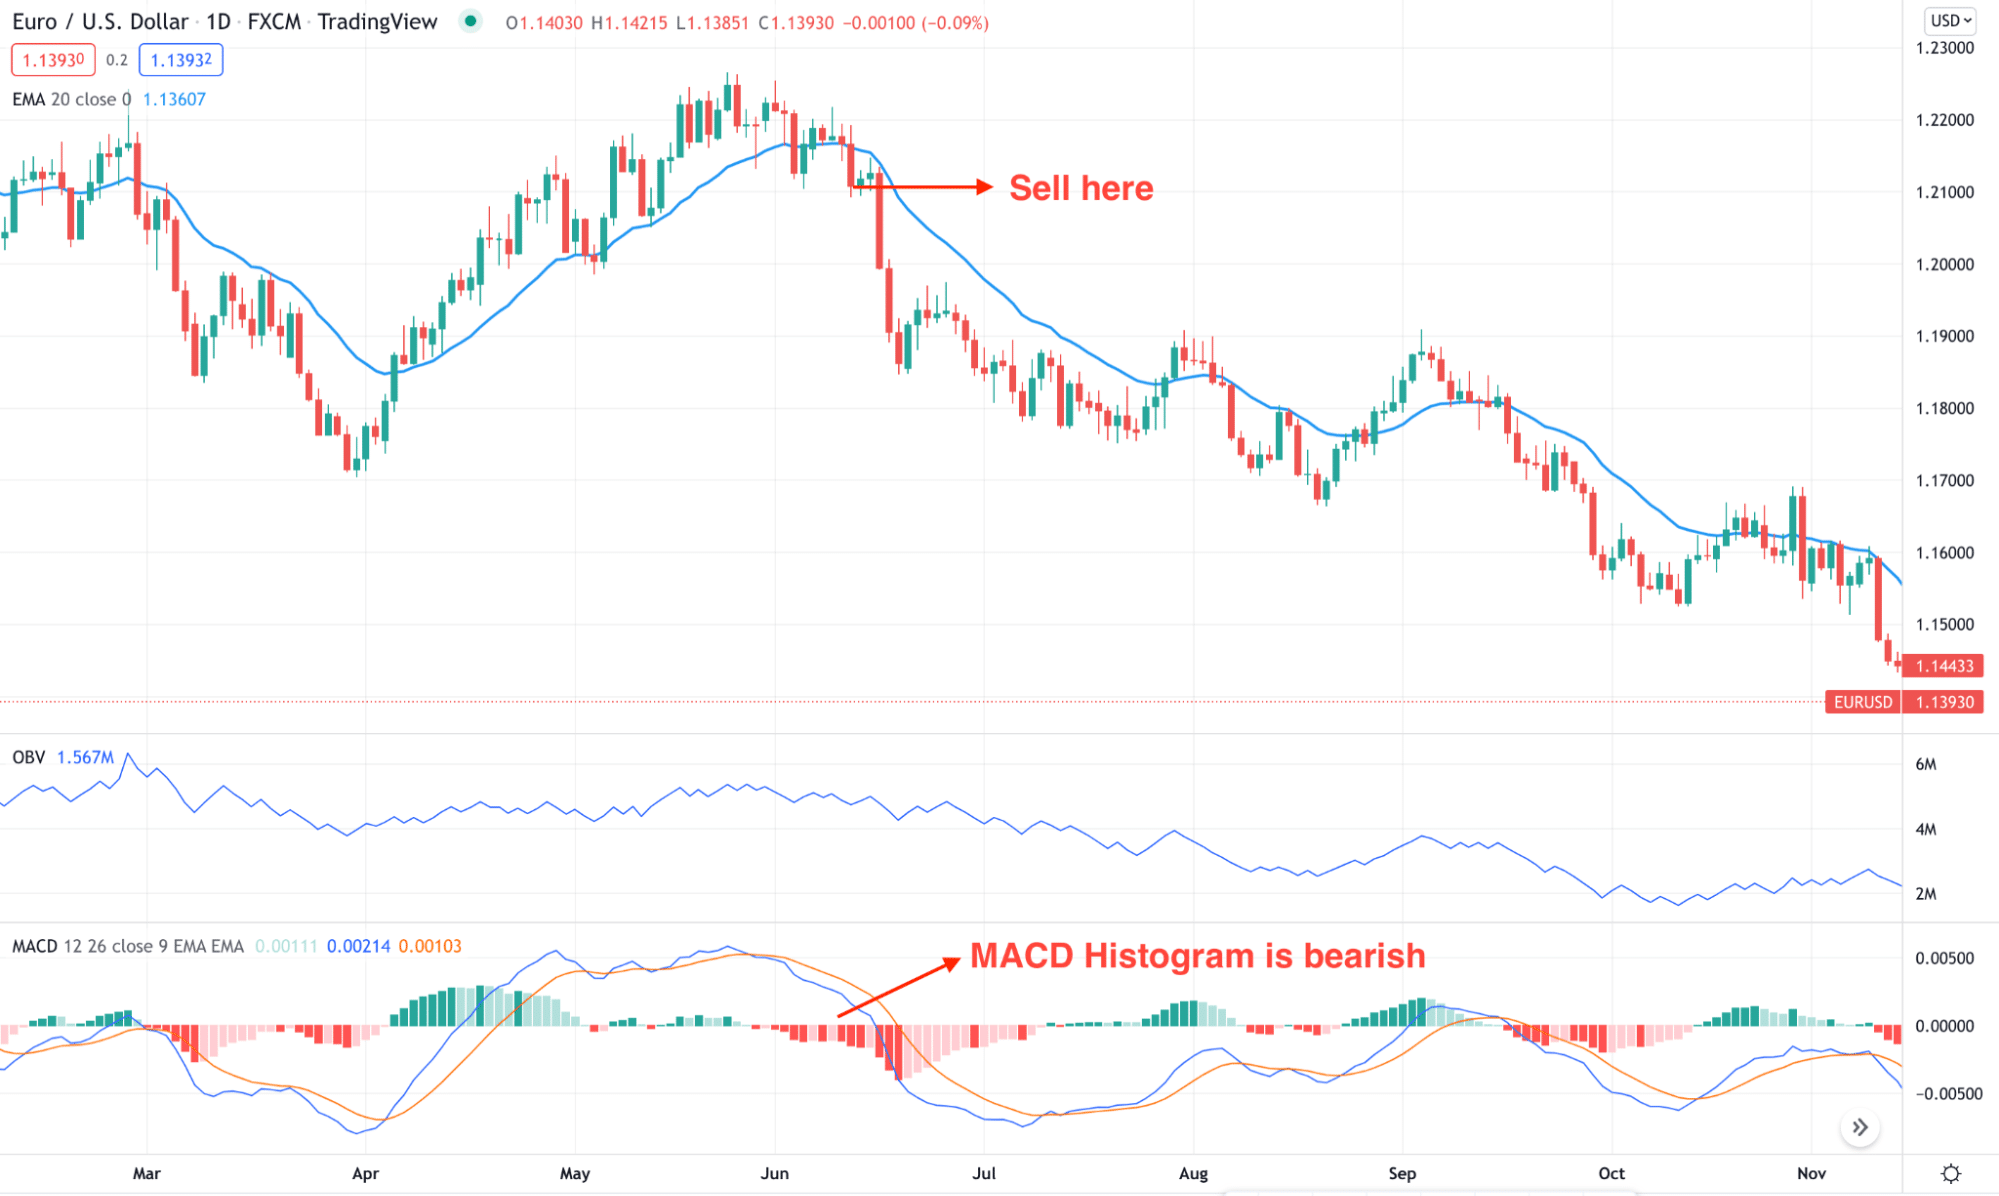
Bearish trade setup
Before opening a sell trade, make sure to find these conditions in the price chart:
- The market is trending down, and it is below any key resistance level.
- OBV moves above the zero line.
- MACD Histogram turned bearish
- A daily candle closed below the dynamic 20 EMA.
Pros & cons
| Pros | Cons |
| It is straightforward to read the OBV, and it can easily combine with other technical tools. | Traders cannot rely on the particular indicator only. |
| The indicator uses volume in the financial market, which is an important metric. | It needs a lot of practice to get familiar with this method. |
| The accuracy of this instrument is high for highly liquid trading assets- like major forex pairs. | Sound knowledge about technical analysis is important for this trading approach. |
Final thoughts
We have seen the exact trading approach using the OBV indicator in the FX market. Therefore, besides utilizing this indicator with other trading tools, traders need to follow a sound risk management system.


