
You may be seeking reliable patterns or formations of price movements to create invincible trading strategies. Some patterns indeed enable traders to perform consistently profitable trading positions containing attractive risk ratios. The pennant pattern is a typical pattern for financial traders to make precious trading decisions.
However, if you get the best results using this formation for your trade decisions, there is no alternative to learning about the pattern in detail. This article will introduce you to the pennant pattern, including functionality, capabilities, advantages, limitations, etc. Moreover, we describe different trading techniques using this pattern.
What is the pennant pattern?
It is a candle formation from a trendy price movement signaling continuation. It takes place on significant upward or downward price shifting of any financial asset, sharing similarities with the flag and triangle patterns. Meanwhile, you can apply this pattern to trade indices, commodities, forex pairs, etc.
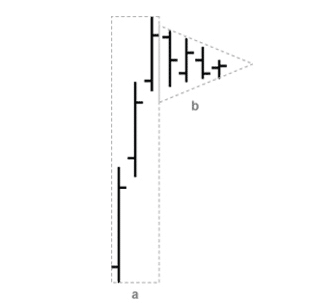
The pattern structure has two parts: the flagpole and the pennant. It starts with the pole and finishes the formation after the breakout. An important fact is that pennant size, or the retracement, is not more than 38.2% of the pole size.
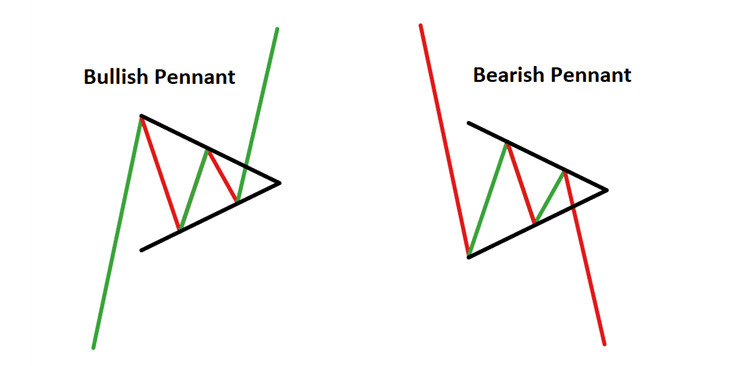
You can mark a bullish pennant, known as a bearish pennant, for a downward market in a bull market. The initial potent movement forms the shape of a triangle that you make using two converging straight lines.
The flagpole formation is a trendy movement, and the pennant formation occurs during the consolidation phase. According to a study by Cody Hind (2020), the bullish pennant formation has a success rate of 54.87% and a 55.19% success rate of the bearish pattern.
How to trade using the pennant pattern
You can apply the same system in both an upward and downward market. However, a bullish pennant involves buy bias, and sell preference relates to the bearish formation. The trade is valid after the entire formation of the pattern when the price comes out of the pennant. The stop loss level should be above or below the candle that is the first breakout candle.
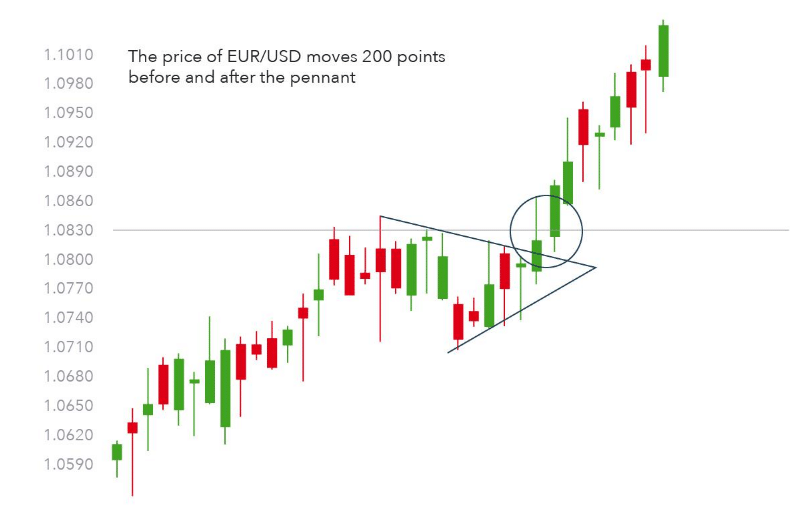
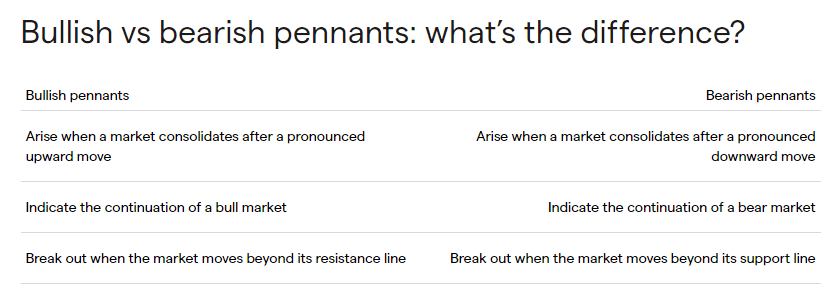
Meanwhile, your profit target is the exact distance as flagpole after the breakout. You can perform trade using this pattern individually or combine other technical indicators to trade with more accuracy. Now we are attaching a table showing the key differences between different pennant patterns.
A short-term strategy
Our short-term trading strategy involves using the volume indicator for more precise entry/exit positions. This trading method applies to any time frame, but we recommend using at least an hourly chart to eliminate lower time frames of fake swing positions. We recommend choosing major currency pairs and assets with sufficient volatility, although you can trade any tradable financial asset using this technique.
Bullish trade scenario
When you seek to place buy orders, confirm the current trend is bullish from the upper time frame charts such as H4 or daily and seek entry/exit at the H1 chart.
Follow the steps below:
- Identify the flagpole.
- Mark the bullish pennant at the hourly chart.
- Wait until the breakout.
- When the breakout takes place, check it has sufficient volatility through the volume indicator.
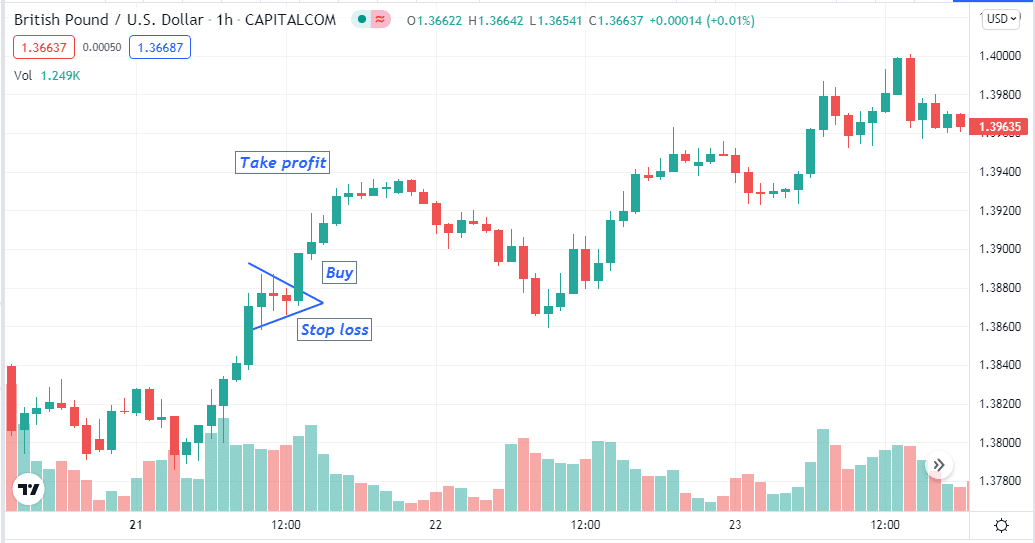
Entry
When these conditions above match with your target chart, wait till the breakout candle closes. Then place a buy order.
Stop loss
The stop loss level for your buy order will be below the breakout candle.
Take profit
The primary profit target will be the exact pole size distance above the pennant.
Bearish trade scenario
Confirm the current trend is a downtrend from the weekly chart and seek trading positions at the daily chart. Identify the bearish pennant pattern and wait till the breakout on the upside. Place a sell order after the closing of the breakout candle. Observe the HMA for more confirmation.
Follow the steps below:
- Identify the flagpole.
- Mark the bearish pennant at the hourly chart.
- Wait until the breakout.
- When the breakout takes place, check it has sufficient volatility through the volume indicator.
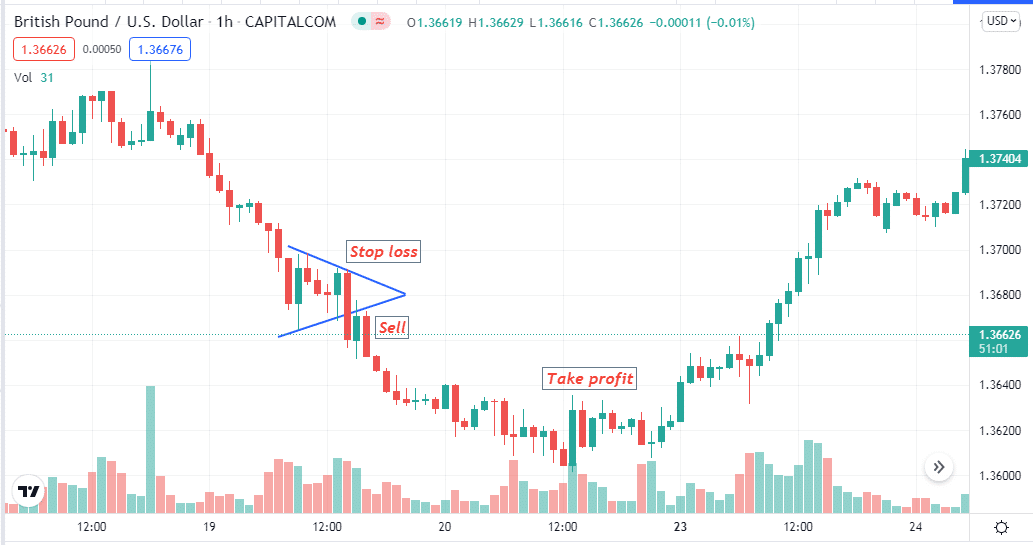
Entry
When these conditions above match with your target chart, wait till the breakout candle closes. Then place a sell order.
Stop loss
The stop loss level for your sell order will be above the breakout candle.
Take profit
The primary profit target will be the exact pole size distance below the pennant.
A long-term strategy
In our long-term trading method, we use Hull moving average period of 21 besides this pattern. The HMA signal line generates trade ideas by direction and involves less lag than the simple moving average. Price consolidates in this method, so it usually comes at the HMA line, so it will be easier to determine the pattern. This strategy suits any time frame charts; we recommend using a daily chart.
Bullish trade scenario
Confirm the current trend is an uptrend from the weekly chart and seek trading positions at the daily chart. Find the bullish formation of this pattern and wait till the breakout on the upside. Observe the HMA for more confirmation as the direction is upward and the breakout candle closes above it. Place a buy order after the closing of the breakout candle.
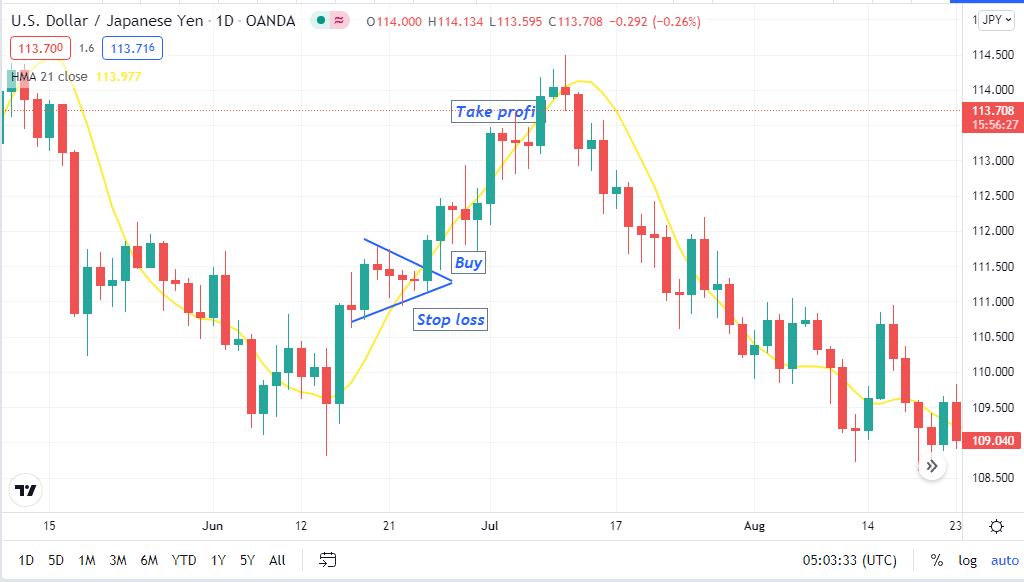
The initial stop loss level will be below the breakout level, and the profit target of the buy order is above duplicate distance as the flagpole size.
Bearish trade scenario
Confirm the current trend is a downtrend from the weekly chart and seek trading positions at the daily chart. Identify the bearish pennant pattern and wait till the breakout on the upside. Observe the HMA for more confirmation. Place a sell order after the closing of the breakout candle.
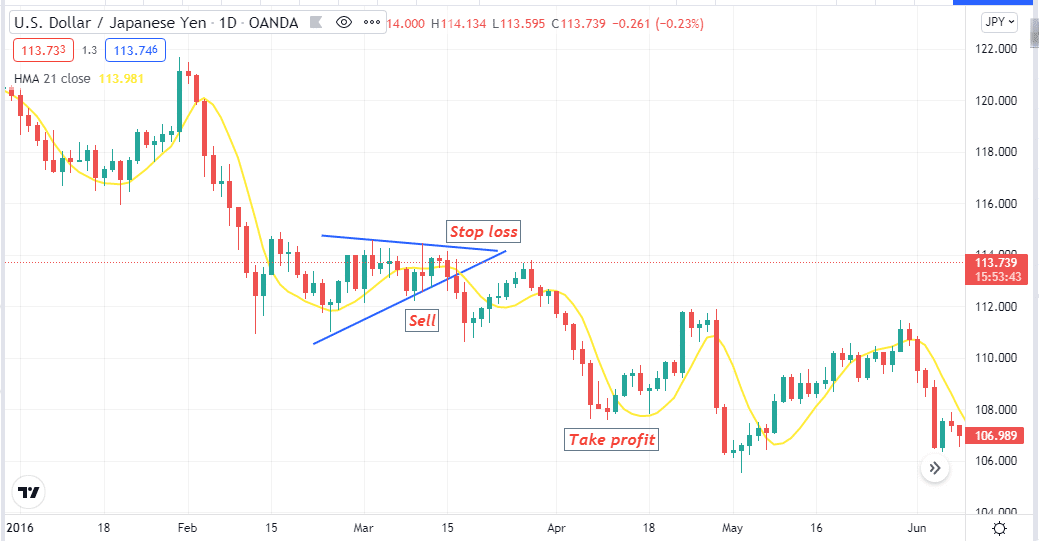
The initial stop loss level will be above the breakout candle, and the profit target of the sell order is below duplicate distance as the flagpole size.
Pros and cons
| Pros | Cons |
| Trading with this pattern is easy. | The success rate is low in comparison to other patterns. |
| Applicable to many trading assets. | Won’t get frequent trading positions. |
| Don’t require having deep knowledge to trade using this pattern. | This pattern can fail due to many other fundamental reasons. |
Final thought
Finally, we share all primary info about the pennant pattern in this article. Our suggestion is to master trading with this pattern by practicing demo trading before applying it on the live chart.