
One draw of breakout trading is the simplicity involved in identifying such trade opportunities. Using a simple tool like a trend line, you can quickly tell if a breakout scenario has occurred by simply looking at your charts. Once you get used to breakout trading, you can spot prospective trades very quickly.
Let’s learn how to use three tools for trading breakouts. All these tools employ the trend line to define breakout events. Apart from marking breakout scenarios, the trend line can also help determine trends. Indeed, the trend line is a handy tool to include in your trading arsenal.
Types of breakouts
If you aspire to become a breakout trader, know that there are two kinds of breakouts. Understanding which type may occur is a skill that separates a professional from a rookie trader. This is because you will see the setup from the perspective of the overall trend.
The two kinds of breakouts are the following:
- Continuation
- Reversal
Breakouts are essential to market events. They signify a shift in supply and demand whatever instrument you plan to trade. Often, this sentiment change can bring about explosive moves that will allow you to gain many pips in a short period.
№ 1. Continuation breakout
Sometimes price may stall after it moves vigorously in a particular direction. This occurs possibly because some traders liquidate profitable positions and are unsure whether the price has the strength to push the price further in the initial direction. The result is a sideways market movement called consolidation.
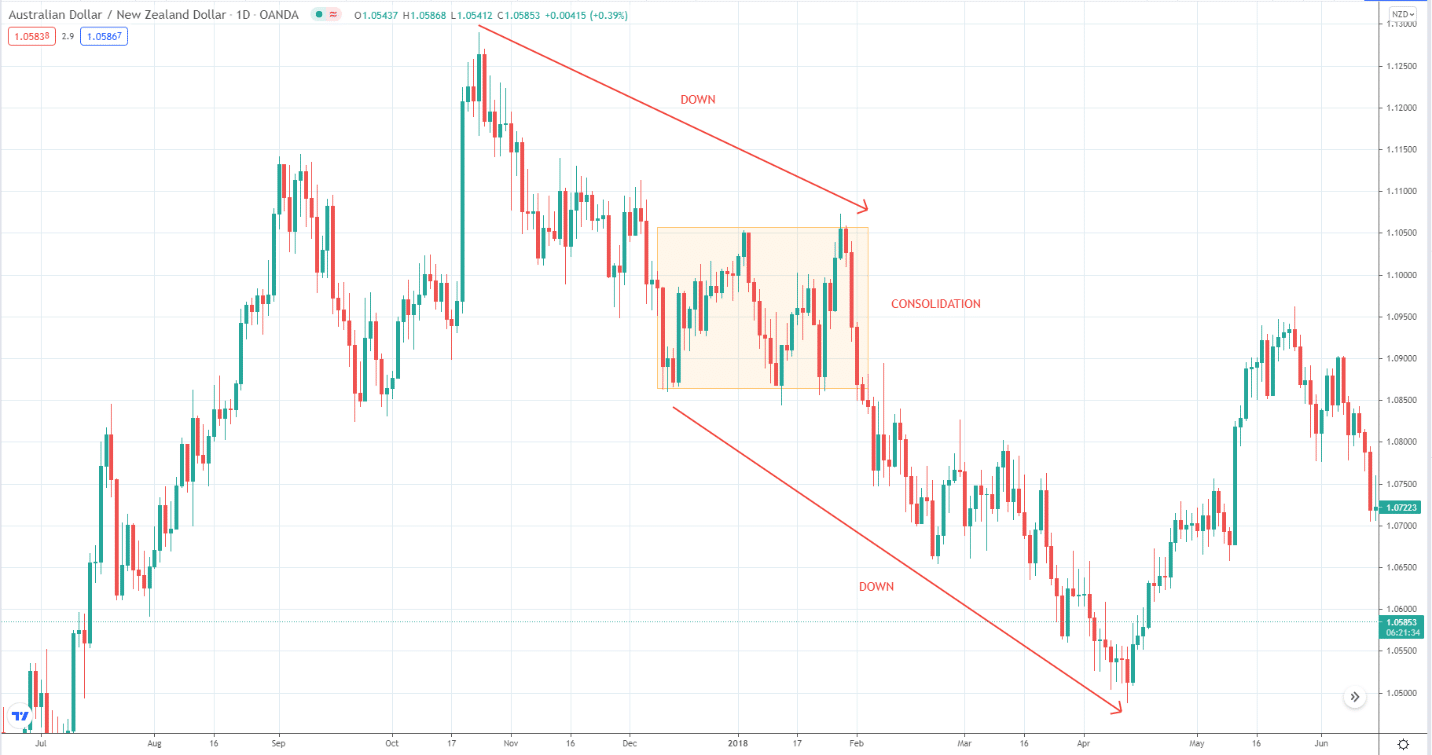
If most traders decide that the trend is not yet exhausted, they will continue building positions until the price breaks out in the original trend direction. This is what we call a continuation breakout. That is why a horizontal range forming after a trending move is not necessarily an indication of market reversal. The market can still break up or down depending on the strength of supply or demand. Refer to the above chart.
№ 2. Reversal breakout
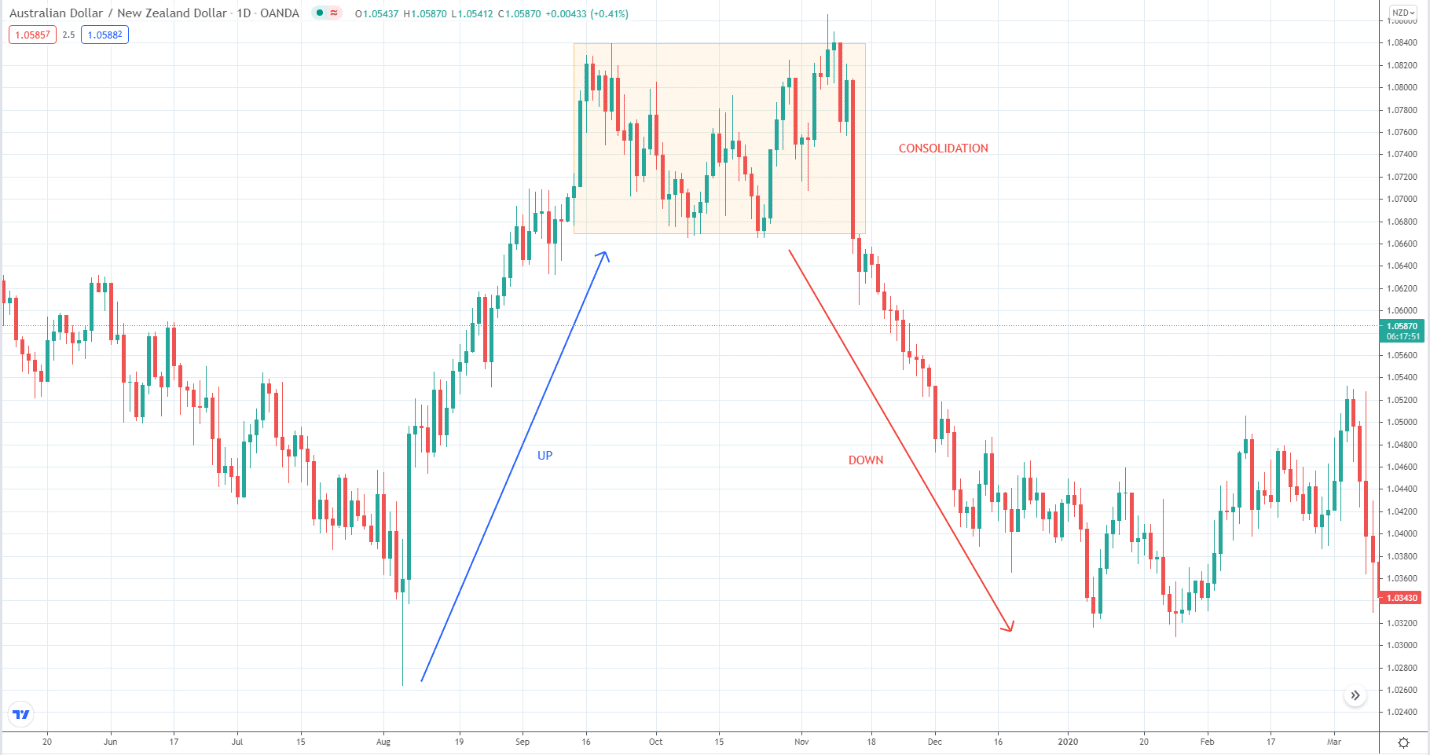
As already discussed, the price may enter a range after a strong move. After a while, the price will break out up or down to continue or reverse the trend. It depends on the bias before the formation of the range. For example, if a range comes off from a bullish trend, a reversal breakout occurs when the price breaks down, and a sell-off ensues.
A reversal happens when most traders have made a collective decision to trade the other way, considering the market is already exhausted. After the breakout, you can expect the price to move powerfully in the breakout direction. This is what happened in the market shown below.
False breakouts
After learning that price can either continue or reverse after coming out of a trading range, you might think it is easy to trade breakouts. This is not the case at all. There is another scenario that occurs so often that makes traders afraid to take breakouts. What we are talking about is the false breakout.
A false breakout applies in the following two situations:
- Price breaks and closes beyond classical support/resistance level but returns to the range after one or more candles.
- Price breaks and closes beyond a trend line but fails to continue.
As you can see, trading breakouts are challenging. The market may fake you out after you commit to trading. To avoid this scenario, traders often use other tools to confirm the breakout.
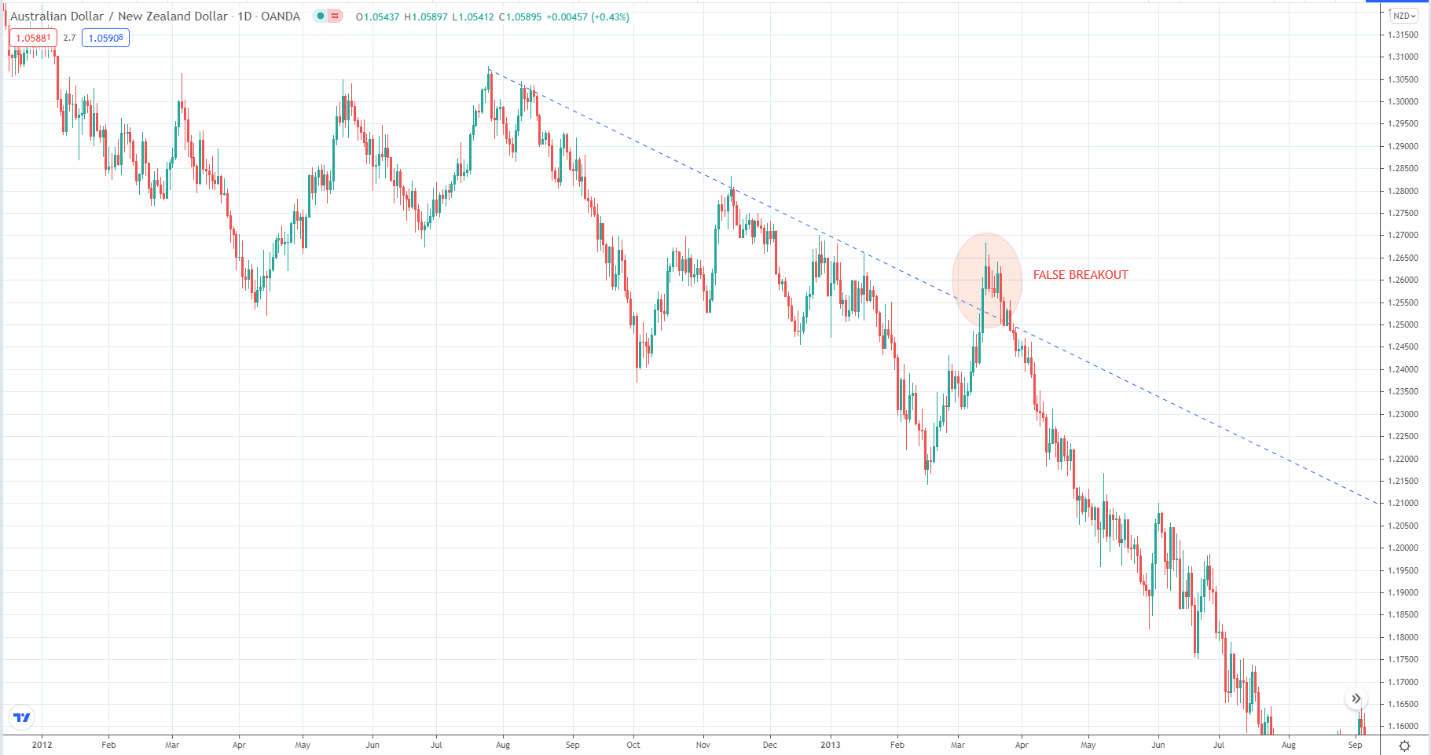
Some traders use volume or indicators like MACD, RSI, ADX, and others. Consider the chart below. The trendline break seems valid. Price broke above the trend line, but shortly after, it came crashing back down and continued the trend down.
Another way to avoid fakeouts is to use the break and retest method. In this method, you do not enter a trade right after the breakout. Instead, you mark time until the price touches the breakout area and see if you get a bounce. To trade this strategy successfully, you must know common candlestick formations and price patterns. However, this type of entering breakouts is essentially not breakout trading anymore.
Breakout tools
To be able to trade breakouts, there are several tools you can employ. You will learn three of them in this section.
№ 1. Trend lines
The trend line is undoubtedly the most straightforward tool to trade breakouts. By now, you should have known how to plot this line on your chart. Drawing trend lines is a skill you should have. Plotting the wrong trend lines can lead to losses and confusing signals.
You need to identify at least two swing points going in one direction, up or down, to draw a trend line. If the currency pair is generally moving upward, then you must find at least two swing lows. If the trend is downward, then you must find at least two swing highs. When the market is trading in a horizontal range, you use horizontal lines to mark swing highs and swing lows instead. This makes horizontal lines different from trend lines.
After identifying two swing points, plot a trend line with these points as anchors, but do not forget to extend the line to the right. The next thing to do is wait for the price to test this line. When this happens, two scenarios may occur:
- Price may fade away from the trend line and resume the trend move.
- Price may get past the trend line and reverse the trend.
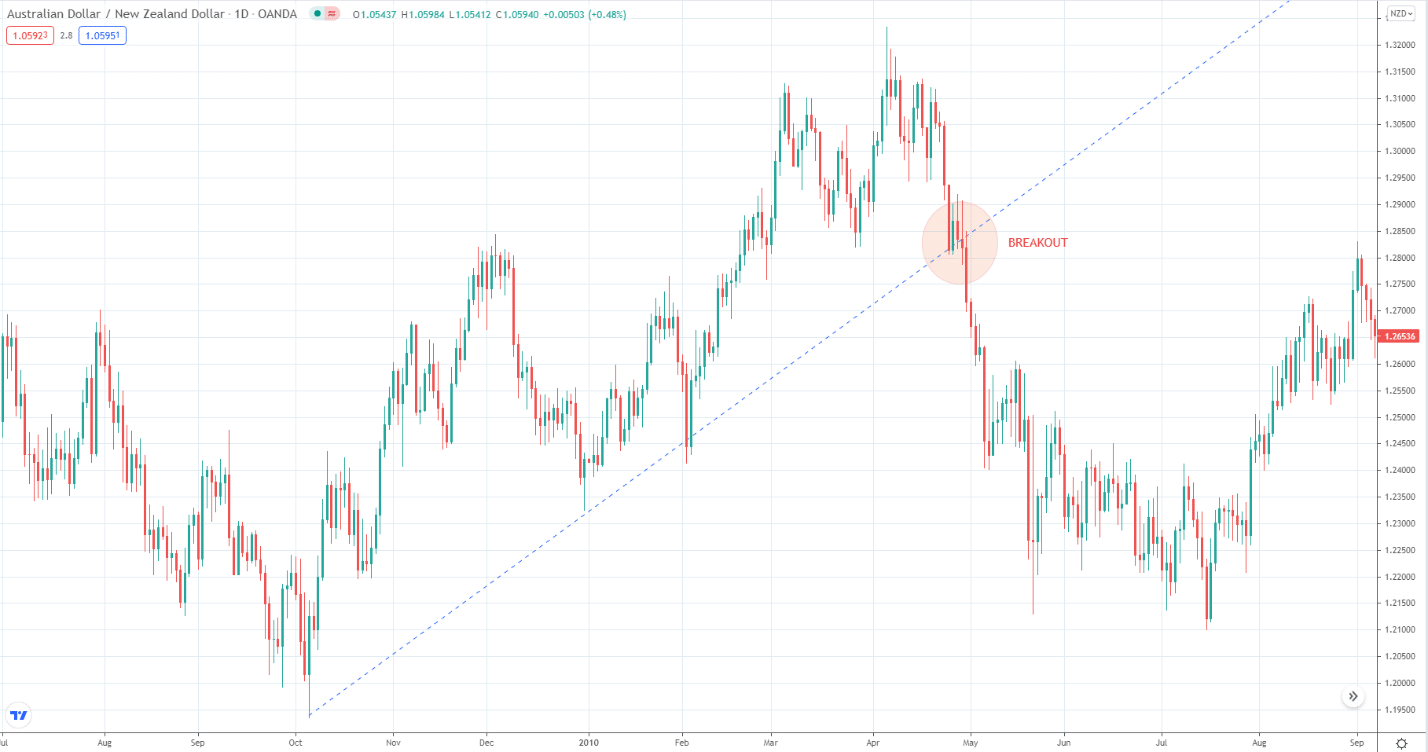
What we are looking at here is a breakout of the trend line. Therefore, you must wait and see what happens next after the price touches the trend line. In the above chart, price broke down on the fourth touch of the trend line.
№ 2. Triangles
Price forms various types of patterns when moving in a range. It can form a horizontal range, triangle, and others.
A triangle is a typical consolidation pattern. When a triangle forms, be ready to trade the break in any direction. There are three types of triangles you will find on your charts, namely:
- Rising triangle
- Falling triangle
- Symmetrical triangle
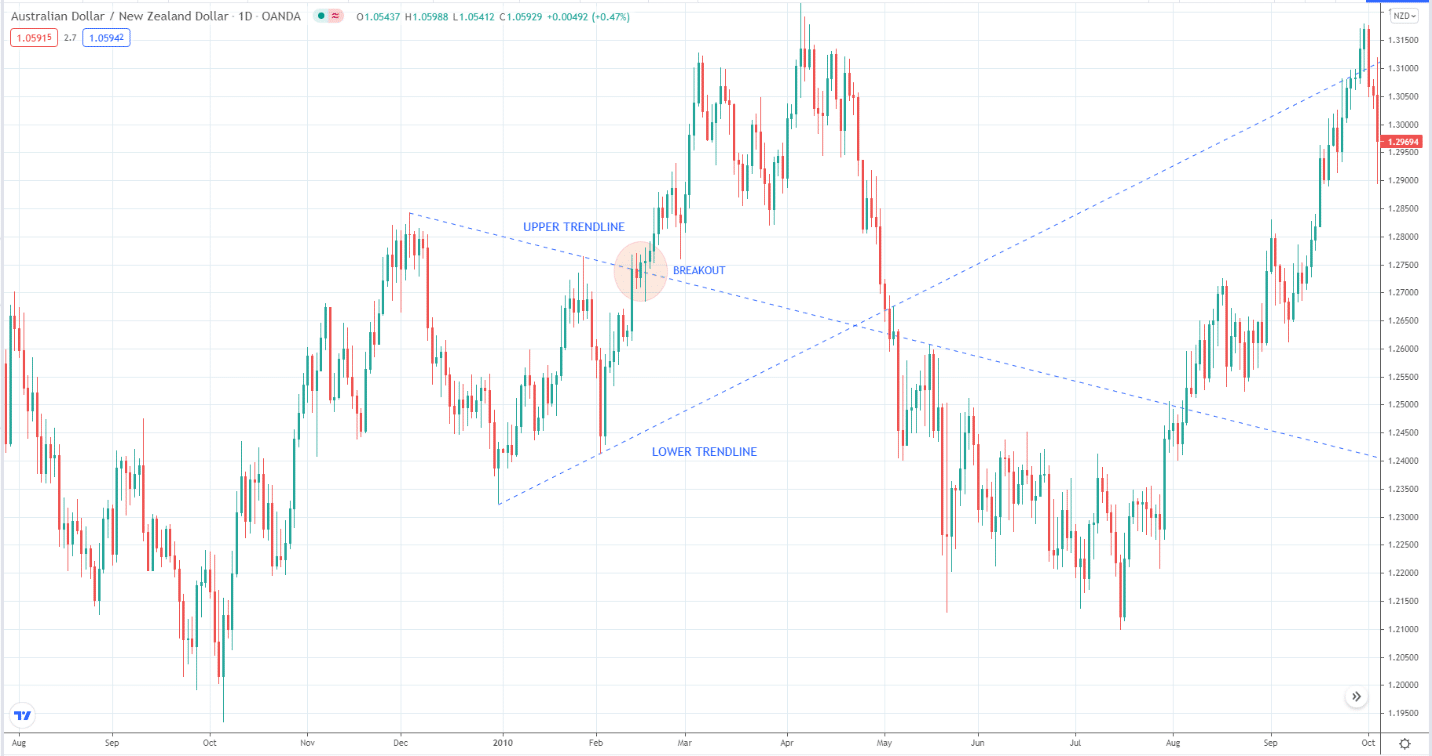
Here let us discuss the symmetrical triangle in detail. Because buyers and sellers have equal strength, price is caught in an increasingly tight range. You can see this as a triangle with higher lows and lower highs that forms an apex in between.
In contrast with rising and falling triangles, symmetrical triangles have a neutral tone. You have no clue which direction price will eventually break out. Whatever goes, you trade whichever side is broken, up or down. In the chart below, the price broke up after forming a symmetrical triangle, so you should trade long at the breakout of the upper trend line.
№ 3. Channels
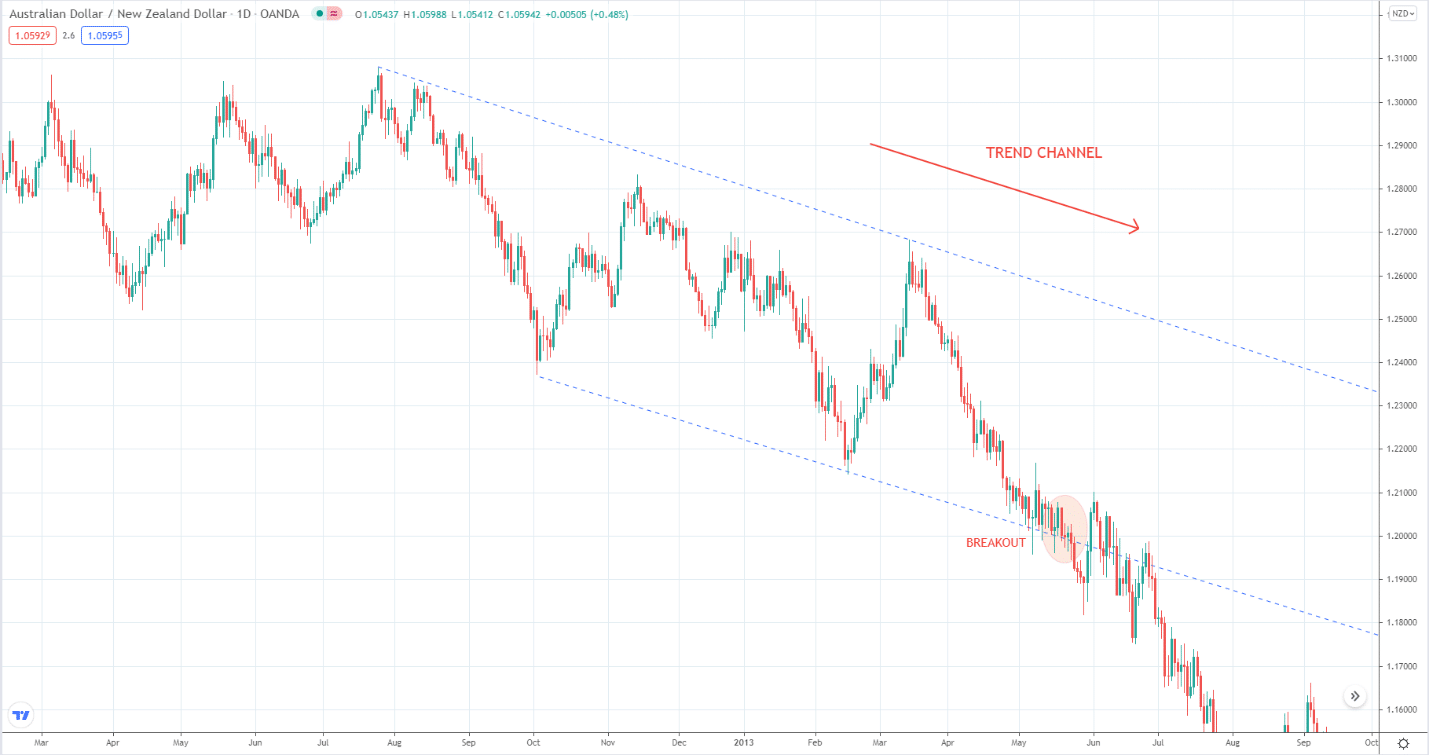
Trend channels allow you to see the trend clearly and monitor price action. Here we talk about inclined or angular channels, not horizontal channels or ranges. Compared with trend lines, you can see a breakout up or down when using trend channels. If the price breaks the upper boundary of a rising channel, it means the price is strongly trending up. This happens infrequently, but it comes once in a while.
However, please take note that it is not always possible to draw trend channels. If price is oscillating up and down regularly as it moves in a trend, it will allow you to plot trend channels with ease. At other times, swings are so erratic that you can draw only trend lines.
Final thoughts
If you want to trade breakouts, you can use the three tools discussed above to define trade entries. There are other tools you can use to trade this market scenario, though. Doing further study can help broaden your horizon. However, the three tools above will already give you plenty of breakout trade opportunities every single week.