
 Crypto Strategy: How to Profit From Market Volatility?")
The relative momentum index (RMI) is one of a kind among relative strength measurement tools. The calculation of the RMI indicator enables determining the market context and executing enormous profitable trades. So it makes sense that crypto investors consider this technical indicator valuable when making trade decisions.
However, there is no alternative to learning indicator components and professional investors using procedure when considering relying on any technical indicator to execute trades. This article will introduce you to the RMI indicator and the best trading methods to utilize this tool.
What is the Relative Momentum Index (RMI) indicator?
This indicator calculates upward and downward price changing ratios over N-periods. It is a technical indicator that tends to improve the readings of the Relative Strengths Index (RSI) indicator when the price reaches overbought and oversold levels. The introduction period of the RMI indicator is 1993 in Technical Analysis of Stocks and Commodities magazine. The RMI indicator shows readings in an independent window containing several levels and a dynamic line. The dynamic line moves in the range between 0-100.
The RMI formula:
Relative Momentum Index = N / (PCP + NCP)
where,
N= Total days
PCP= The Positive closing prices changing sum between N days ago and today.
NCP= The Negative closing prices changing sum between N days ago and today.
How to trade crypto using the RMI indicator?
The RMI indicator helps obtain the overall market context and enables buying/selling opportunities for crypto investors. This indicator shares similarities with another popular momentum indicator, the RSI indicator.
- When the price reaches above the top (70) line declares positive pressure or buyer domination on the asset price.
- When the readings come below the bottom (30) level, extreme declining pressure on the asset price increases.
Any crypto trader implements this basic concept to make trade decisions by measuring the momentum through the RMI indicator or combining the concept with many other technical tools and indicators to determine trading positions.
Short-term trading strategy
This trading method combines the RMI indicator with the EMA crossover concept to generate trade ideas. This trading method contains EMA 20 (blue) and EMA 40 (green) lines and the RMI indicator. When the RMI indicator detects potential momentum in any direction, we use the crossover concept to verify the direction and execute trades. This method suits many time frame charts; we prefer using H1 or 15min charts to obtain the best results.
Bullish trade scenario
Apply all three indicators and observe the readings to detect buying opportunities. Observe the readings below:
- The RMI dynamic line is near or below the bottom (30) level and starts heading on the upside.
- The RMI dynamic line reaches above the bottom (30) level.
- The blue EMA line reaches above the green EMA line.
- Both EMA lines head on the upside.
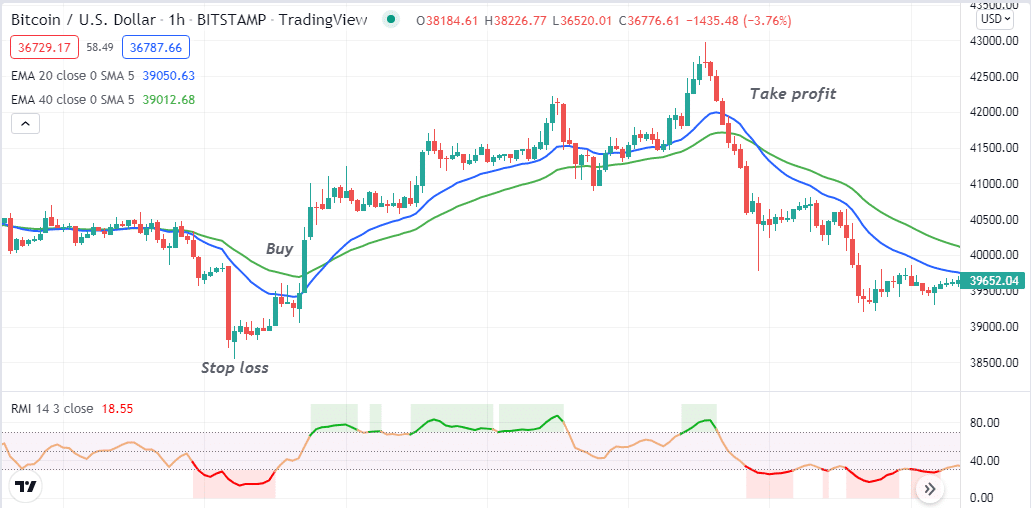
Entry
When these conditions above match your target asset chart, it declares potential bullish momentum. Enter a buy order.
Stop loss
Place an initial stop loss below the current bullish momentum.
Take profit
Continue the buy order till the bullish momentum remains intact. Match the conditions below when closing the order:
- The RMI dynamic line reaches above the top (70) level or starts to drop below that level after getting there.
- The blue EMA line reaches below the green EMA line.
Bearish trade scenario
Apply all three indicators and observe the readings to detect selling opportunities. Observe the readings below:
- The RMI dynamic line is near or below the top (70) level and starts heading on the downside.
- The RMI dynamic line reaches below the top (70) level.
- The blue EMA line reaches below the green EMA line.
- Both EMA lines head on the downside.
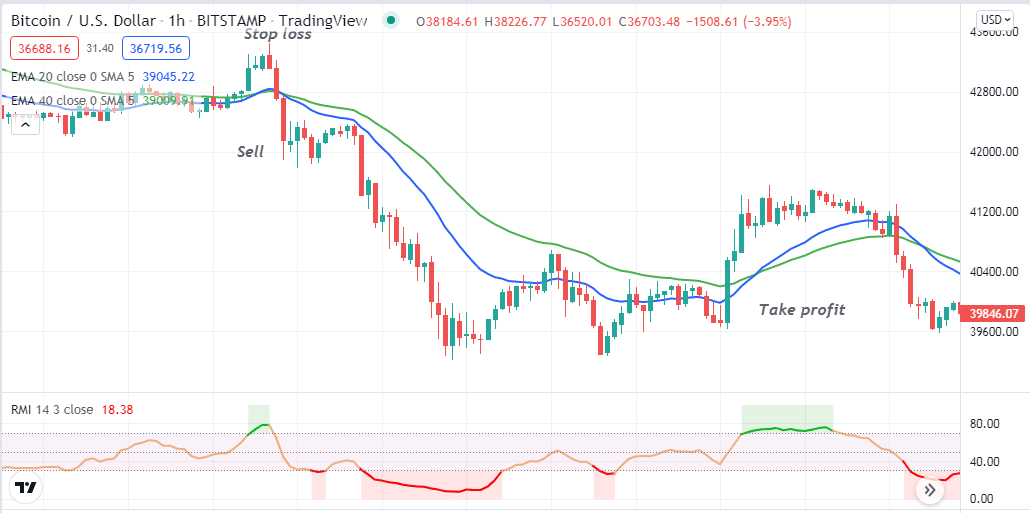
Entry
When these conditions above match your target asset chart, it declares potential bearish momentum. Enter a sell order.
Stop loss
Place an initial stop loss above the current bearish momentum.
Take profit
Continue the sell order till the bearish momentum remains intact. Match the conditions below when closing the order:
- The RMI dynamic line reaches below the bottom (30) level or starts to increase above that level after getting there.
- The blue EMA line reaches above the green EMA line.
Long-term trading strategy
We use the parabolic SAR as a supportive indicator beside the RMI indicator in this trading method. According to the readings, investors execute trades when both indicators suggest the price movement in any direction. This trading method applies to many time frames but enables identifying the best long-term setups when implementing in a Daily or H4 chart.
Bullish trade scenario
When the price reaches near the finish line of an uptrend, observe indicators readings as below:
- The RMI line is above the bottom (30) level and heads on the upside.
- The parabolic SAR starts creating dots below price candles.
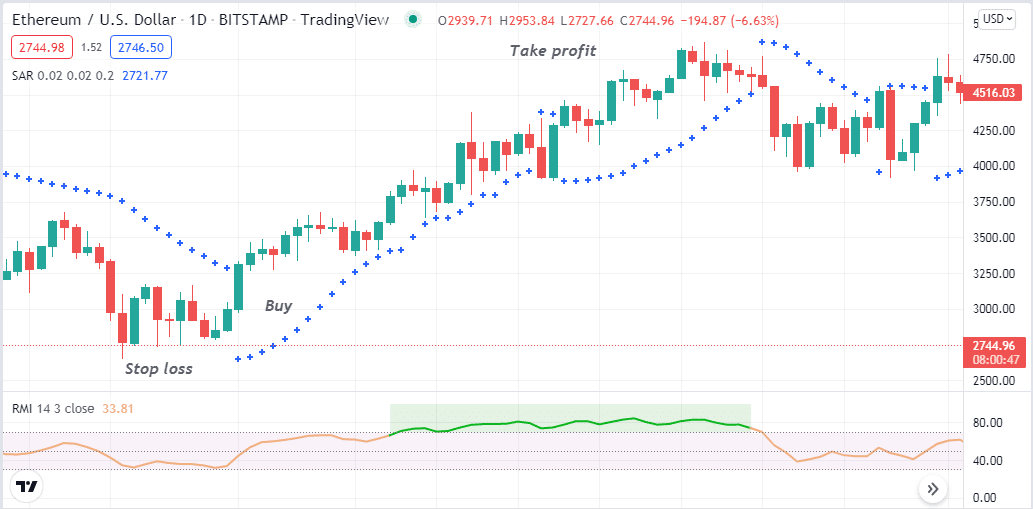
Entry
Match both conditions above and open a buy position.
Stop loss
Set an initial stop loss below the recent swing low.
Take profit
Close the buy order by checking the conditions below:
- The RMI line reaches above the top (70) level or starts declining after reaching that level.
- The parabolic SAR dots switch on the upside of price candles.
Bearish trade scenario
When the price reaches near the finish line of a downtrend, observe indicators readings as below:
- The RMI line is below the top (70) level and heads on the upside.
- The parabolic SAR starts creating dots above price candles.
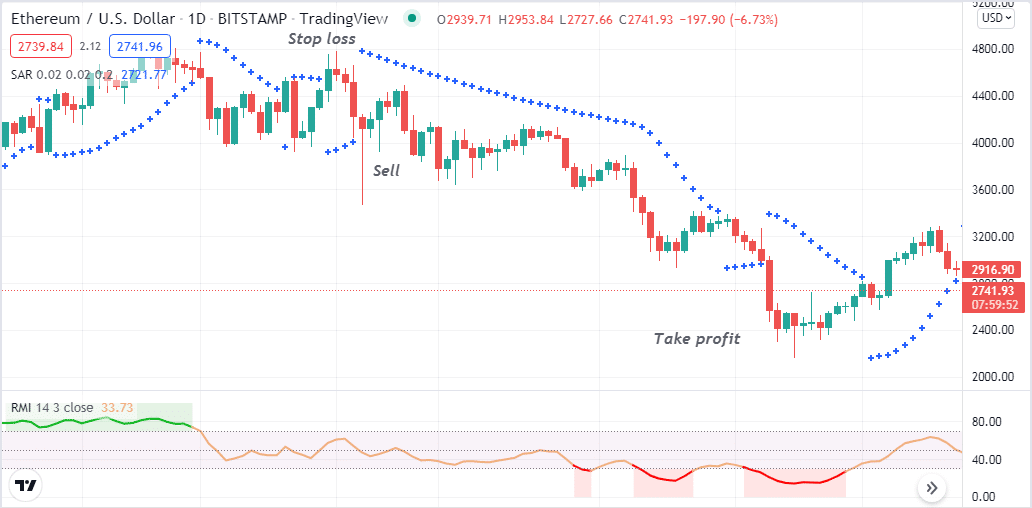
Entry
Match both conditions above and open a sell position.
Stop loss
Set an initial stop loss above the recent swing high.
Take profit
Close the sell order by checking the conditions below:
- The RMI line reaches above the bottom (30) level or starts increasing above after reaching that level.
- The parabolic SAR dots switch on the downside of price candles.
Pros and cons
| Pros | Cons |
|
|
|
|
|
|
Final thought
This article introduces you to a most promising technical indicator to perform crypto trading. When using the RMI indicator, we suggest sufficient practicing to master the concept and follow proper trade and money management while using this indicator.

