
Schaff Trend Cycle indicator is one of the best oscillators that suggest efficient trading positions combining different indicator formulas. Crypto investors choose the Schaff trend cycle indicator for its unique features and effectiveness. These simple and practical features make this indicator attractive to many market participants.
This article will introduce you to the indicator and describe how to use this tool for successful crypto trading. However, it is not wise to start using any technical indicator in live trading unless you have a thorough understanding. Moreover, following specific guidelines enable making more profits and reduces risks on capital as you can make sustainable trading methods with your skills.
What is the Schaff Trend Cycle indicator?
Different trading indicators calculate the market data differently. So developers often seek to develop unique indicators to improve concepts of other technical indicators. The innovation of trading indicators makes trade decisions easier as these technical tools work with several primary market context info.
The Schaff Trend Cycle indicator is one of the best indicators that combine two different indicator concepts:
- MACD
- Stochastic
Doug Schaff, a currency trader, is the developer of this technical indicator, and the developing period is 1999. It shows readings on an independent window with a dynamic line that floats between 0 and 100. There are two levels: the upper (75) and lower (25) levels, and the dynamic line floats beyond these levels.
How to trade using the Schaff Trend Cycle indicator?
You already know that the STC indicator uses the same concepts as the MACD and the Stochastic oscillator indicator.
- When the dynamic line reaches below the bottom (25) level, it declares an oversold condition and vice versa when it reaches above the higher (75) level.
- The dynamic line gets above the lower (25) level, declaring bullish force, and if it declines below the upper (75) level, the price may enter a bearish momentum.
Crypto investors can use this concept independently as it is a faster indicator and suggest more accurate entry/exit positions of trades or combine the readings with other technical tools for more efficiency.
Short-term trading strategy
We use another straightforward popular indicator, the HMA indicator, alongside the STC indicator for more efficient trading positions in this trading method. HMA indicators usually reduce the lag of other MA indicators and slop in any direction as the price keeps moving in that direction. We use an HMA line of 25 periods in this trading strategy. Apply this method on a 15 min or H1 chart to catch the most potential short-term trades on crypto assets.
Bullish trade scenario
Set both indicators at your target asset chart and observe the readings below:
- The dynamic STC line reaches above the bottom (25) level and heads toward the upside.
- The price reaches above the HMA line, and the HMA line starts sloping on the upside.
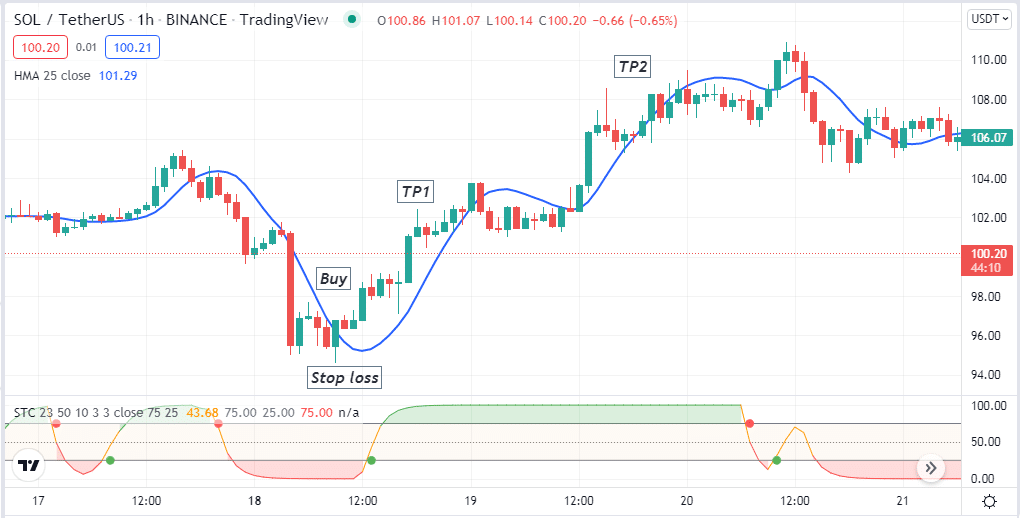
Entry
When these conditions above match your target asset chart, it declares initiation of a potential bullish momentum. Place buy order.
Stop loss
The initial stop loss will be below the current swing low with a buffer of 5-10pips. You may shift your stop loss at or above the breakeven point as a part of trade management when the price creates a new higher high, and you continue your buy trade.
Take profit
Close the buy order by checking these conditions below:
- The STC dynamic line reaches above the upper (75) level or declines below after reaching that level.
- The price reaches below the HMA line, and the HMA line starts sloping on the downside.
Bearish trade scenario
Set both indicators at your target asset chart and observe the readings below:
- The dynamic STC line reaches below the top (75) level and heads toward the downside.
- The price reaches below the HMA line, and the HMA line starts sloping on the downside.
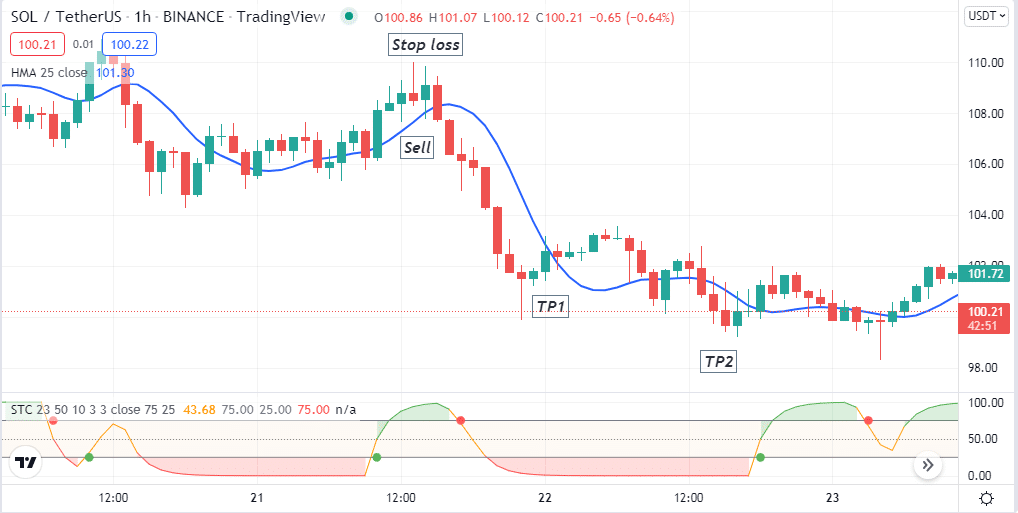
Entry
When these conditions above match your target asset chart, it declares initiation of a potential bearish momentum. Place sell order.
Stop loss
The initial stop loss will be below the current swing high with a buffer of 5-10pips. You may shift your stop loss at or below the breakeven point as a part of trade management when the price creates a new lower low, and you continue your sell trade.
Take profit
Close the sell order by checking these conditions below:
- The STC dynamic line reaches below the lower (25) level or increases above after reaching that level.
- The price reaches above the HMA line, and the HMA line starts sloping on the upside.
Long-term trading strategy
We use the parabolic SAR for confirmation before entering a trade alongside the STC indicator in this trading method. We recommend applying this method on an H4 or daily chart to get the best results when seeking long-term trades.
Bullish trade scenario
This trading method suggests opening a buy position when the scenarios below occur:
- The STC dynamic line gets above the lower (25) level.
- The STC dynamic line heads on the upside.
- Parabolic SAR dots take place below price candles.
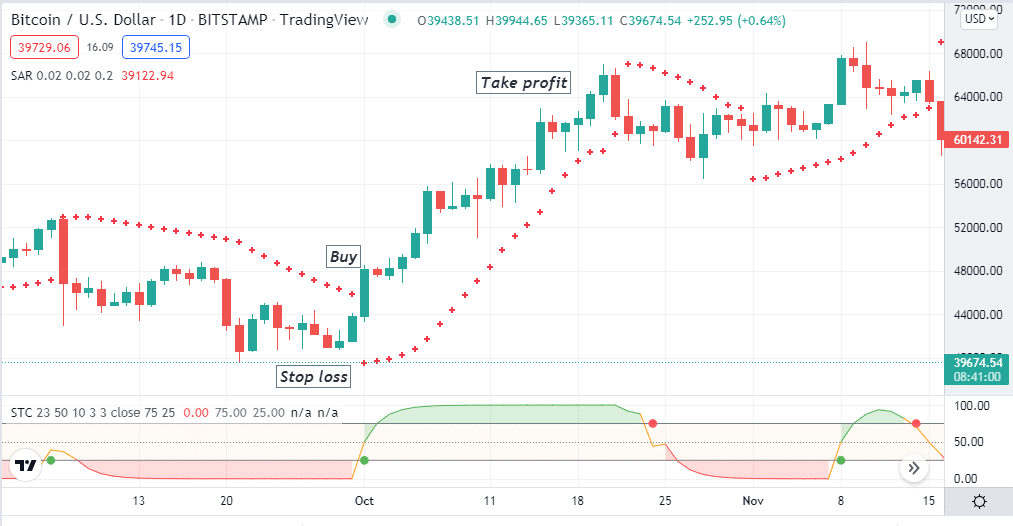
Entry
Match these conditions above and open a buy position.
Stop loss
Place an initial stop loss for your buy order below the current bullish momentum.
Take profit
Close your buy position by checking these conditions below:
- The STC dynamic line reaches above the upper (75) level or declines below that level after reaching.
- The parabolic SAR dots flip on the upside of price candles.
Bearish trade scenario
This trading method suggests opening a buy position when the scenarios below occur:
- The STC dynamic line gets below the upper (75) level.
- The STC dynamic line heads on the downside.
- Parabolic SAR dots take place above price candles.
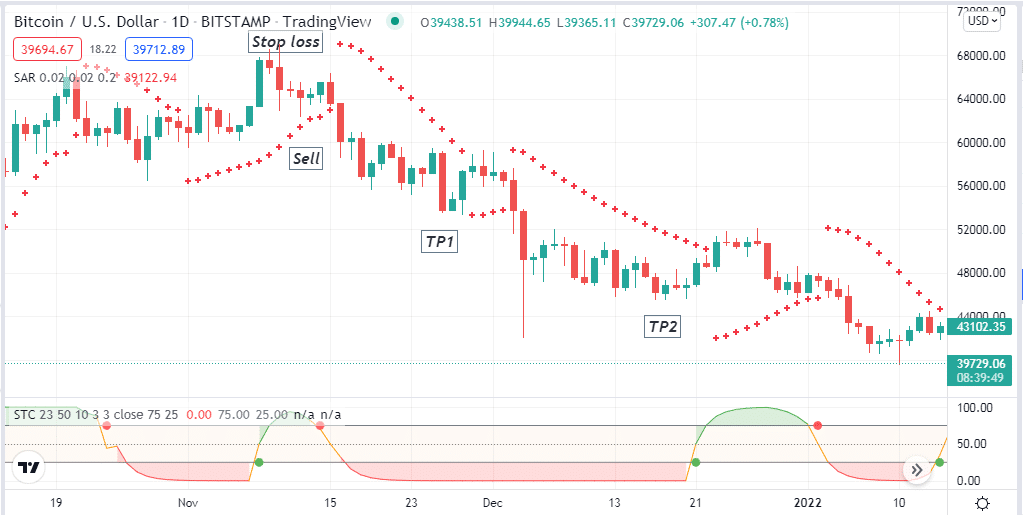
Entry
Match these conditions above and open a sell position.
Stop loss
Place an initial stop loss for your sell order below the current bearish momentum.
Take profit
Close your sell position by checking these conditions below:
- The STC dynamic line reaches below the lower (25) level or surpasses that level after reaching below.
- The parabolic SAR dots flip on the downside of price candles.
Pros & cons
| Pros | Cons |
|
|
|
|
|
|
Final thought
Finally, this article introduces you to a very potential trading indicator that you can use for successful trading in crypto assets. When relying on any indicator for trading, crypto-assets must check many fundamental factors like future projections, utilities, possibilities, etc., of the crypto to select as an investment.


