
SSL or Semaphore Signal Level channel is a trading indicator that shows the price direction using moving averages with different values. As a result, traders can see the market from a wide-angle view that will help them to make better trading decisions.
Taking trades using technical indicators needs close attention to elements of the trading tool. Every indicator has its unique method to find the upcoming price direction. Therefore, the SSL indicator will be effective for you once you understand its elements with a lot of practice. The following section will see the complete trading guide using the SSL indicator with practical examples.
What is the SSL indicator?
SSL is a simple trading indicator applicable to any financial market that uses moving averages to visualize the price better. In short, the main aim of this indicator is to show from where the trend is forming.
The SL indicator is an in-price trading tool that moves with the price. Moreover, it is shown in different colors so that investors can understand what is happening with the price. The SSL indicator would be the best if you want more detailed and simple trading charts.
How to trade using the SSL indicator in trading strategy?
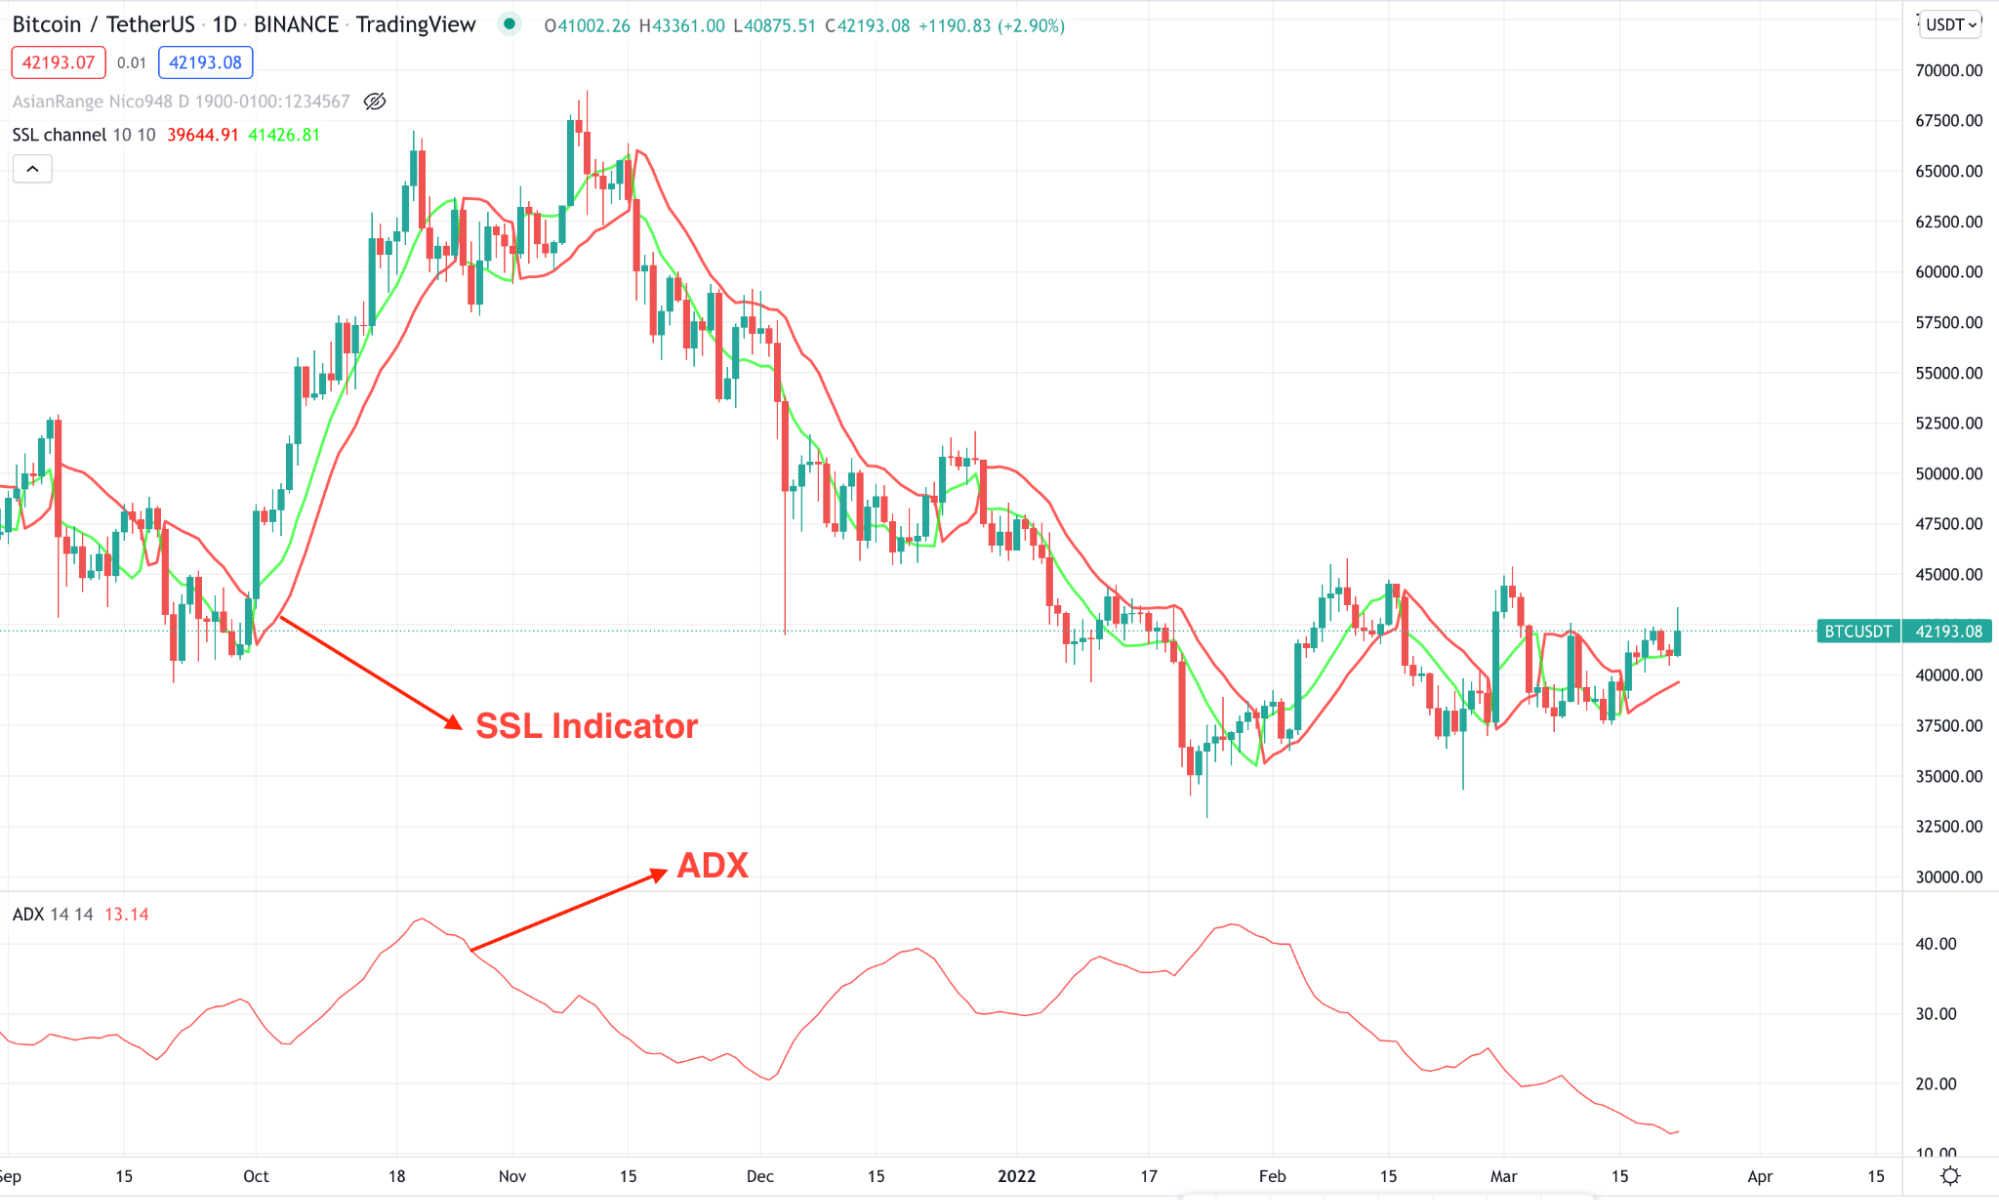
We have seen two different lines moving with the price in the above image. These lines represent a story about the market, and traders should be able to read it.
When the two lines cross themselves, the current price sentiment is changing its direction or about to change its direction. Usually, these lines are shown in green and red colors, but you can change the color and value.
When all indicators show the same signal, the trade will be valid. Besides, the SSL indicator includes alerts so that traders don’t miss any trade during the crossover. However, it is wise to turn off the alert and add additional tools to increase the accuracy. We will use ADX besides the SSL indicator to purify the trend trading opportunity in today’s learning.
ADX is a technical tool that shows the strength of the current price pressure. If the current price is trending lower and ADX is above 20, the bearish pressure has strong momentum.
A short-term trading strategy
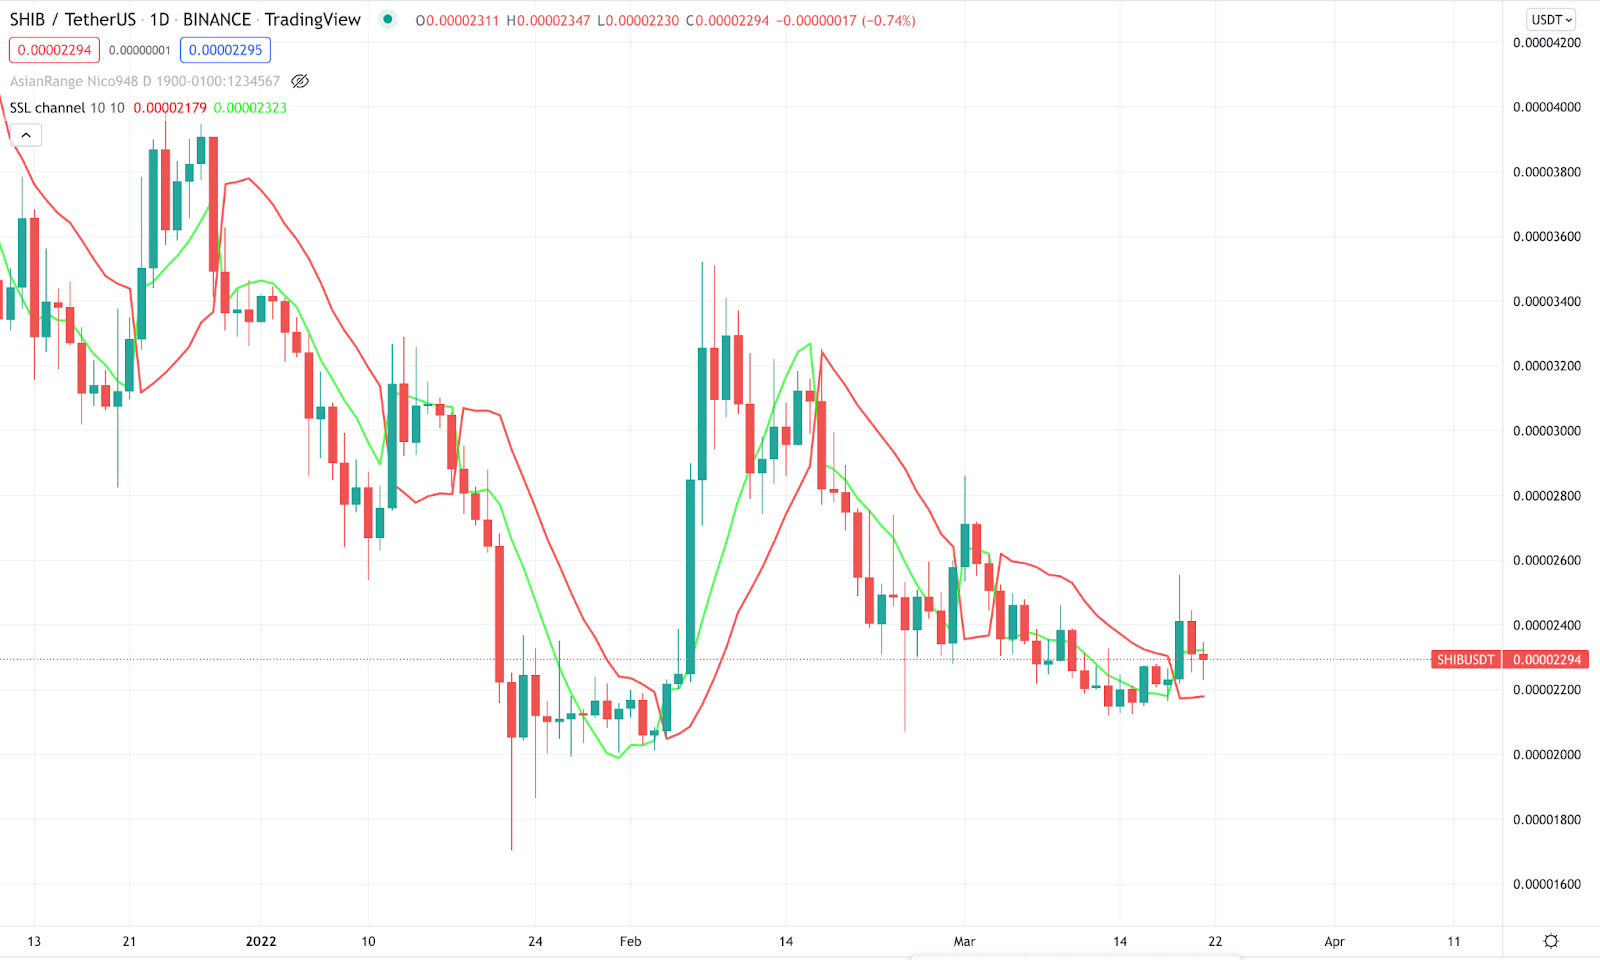
The short-term method applies to large-cap cryptocurrencies; usually, those are not highly volatile. Therefore, we will skip those tokens that show a 30-50% price change in the intraday chart. In that case, focusing on crypto tokens like BTC, ETH, ADA, LTC, etc., would be best for intraday trading.
The above image shows small-cap crypto, where the volatile intraday chart is. You should skip trading this type of price action in the SSL trading method.
Bullish trade scenario
The short-term buy trade is applicable in any timeframe from 1 minute to a 1-hour chart. However, if traders want to close all trades within the trading day, it is better to choose m5 charts.
Entry
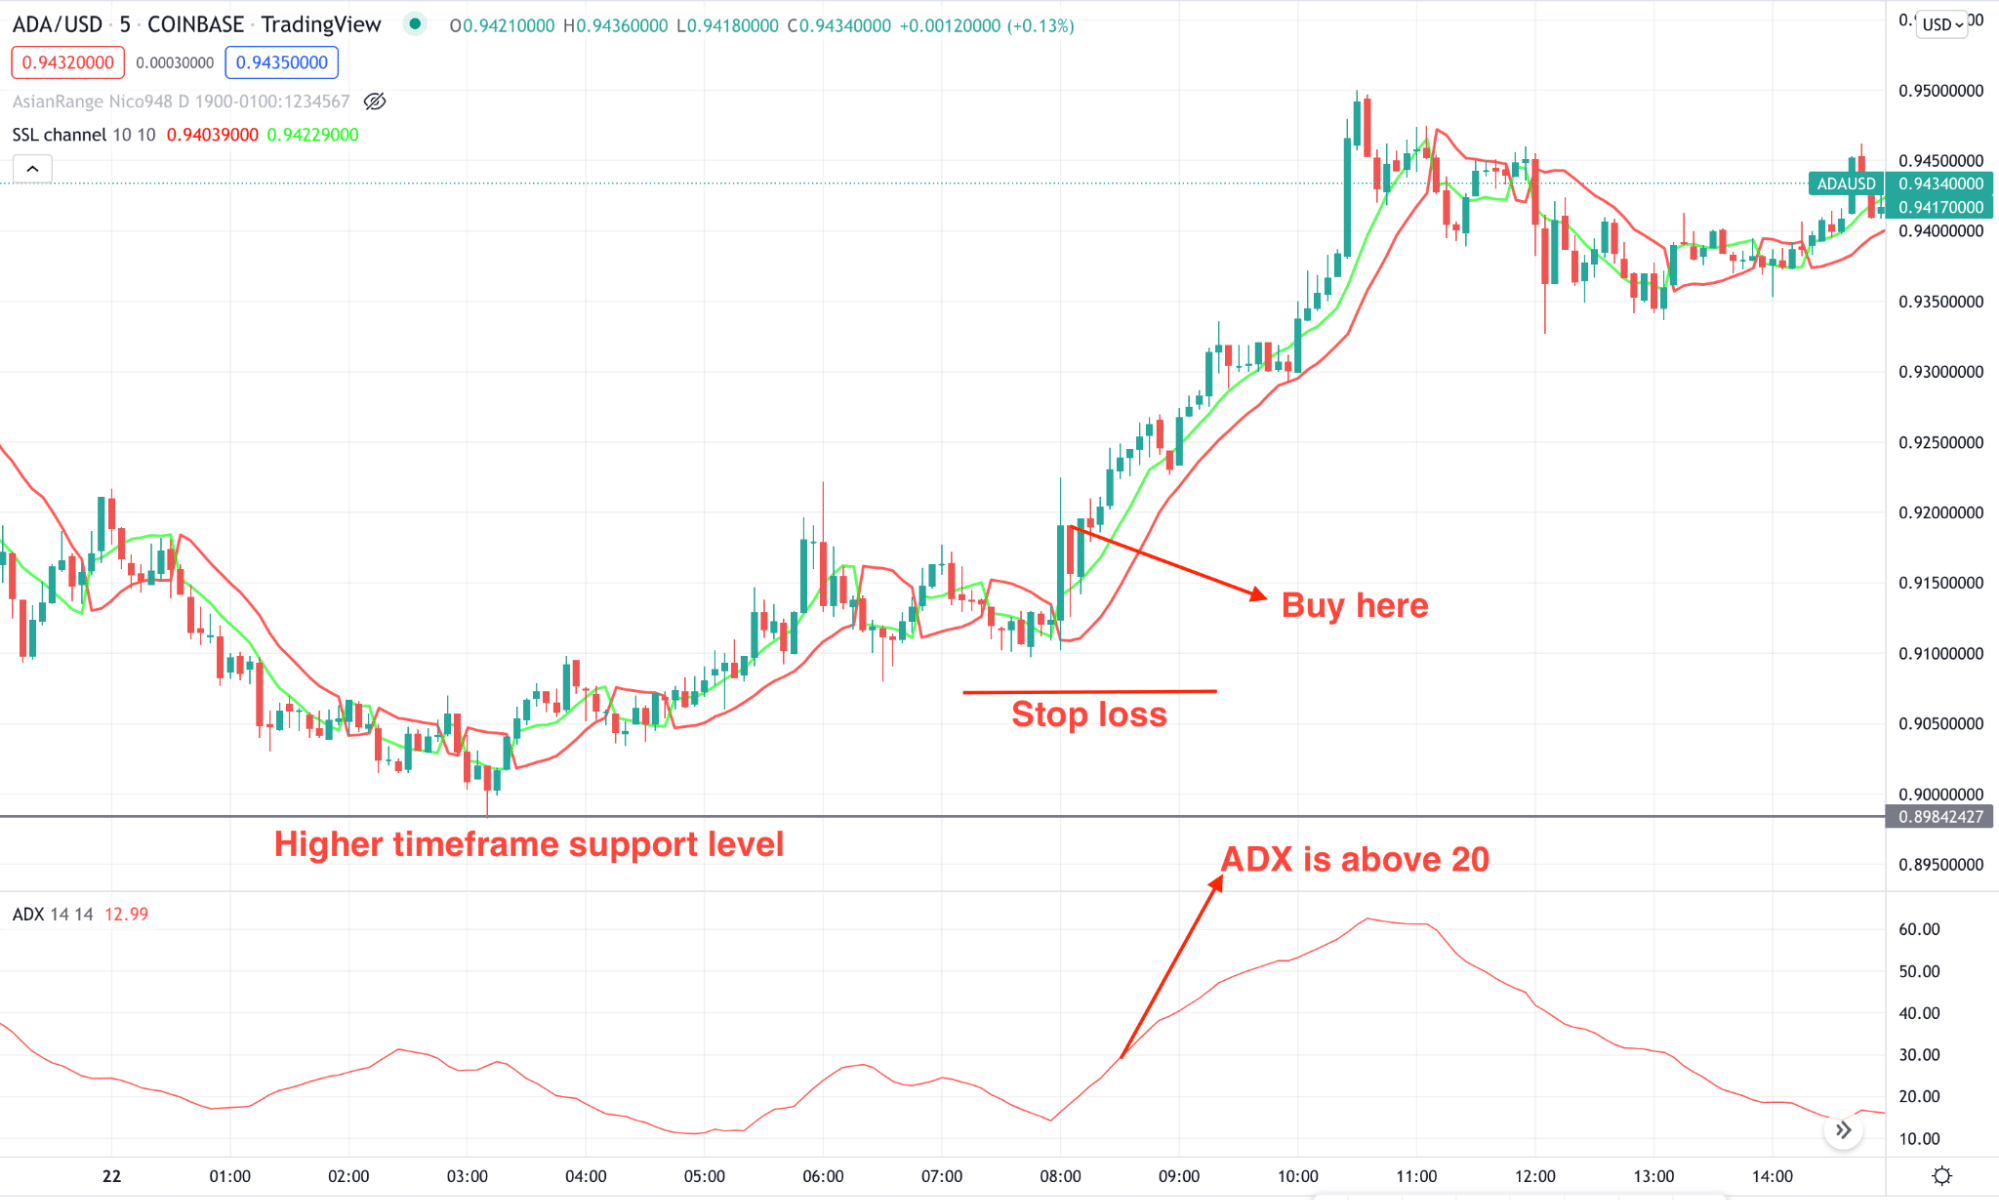
The buy trade is valid once these conditions are present in the price chart:
- The long-term trend, in H1 or H4, is bullish, and the current price is above any significant support level.
- In the M5 chart, the price came lower and showed a rebound.
- The green line crosses the red line and a bullish candle appears above the green line.
- The ADX level is above 20.
Trade management guide
If the buying momentum is strong, you can hold the trade for further gains until it reaches any significant resistance level. Once the trade is active, set the stop loss below the immediate swing low with some buffer. Moreover, you can hold the trade until it provides 2X gain than the stop loss level.
Bearish trade scenario
The bearish trade opportunity is available for crypto CFDs where trades can take short trades. Moreover, spot traders can use this method to find the level from which they should consider a trend reversal.
Entry
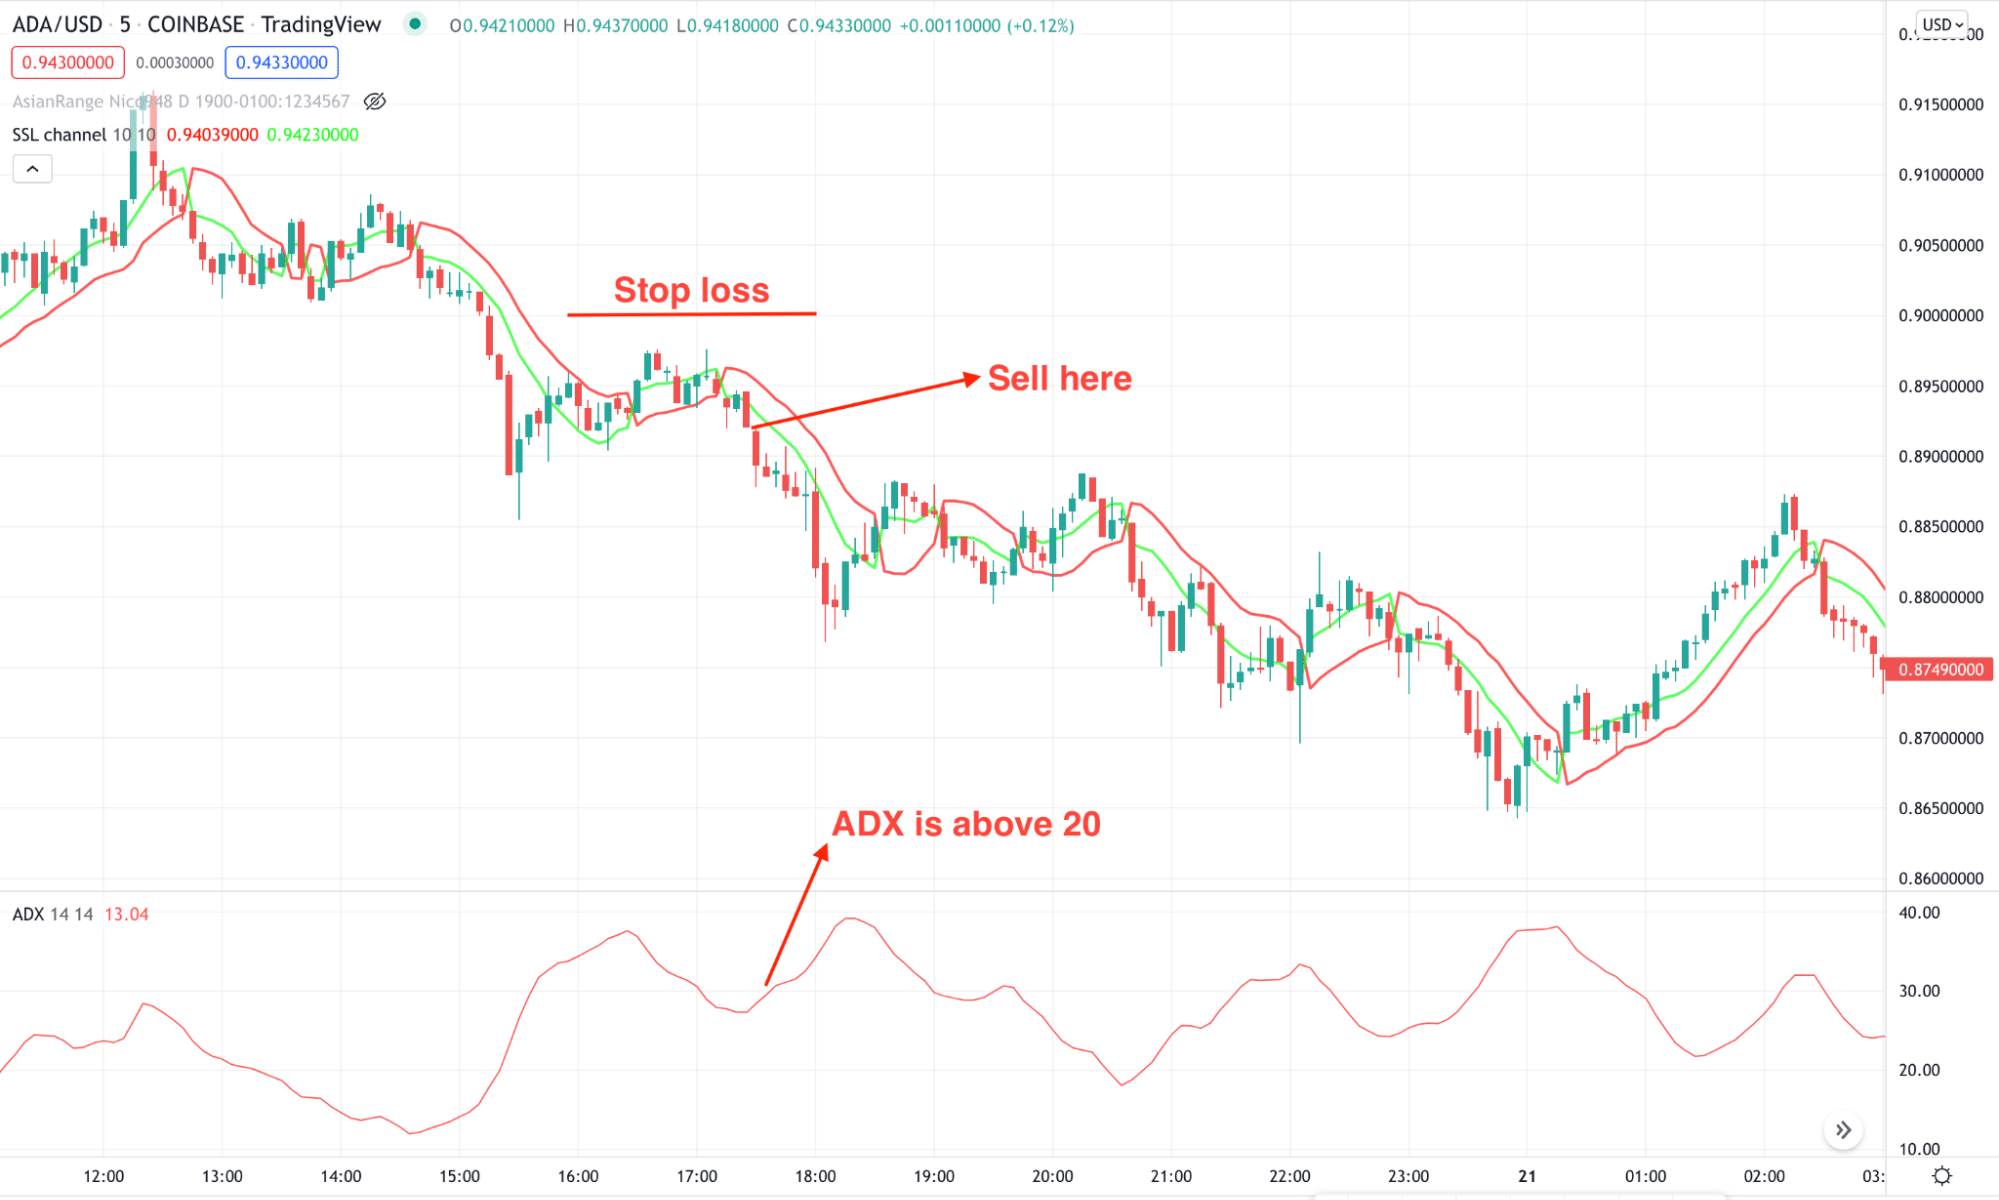
The short-term bearish trade is valid once these conditions are present in the price chart:
- The long-term outlook is bearish, and the current price is above any significant resistance level.
- In the M5 chart, the price corrected higher and showed a rebound.
- The green line crosses the red line on the bearish side, and the price formed a sell candle below the red line.
- The ADX level is above 20.
Trade management guide
The primary stop loss will be above the most recent swing high with some buffer but you can set it above the entry candle to reduce the SL area. On the other hand, the TP is based on the risk vs reward ratio and market pressure from the entry-point.
A long-term trading strategy
The same strategy applies to the long-term approach, but traders should consider where the major trend is heading. The crypto price moves like a zigzag where the bullish possibility is solid once the price reaches any significant support level. Therefore, we are interested in taking trades once the price reaches the support/resistance level and shows a reversal.
Bullish trade scenario
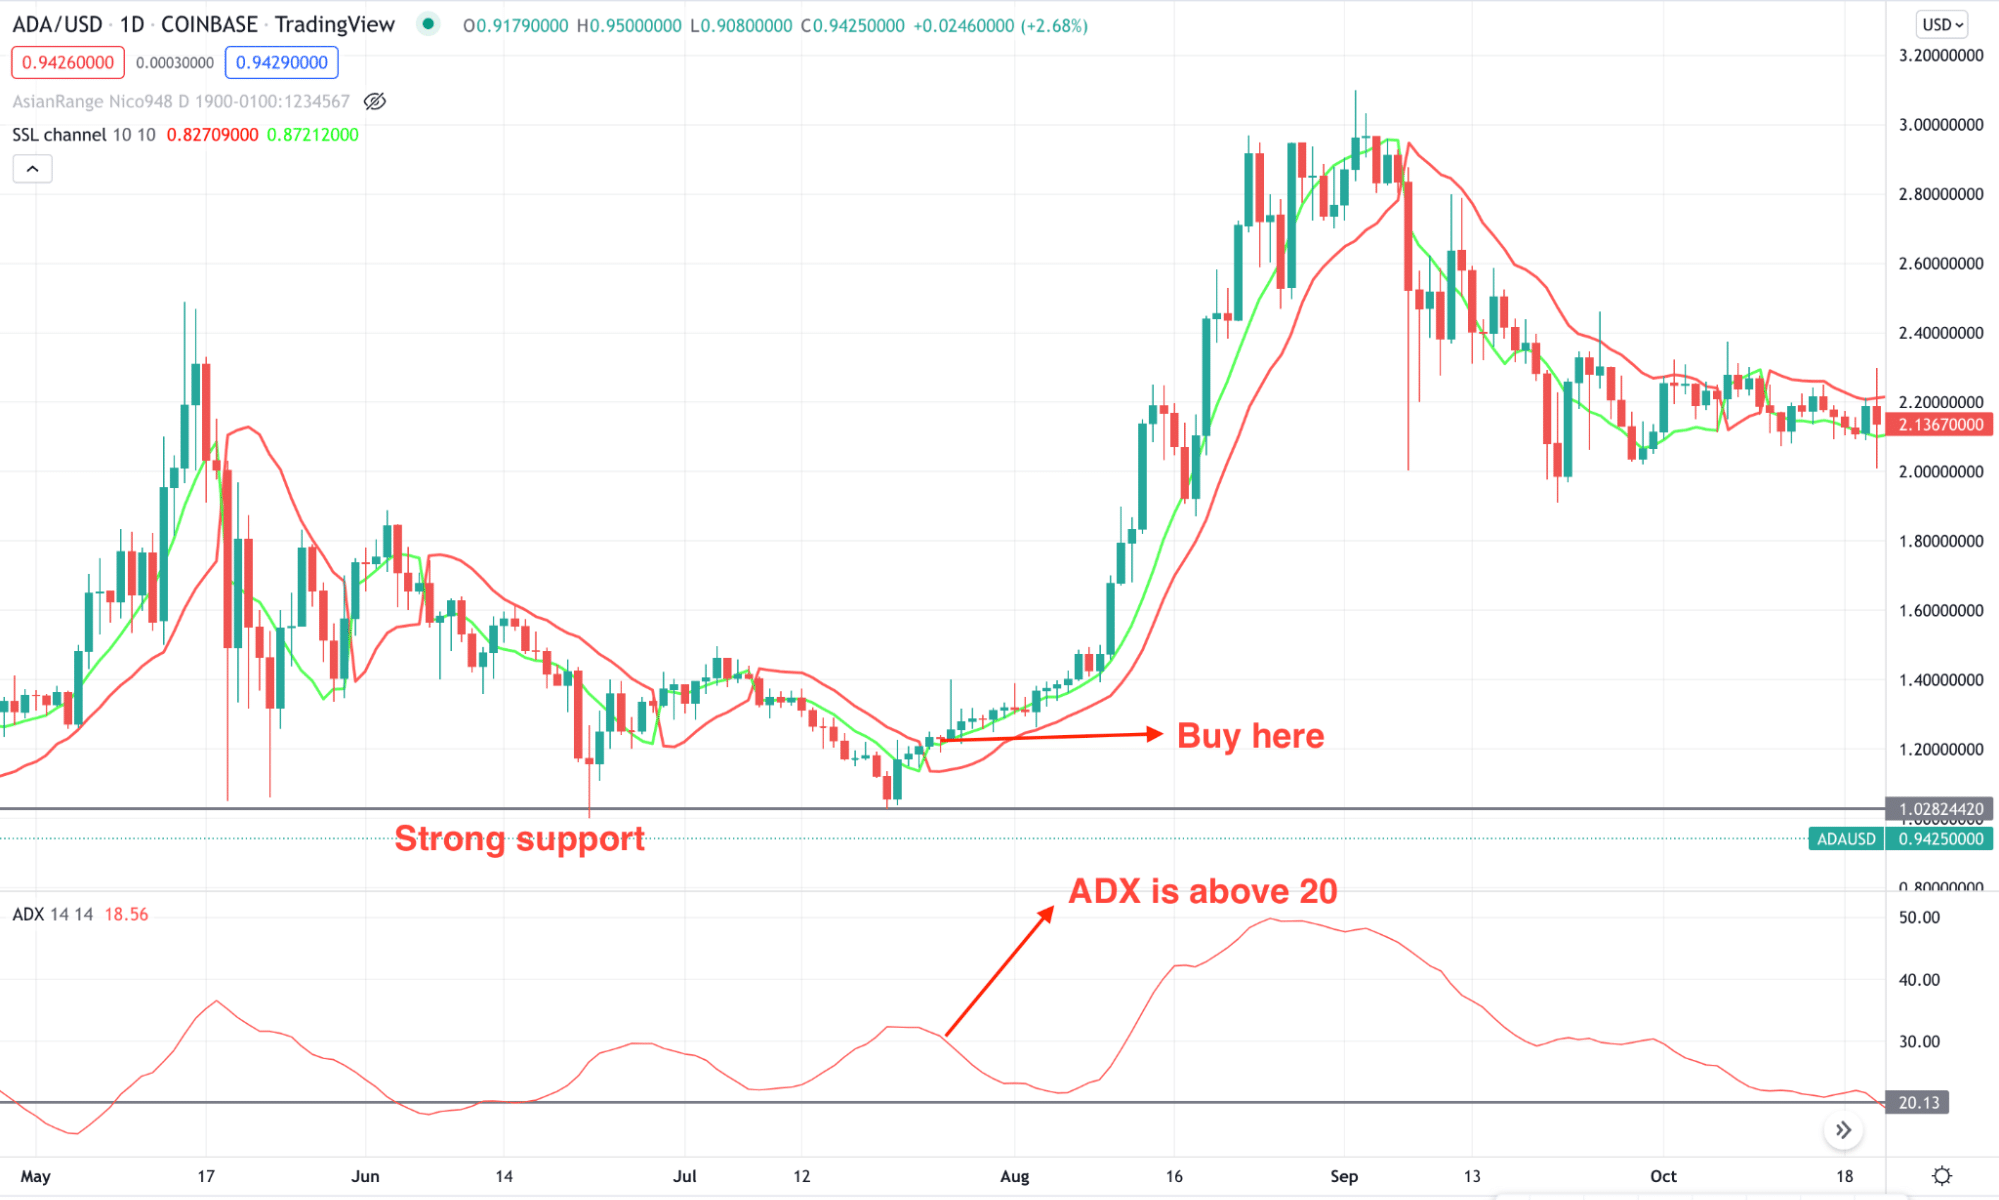
The bullish trade should form at an area where a bearish corrective pressure has come followed by a bullish impulse.
Entry
The buy trade is valid once these conditions are present in the price:
- The price reached the swing low of a long-term bullish trend and found ground at the support level.
- In the SSL indicator, The green line crosses over the red line, and a candle closes above the green line.
- The ADX level is above 20.
Trade management guide
In the long-term perspective, the bullish trade is valid until it shows any significant rejection. Ideally, the bullish momentum is valid as long as it trades above the SSL indicator in the daily chart. After reaching 1:2 RR, make sure to set the stop loss at breakeven to make the trade risk-free.
Bearish trade scenario
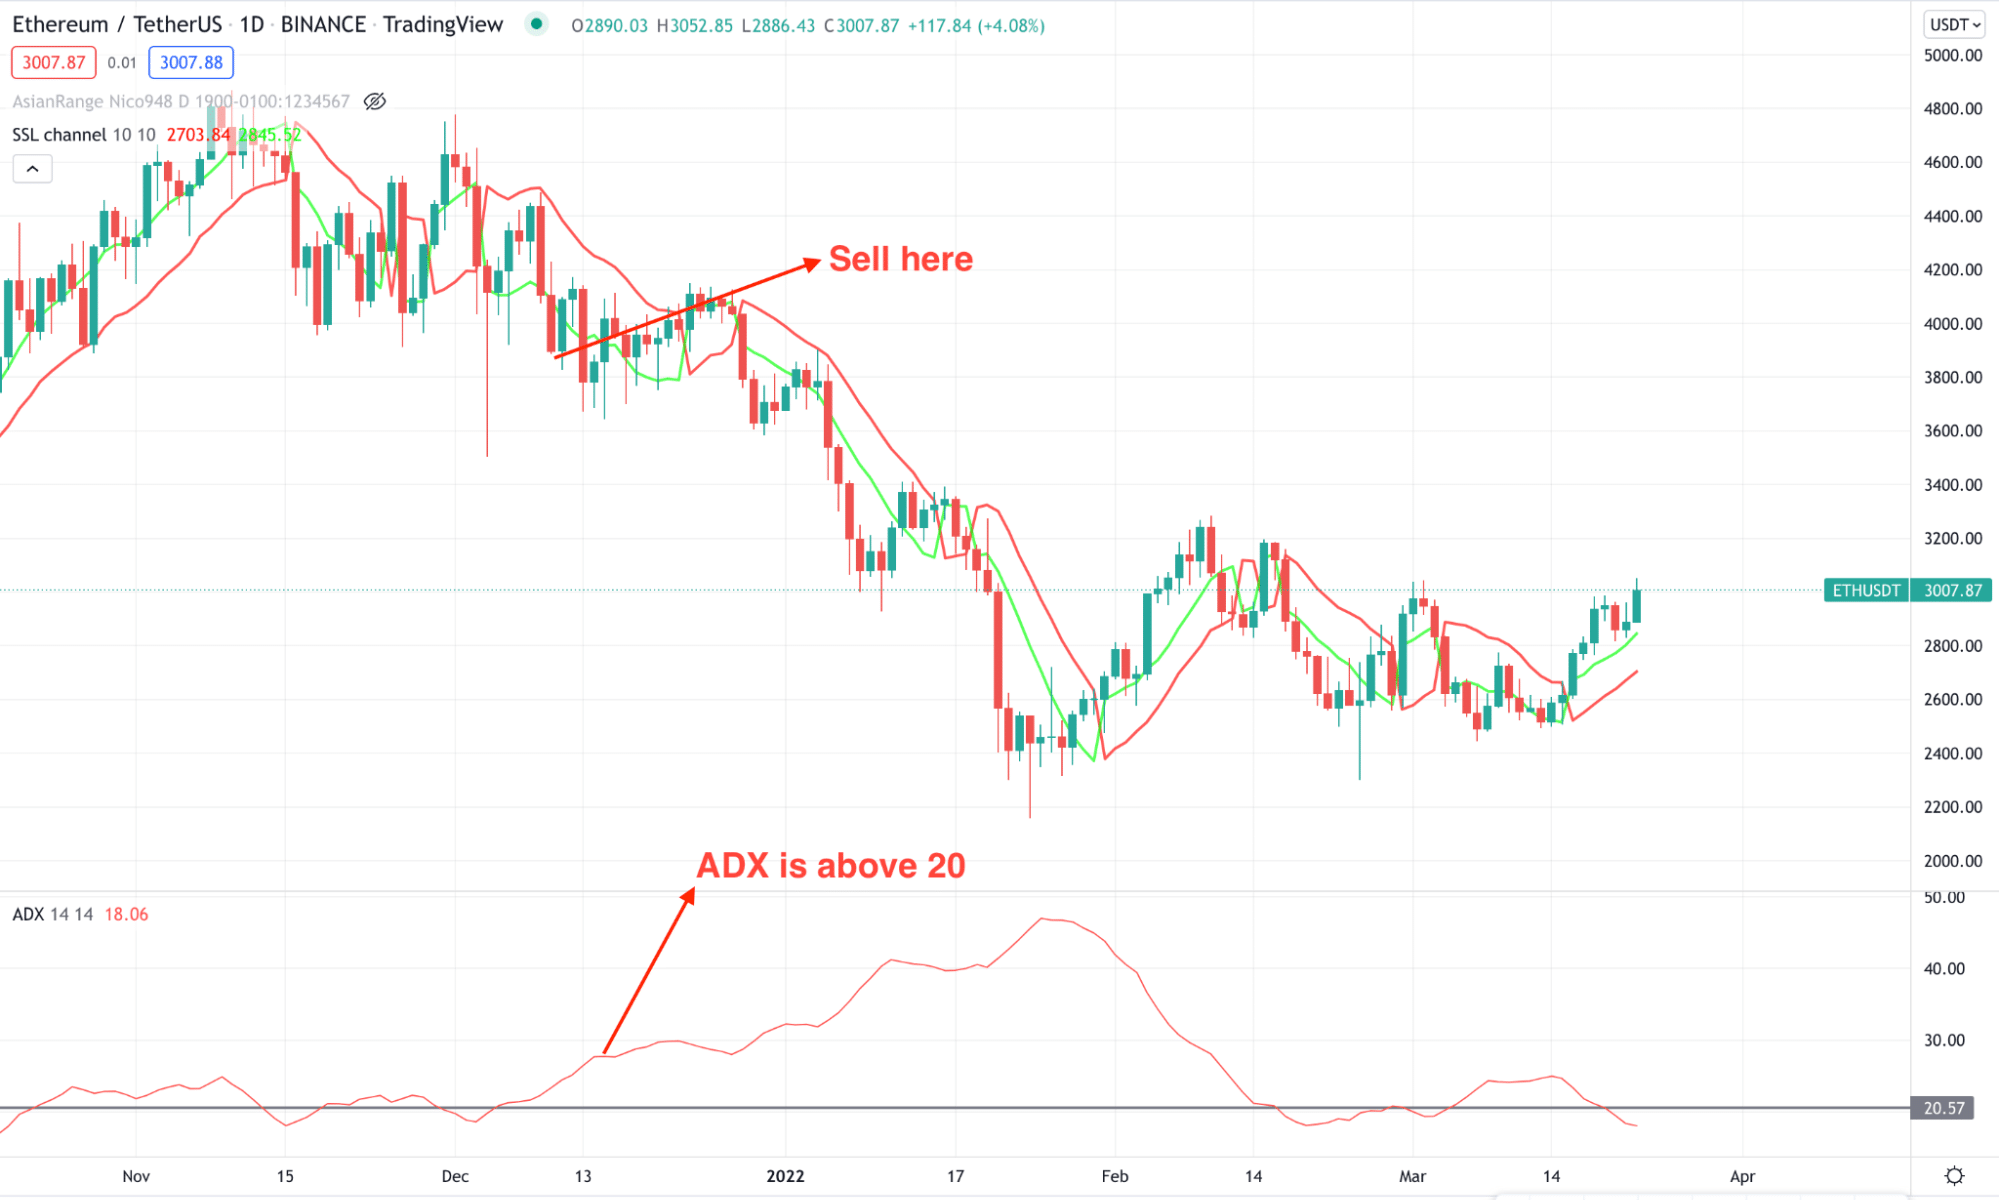
The bearish trade should form at an area where a bullish corrective pressure has come within the long-term bearish trend.
Entry
The sell trade is valid once these conditions are present in the price:
- The price reached the swing high of a long-term bearish trend and found a ceiling at the resistance level.
- In the SSL indicator, The green line crosses down the red line, and a candle closes below the green line.
- The ADX level is above 20.
Trade management guide
The bearish trade is valid until it shows any significant rejection in the long-term perspective. Ideally, the bearish momentum is valid as long as it trades below the SSL indicator in the daily chart.
Pros & cons of the indicator
| Pros | Cons |
|
|
|
|
|
|
Final thoughts
To conclude, we can consider the SSL indicator a robust trading tool to find cryptocurrencies’ buying and selling points. However, like other trading tools, it has some drawbacks that a trader should consider while using it. Therefore, traders who seek to build a portfolio using crypto-assets should consider building a trading portfolio with the SSL indicator.


