

Supertrend indicator is one of the most highly precise trend-following tools. It functions as its name suggests trend-following, which means it does not give buy signals while a trader has a running trend downwards. Traders do not use it most often because they lack knowledge or do not understand the facts about it.
Supertrend runs very smoothly in the trending market regardless of an upward or downward trend. Any changes in market direction can be found effortlessly by using this technical tool. The indicator depicts a buy trade with a green indication if the Supertrend closes below the price, whereas a sell trade is depicted as a red indication. In contrast, the Supertrend closes above the price.
However, the reality is the total opposite; the indicator is pretty understandable for novice traders also, they can grip profitable entries using this indicator.
The following section includes the nuts and bolts of the Supertrend indicator, including the exact buying and selling method from short-term and long-term trading charts.
What is the Supertrend indicator?
The tool helps traders to define the trends and give both buy and sell signals. It can also be applied over different periods, but the smaller periods generate highly frequent signals. The indicator is rested upon ATR (Average True Range). It involves both volatility and defining trends in its single line calculation. It helps traders to identify the trend direction changes and when to put a stop to a position.
The tool provides a highly accurate reading on the running trends created with only two parameters; one is period, the other is the multiplier. At the time of creating this efficient indicator, the default ATR value was set at 10 with its multiplier of 3.
How to identify trades using the Supertrend indicator?
Identifying trades by using this tool is very handy. The positions for buying and selling can be defined effortlessly with this indicator flipping over closing prices. The Supertrend closing under the prices generates the buy trades and the green line indication. On the contrary, sell signals are generated when Supertrend closes above the prices and its line changes to red.
Though the Supertrend functions commendably in trending markets yet generates false signals when it comes to the sideways market, it still manages to keep it less number of false signals compared to different other indicators. No technical indicator can provide 100% accuracy, and the Supertrend is not different in this term. Hence, applying the Supertrend combined with other indicators will boost the potential for better signals.
A short-term trading strategy
The indicator is one of the best tools, providing high accuracy trades in a lower time frame. A market participants can identify trades using the indicator to gain small profits. Also, it is beneficial to identify the shorter swings in the market.
Moreover, adding the other indicators and methods is the initial move towards a strong trading framework as getting conversion of trading signals around a lower time frame builds up the conviction. That’s why we will add the Stochastic Oscillator indicator to increase our accuracy in a shorter time frame. However, we will look for trade at only the M5, M15, and H1 time frames for this short-term trading strategy.
Bullish trade setup
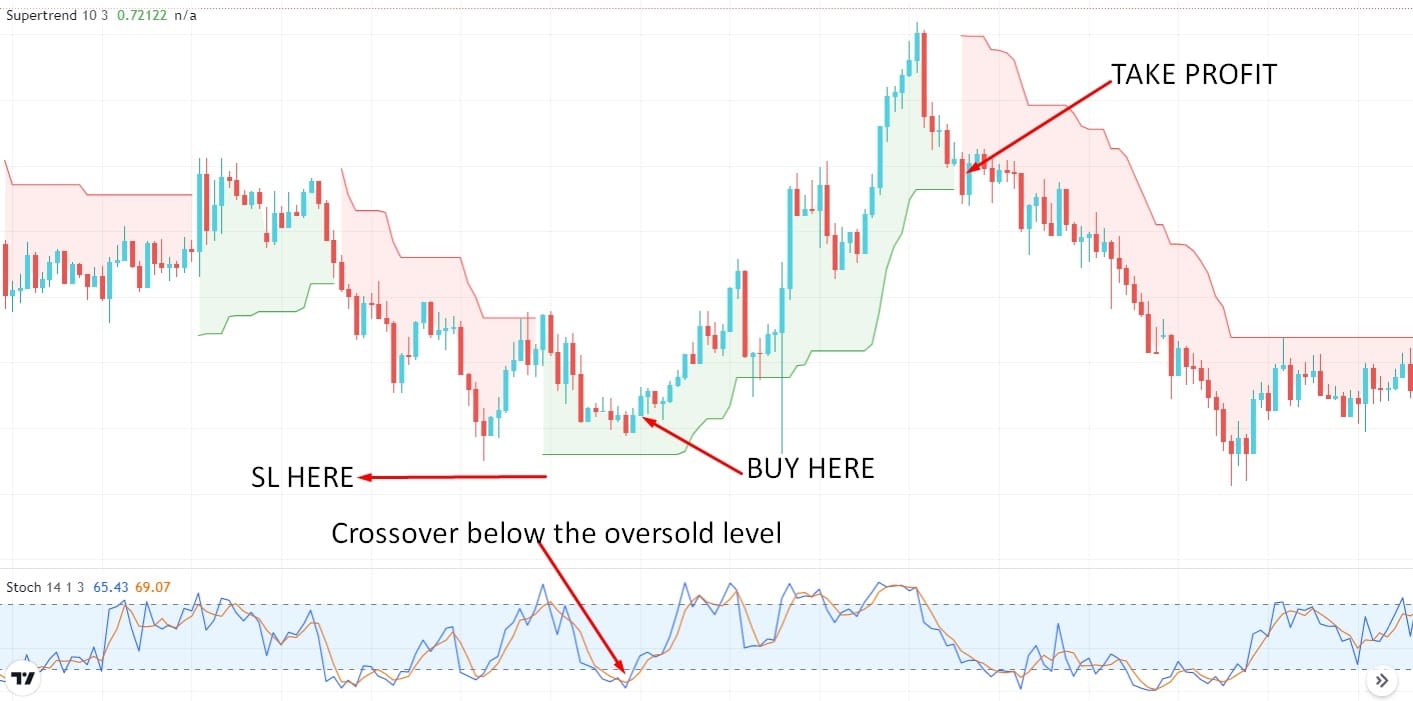
Entry
Look for a buy entry when the indicator becomes green in color. Place a buy order when the Stochastic Oscillator had a bullish crossover below the oversold level 20.
Stop loss
Put the stop loss below the last swing level with at least 5-10 pips buffer.
Take profit
Take the profit when the indicator becomes red in color. Or else, you can take the profit by calculating the 1:3 risk/reward ratio.
Bearish trade setup
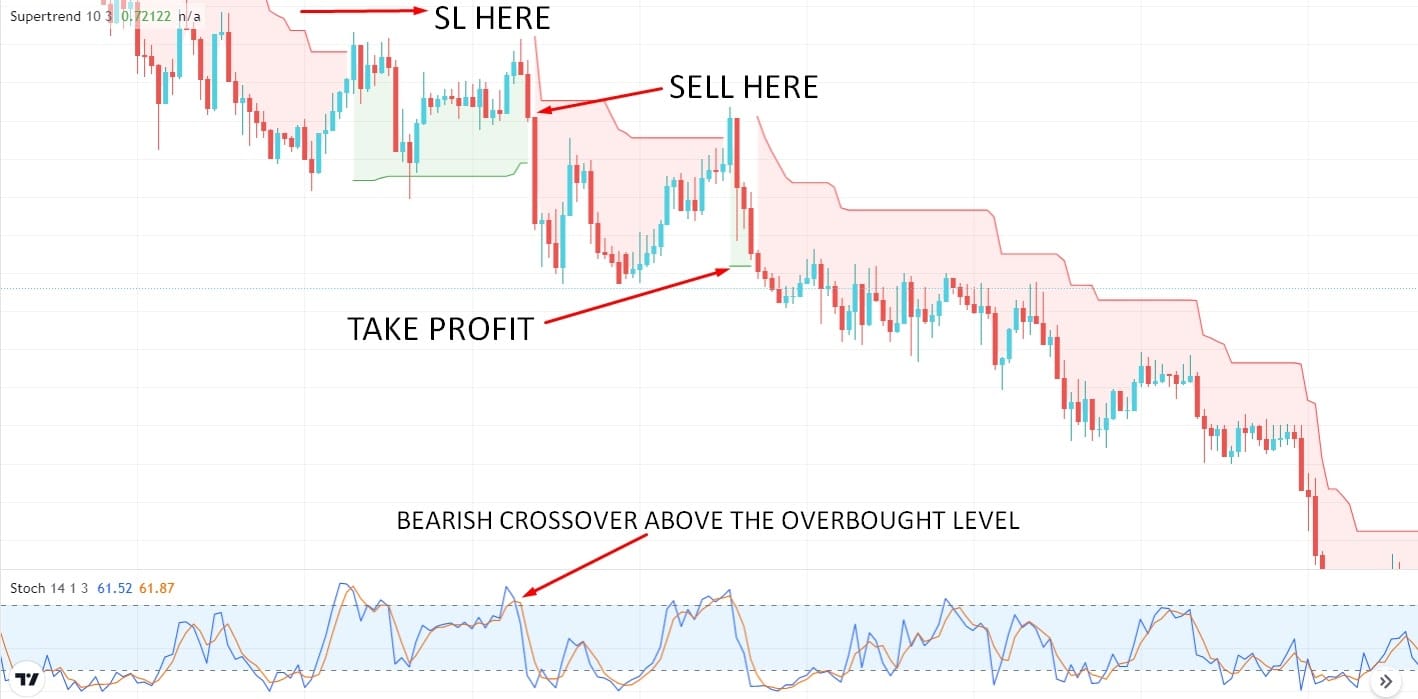
Entry
Look for a sell entry when the indicator becomes red in color. Place a sell order when the Stochastic Oscillator had a bearish crossover above the overbought level 80.
Stop loss
Put the stop loss above the last swing level with at least 5-10 pips buffer.
Take profit
Take the profit when the indicator becomes green in color. Or else, you can take the profit by calculating the 1:3 risk/reward ratio.
A long-term trading strategy
The system is mainly based on the simple trend-following method. This indicator strategy is the most reliable because it gives an idea of the market’s overall structure in the long run.
Firstly, we must identify the market structure using the 20 EMA. After that, we will look at the indicator to signal to ride the trend. However, we will look for trade at only the H4, D1, and W1 time frames for this long-term trading strategy.
Bullish trade setup
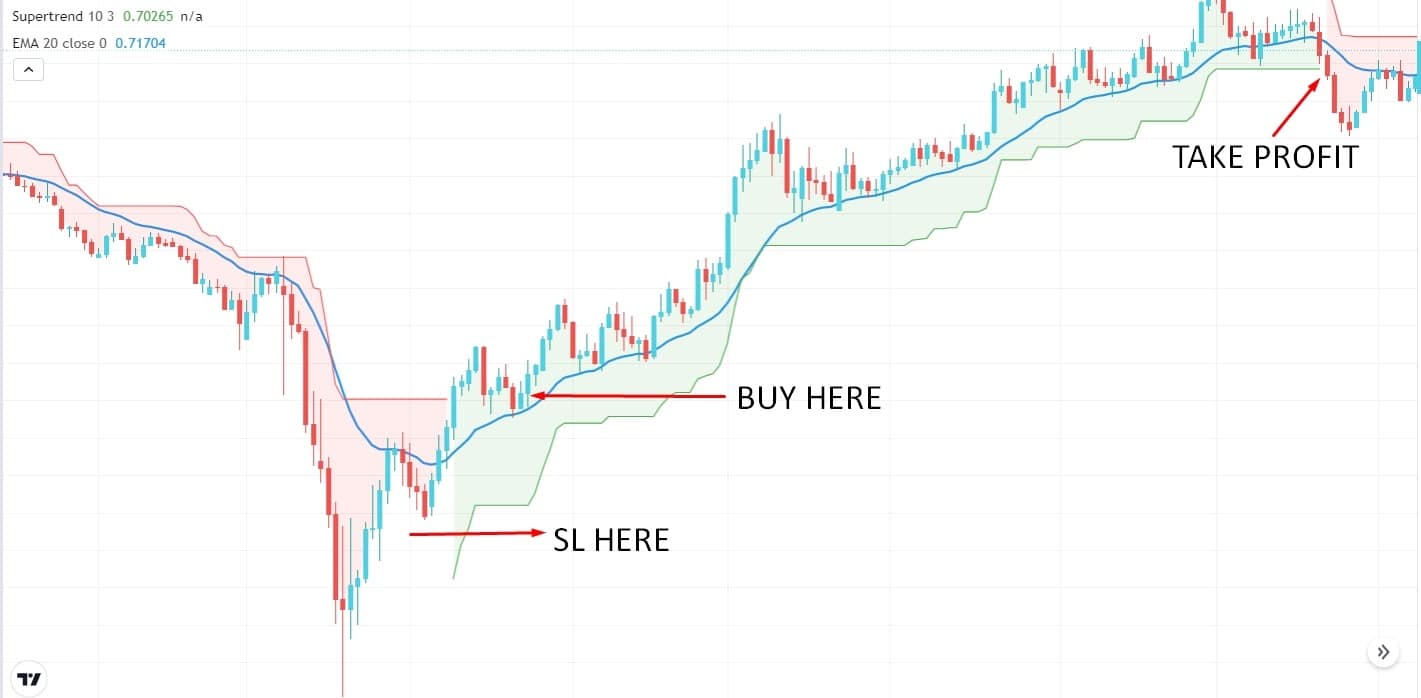
Entry
Enter a buy trade when the price broke above the dynamic level of 20 EMA, retraces back to it, and has a bullish close. Also, the indicator turns green.
Stop loss
Place the stop loss order below the last swing level with a 10-15 pips buffer.
Take profit
Take the profit by calculating at least a 1:3 risk/reward ratio. Otherwise, you can ride the trend by targeting the next resistance level.
Bearish trade setup
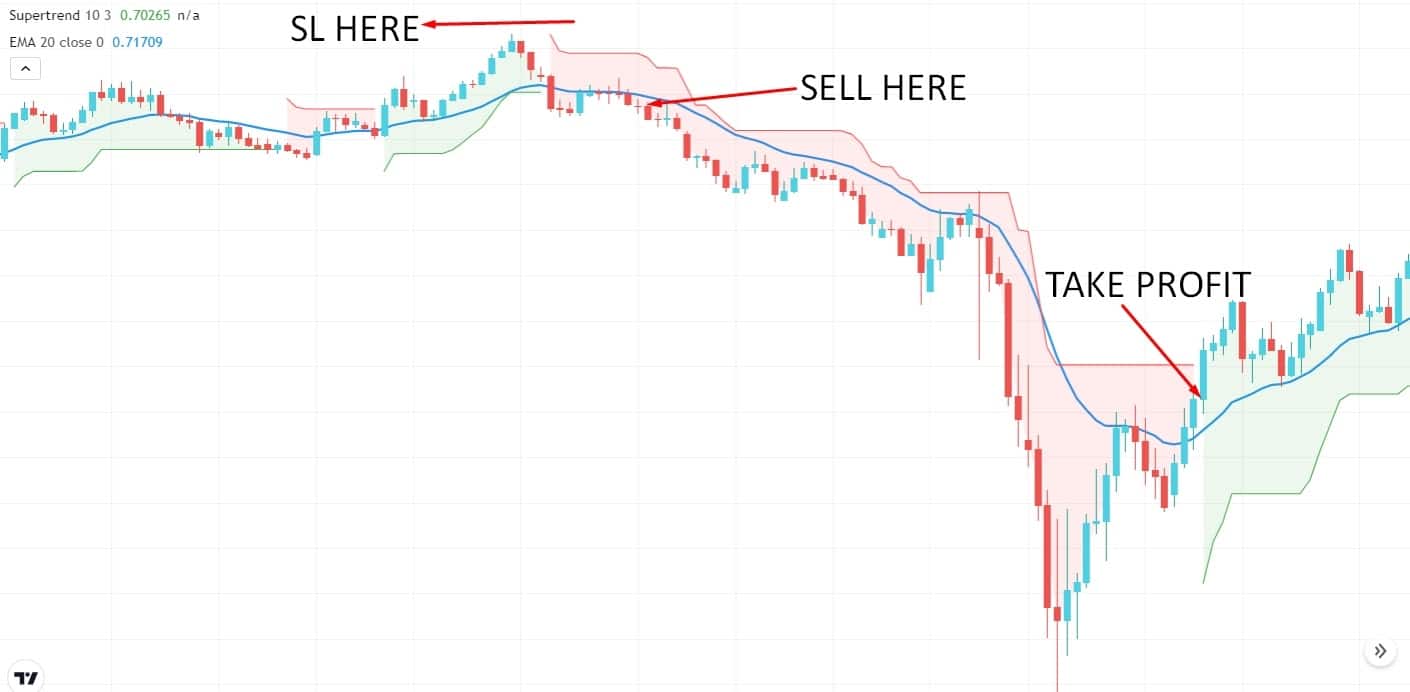
Entry
Enter a sell trade when the price breaks below the dynamic level of 20 EMA, retraces back to it and has a bearish close. Also, the indicator turns red.
Stop loss
Place the stop-loss order above the last swing level with a 10 – 15 pips buffer.
Take profit
Take the profit by calculating at least a 1:3 risk/reward ratio. Otherwise, you can ride the trend by targeting the next support level.
Pros & cons
| Pros | Cons |
| An indicator is a handy tool for traders. | Sometimes it can confuse traders with false signals. |
| It works best on the FX market. | This indicator does not work well on the side-way markets. |
| Highly accurate trading signals. | The indicator is only able to give signals on the trending market. |
Final thoughts
To conclude, the Supertrend indicator plays a role of being robust support and resistance since it moves in both directions. Besides, it may give tracking on stop-loss of the running trades.
The Supertrend can be efficient as a selling opportunity or the other way round. Traders will be rapidly able to define the trends, whether upward or downward. Also, it may be more beneficial to traders if the stop-loss is set by using this indicator.