
The stop loss (SL) defines the risk on a trade. Without an SL, you might lose more than the contemplated amount on a losing trade or, worse, suffer a massive drawdown. Even before entering a trade, you should know exactly where you will place the trade’s stop loss. Otherwise, you cannot determine the lot size, which is often a percentage of your account balance. Trading without understanding the risk per trade and the overall exposure is gambling.
Typical stop loss locations
In this article, you will learn about four ways to specify the SL of your trade. Most traders use these methods to varying degrees. If you are a beginner, you can start with these standard practices until you find your way.
№ 1. Beyond support or resistance zone
Every trader would agree that current support could become later resistance and vice versa. Support and resistance principle is an essential concept in technical analysis as it underpins most trading strategies. With this concept, you can identify trading opportunities with a greater degree of success.
Apart from trade identification, the support and resistance concept enables you to set the SL of trades. Perhaps you have realized that the support-resistance tool is more a zone than a level. When drawn correctly, you can put your stop loss on the other end of the area when you trade in one market direction.
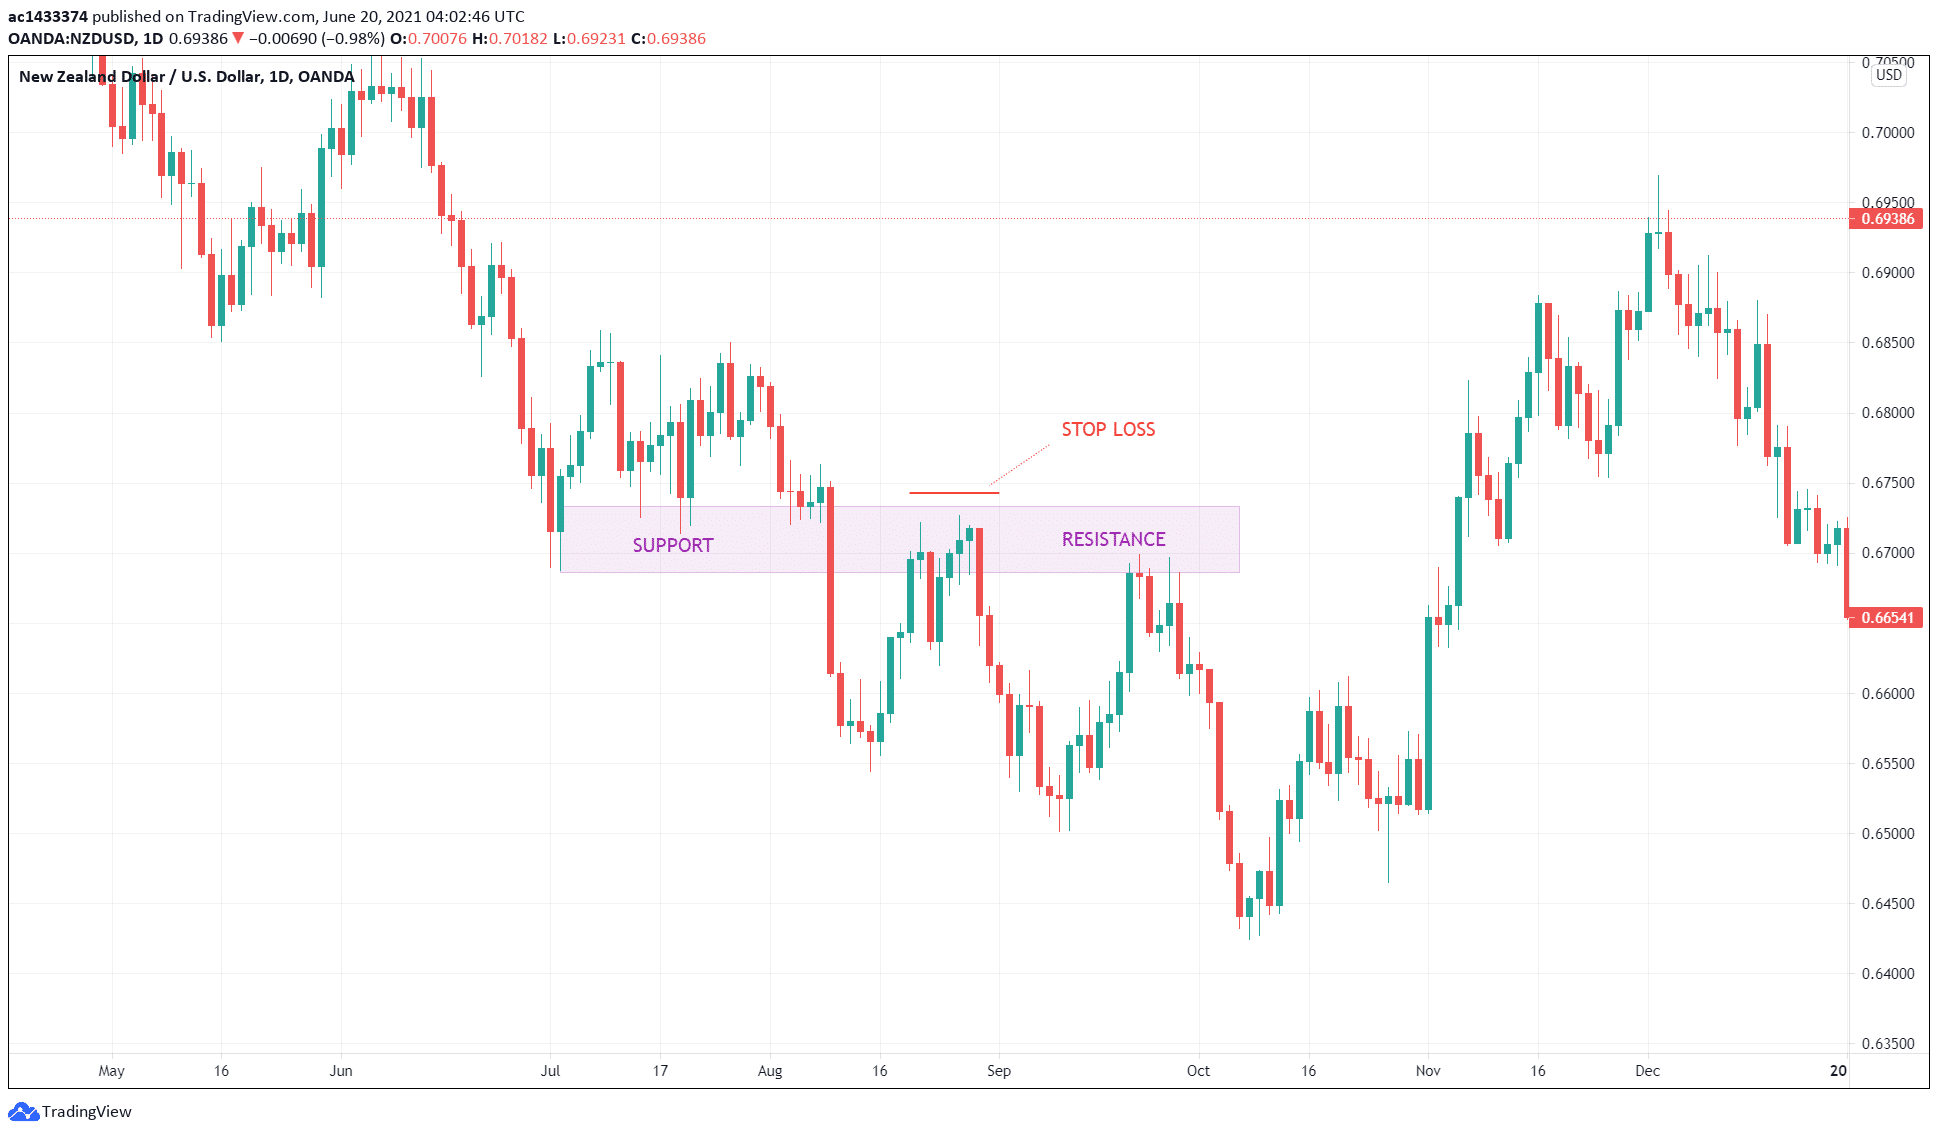
When using the zone for SL placement, you have to draw the spot using a rectangle, as shown in the above NZD/USD daily chart. There is always a degree of subjectivity when drawing the support-resistance area. The best policy is to cover an evident swing low or swing high to the close prices of a group of candles. With practice, you can get better at drawing these zones.
In the above chart, you expect a sell trade after the price breaks down the support area and then returns to test the area that has become resistant. One type of entry you can use in this situation is to initiate a sell position when the price broke down and closed below the zone. Then you place your stop loss a few pips above the zone.
№ 2. Beyond a swing point
You can set your SL to the recent swing point when you trade a pullback strategy. This strategy attempts to deal with the prevailing trend, but only after a pullback of some kind. This method assumes the continuation of a trend after the market absorbs new orders.
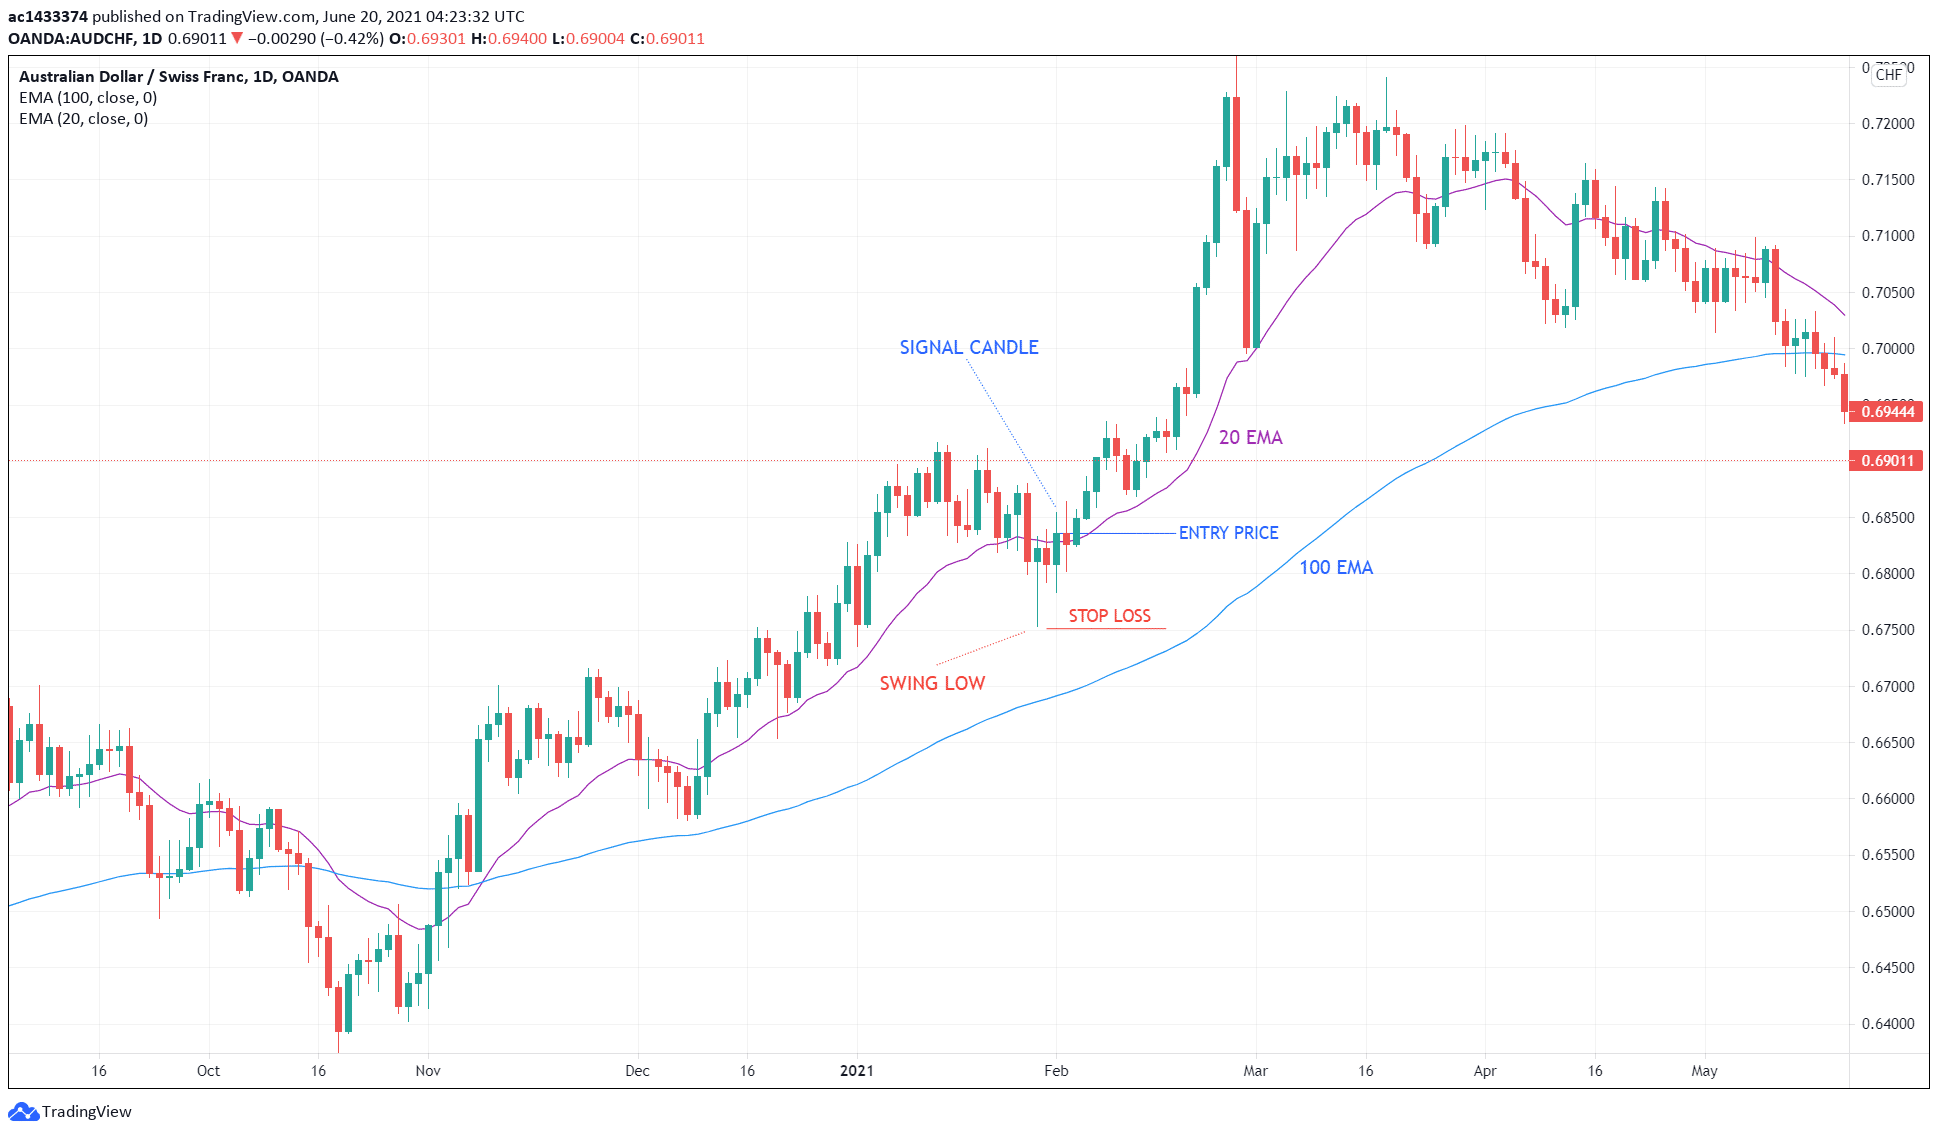
The above daily AUD/CHF chart shows an example of a pullback strategy. It makes use of 100 EMA to define the trend and 20 EMA for entry after a brief pullback. In the situation shown in this example, putting the stop loss to the nearest swing low is the best strategy.
Often you can initiate a trade on the next candle after the signal candle closes. Since the trend here is bullish, we need a bullish candle to break and close above the 20 EMA. You could have taken an initial entry from a similar setup that occurred a few candles earlier. You can apply the same entry strategy in this earlier setup.
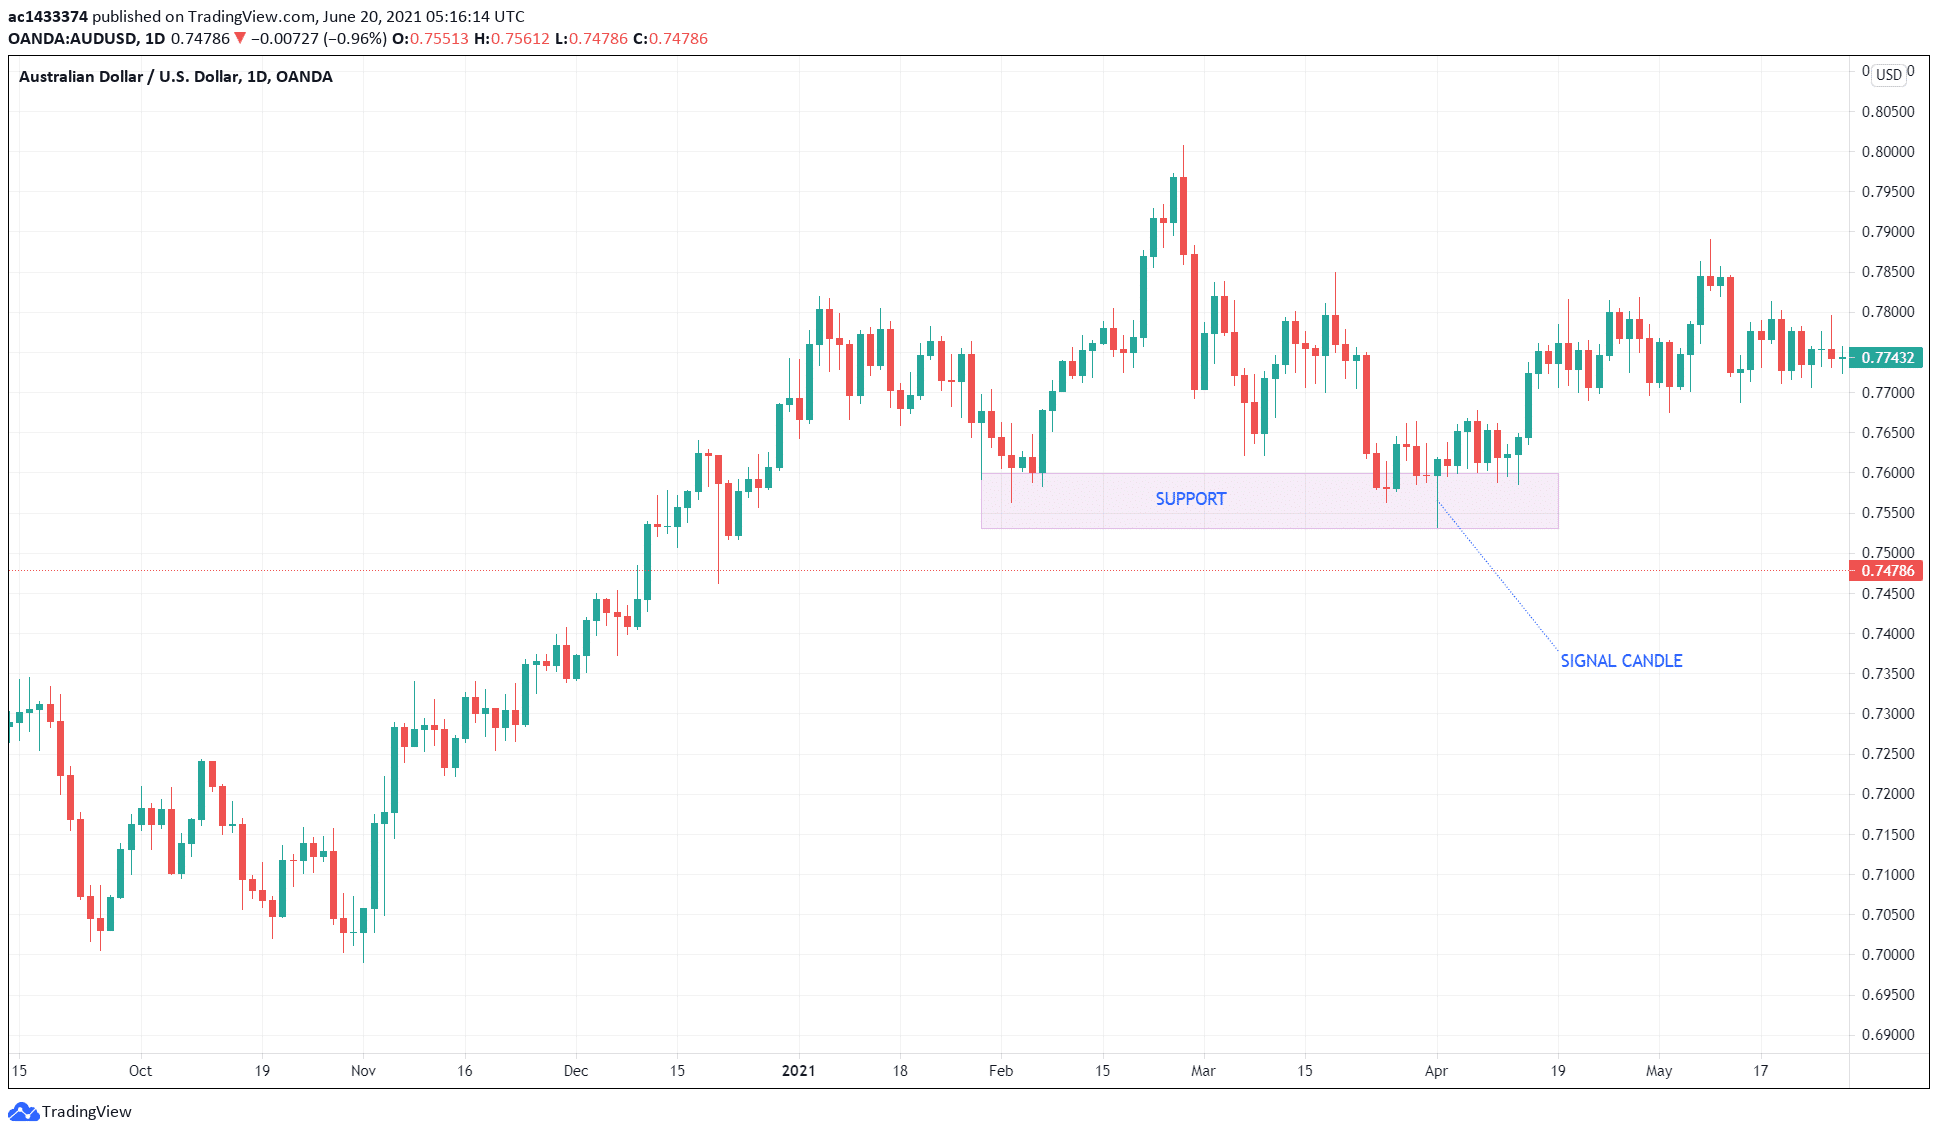
№ 3. Beyond candlestick formation
Price action traders, particularly those trading candlestick patterns, often use this SL method. Check out the above AUD/USD daily chart for illustration. The support area was obvious after the price touched the area a second time. You can draw the rectangle from the low of the bullish pin bar to the close prices of candles with shadows.
You can take a buy trade at the open of the next candle, which is often equal to the close price of the previous candle. In this situation, you could have taken the trade when the bullish pin bar showed up. The best SL location of this trade is undoubtedly the low of the signal candle.
This is only one example of scenarios where setting the SL beyond a candle formation is the best option. You can use the same strategy with other candlestick formations, such as the following:
- Inside bar
- Evening star and morning star
- Engulfing candle
- Two-bar reversal
- Piercing line and dark cloud cover
- False break
To give the trade more chances of success, make sure that you use the stop loss strategy in conjunction with horizontal support and resistance. If the price goes against your trade and takes out your stop loss, it means that the market is not willing to go in your direction. Just take your loss and move on. At other times, the market is just choppy and would take you out only to move in your direction later. During normal conditions, you can expect this type of entry to work more often than not.
№ 4. ATR multiple from an entry point
Other traders use the true average range (ATR) indicator to define the trade risk. Once a trade is taken utilizing any entry type, you can set the SL to a price that is two times the ATR value from the entry price.
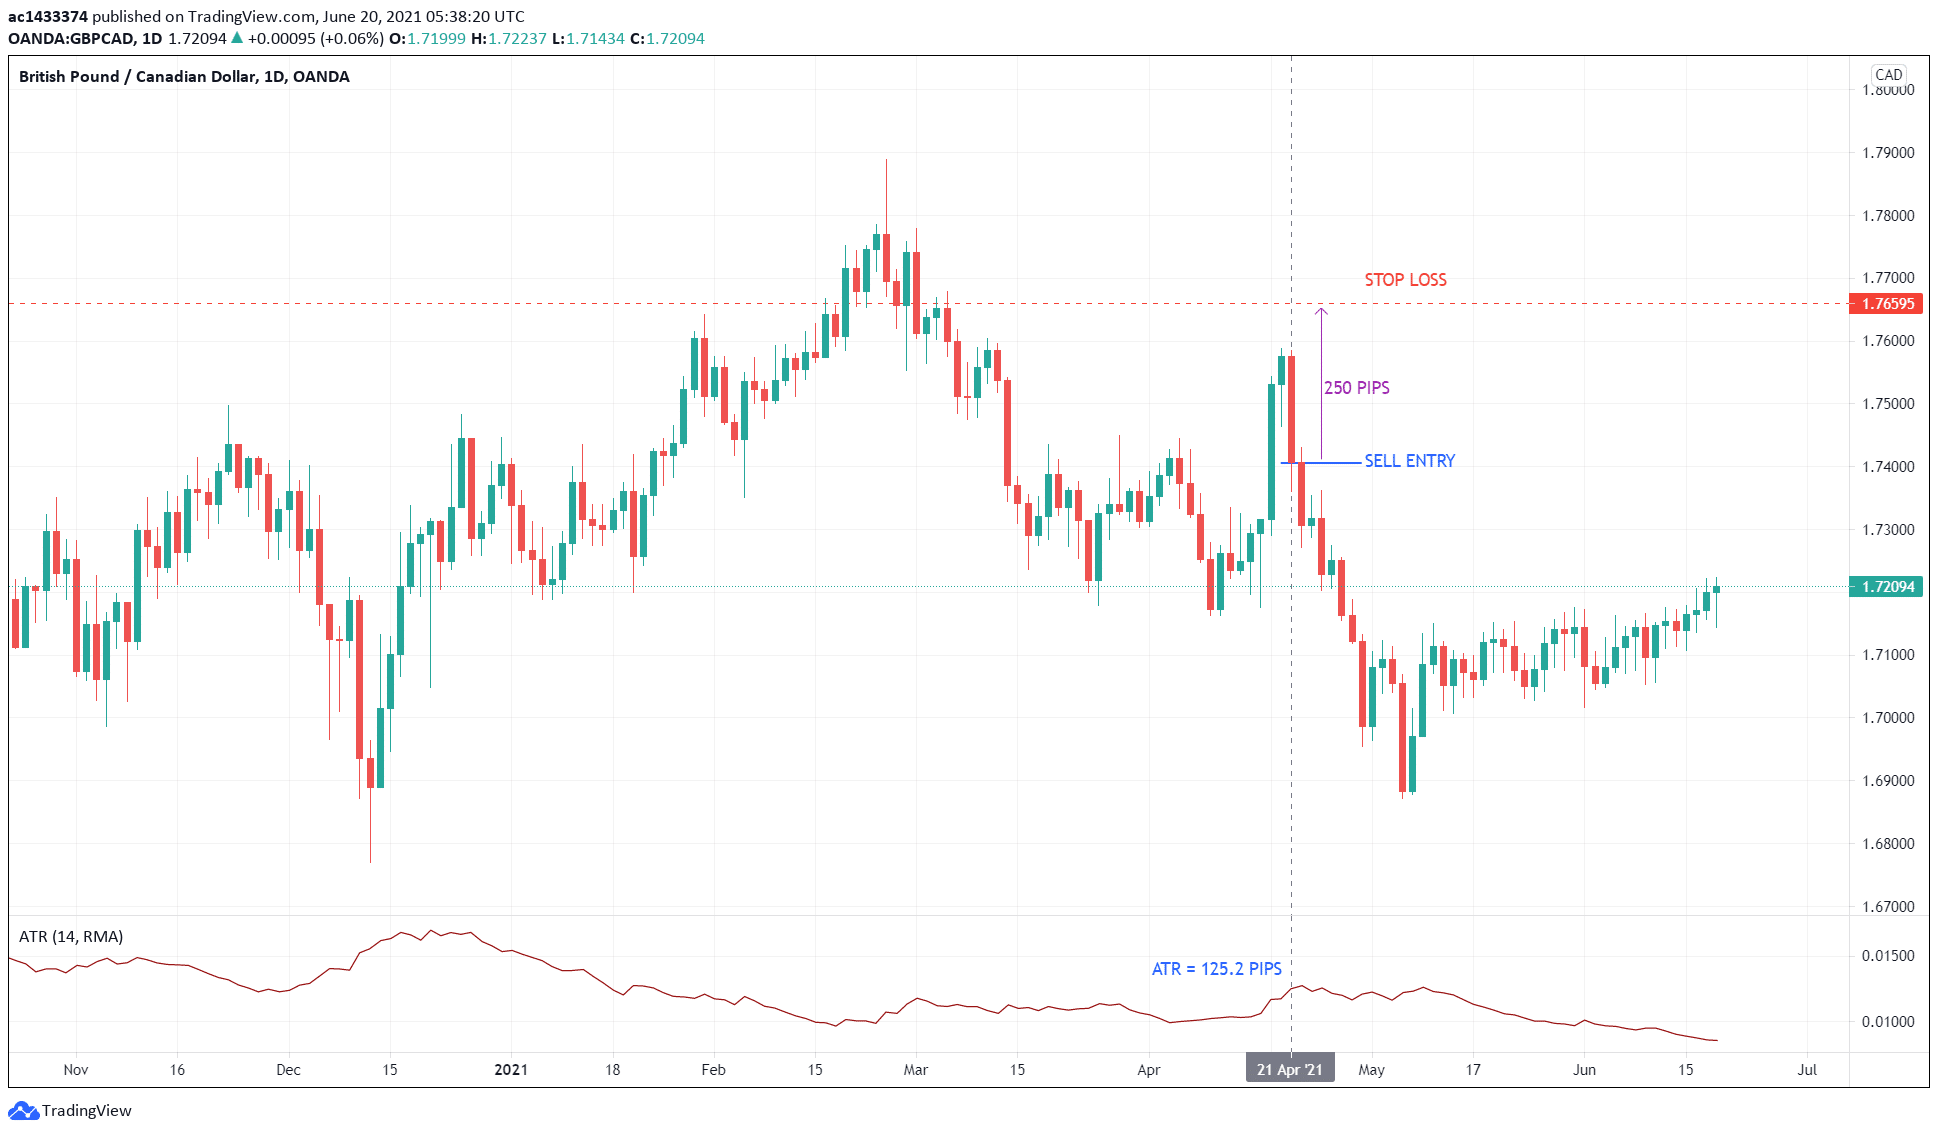
Refer to the above GBP/CAD daily chart, for example. So this is how you should set the stop loss of a sell trade. This assumes you take short when a big bullish candle engulfs the previous green candle. This means that you open a sell trade at the close of the big red candle.
Looking at the ATR indicator, the ATR value corresponding to the signal candle is 125.2 pips. Multiplying the ATR by two, you will get approximately 250 pips. Therefore, your SL is 250 pips above the entry price. The current SL price is 1.76595.
Of course, in this case, you can also set the stop loss a little beyond the high of the engulfing pattern. Take note that the signal candle engulfs the small green candle. If you have experience using the support-resistance tool, you might have figured out that there is resistance near the area where the engulfing pattern formed. In this example, though, the resistance area is not too obvious to see.
Final thoughts
Setting the stop loss might not sound exciting to traders. Most traders think about profits. That explains why most lose money in trading. If you want to succeed, think differently from the crowd. Control the risk on each trade and manage the exposure of your overall account. Profits will come to you ultimately if you stay in the game long enough. This happens when the edge of your strategy finally plays out.