
If you are interested in finding a trend continuation pattern, triangle trading would be the best option. It can explain what market participants are taking a rest and from where they may resume the momentum.
Triangle pattern trading includes a deep knowledge of trading using technical tools and price action. The overall process uses a systematic approach where the opening and closing of trade depend on implementing your knowledge. Let’s become masters in triangle trading by reading the following section.
What is triangle pattern trading?
It is a price behavior where both bulls and bears start to decrease the trading activity. As a result, the price moves in a narrow space instead of making new highs and lows.
What triangle pattern says about the market?
The first step of a triangle pattern is indecision. When bulls and bears become confused about the market, they wait to see the price come in a reliable direction. Meanwhile, due to the absence of buyers and sellers presence, the price starts to squeeze in a level without creating new highs or lows.
However, in some cases, a triangle pattern may come with equal lows and lower highs or equal highs or higher lows. This price pattern is a significant trend indicator where the previous momentum is more likely to continue in the current direction.
Therefore make sure to follow the below-mentioned concept while trading the triangle system:
- In the bear market, it indicates the continuation of the existing sell trend.
- In the bull market, it indicates the continuation of the existing bull trend.
How to identify the triangle pattern?
The first sign is that the triangle should appear after a certain movement. Therefore, find an ascending triangle and focus on the buy trends only. Conversely, the descending triangle appears in a bearish trend, while the symmetrical triangle appears in bullish and bearish trends.
After finding the trend, investors should focus on where the correction may happen. The correction after a trend is the profit-taking and order-building phase that appears in the chart with less trading activity.
Let’s see the illustration of different triangle patterns in the financial market.
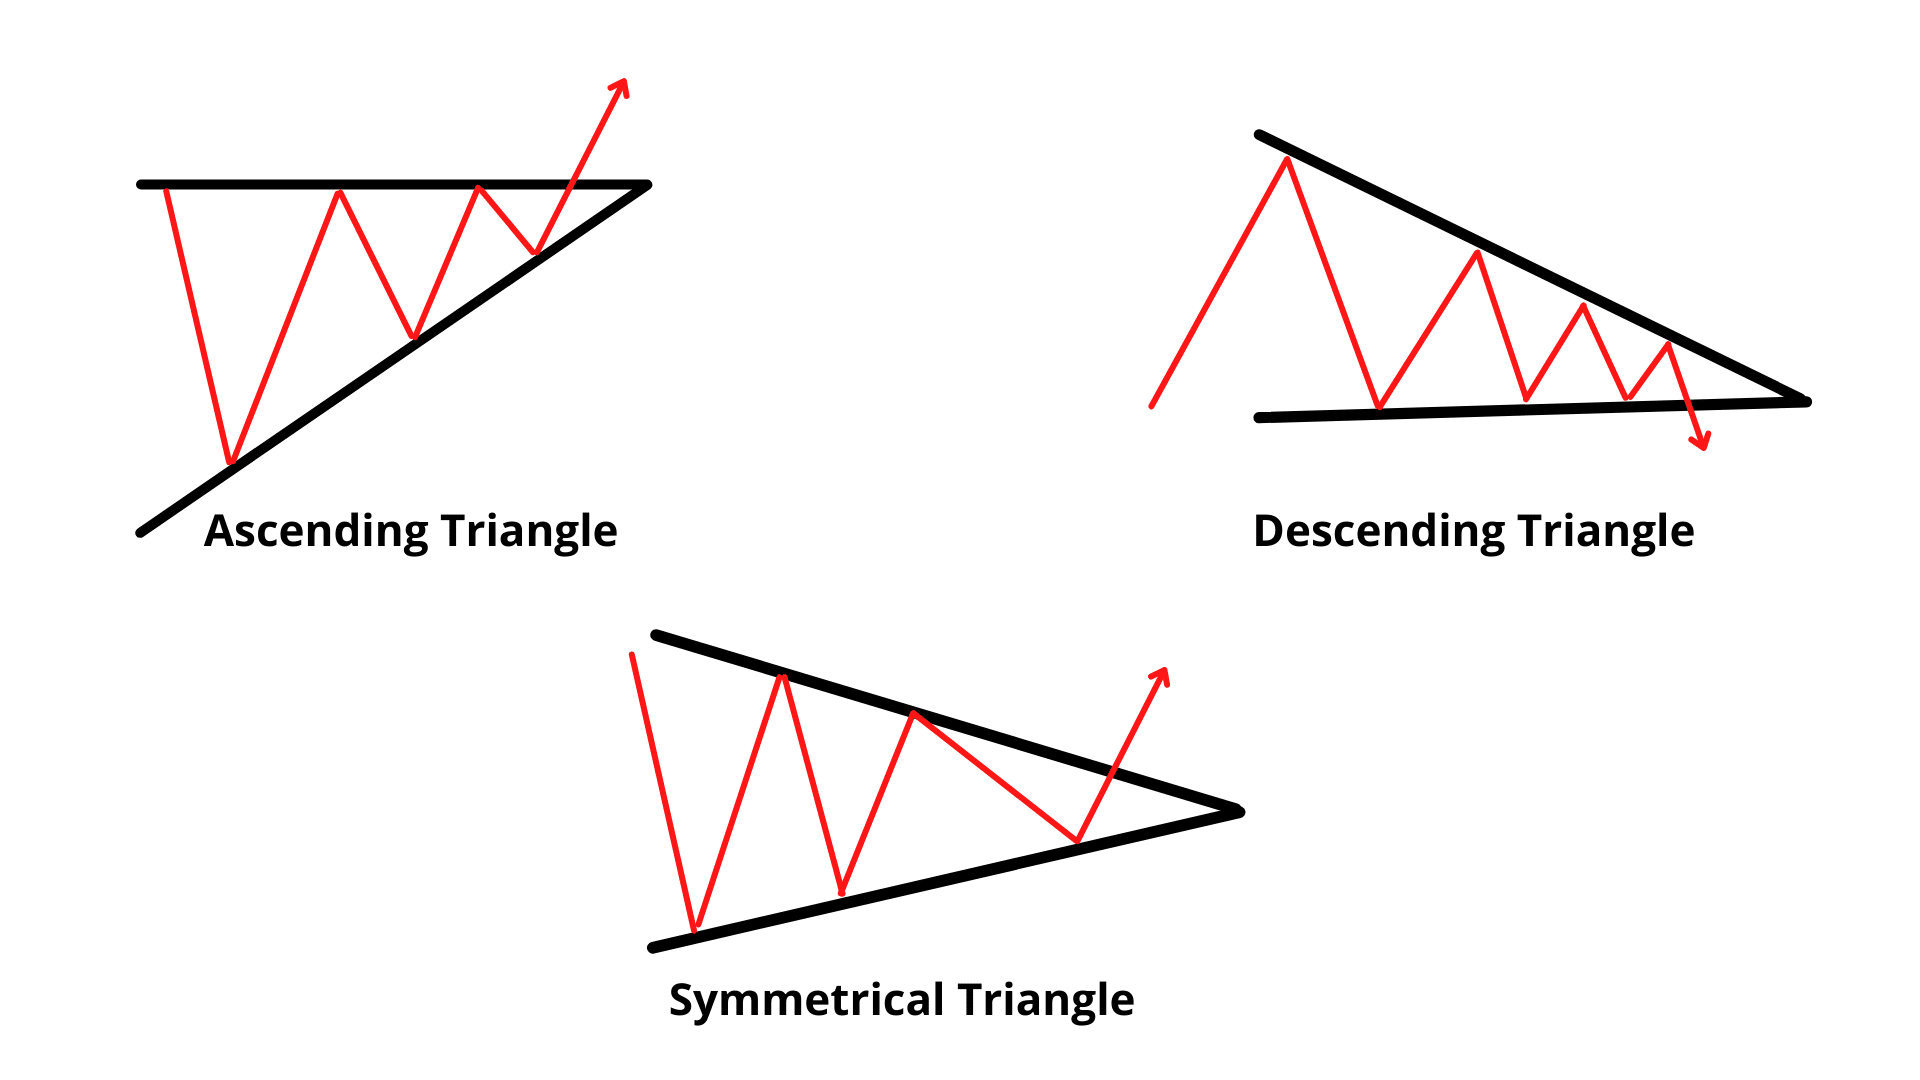
The above image represents all types of triangle formations in the financial market. Here, the ascending triangle has a horizontal resistance while the descending triangle has support. Such formations signify that bulls and bears are testing a level repeatedly that is making the zone weaker. As a result, once the price breaks those levels, it becomes crucial to traders. On the other hand, the symmetrical formation is unique, and it may appear in bullish and bearish markets, indicating less trading activity on both bulls and bears.
A short-term strategy
The fantastic factor of a triangle pattern is that it is tradable in any time frame from one minute to a monthly chart. Therefore, traders can easily consider this tool as a vital price director in short-term trading.
However, the accuracy rate in lower time frames is not reasonable due to the intraday volatility and market uncertainty. As a result, investors who use additional confirmation can eliminate the unusual market behavior.
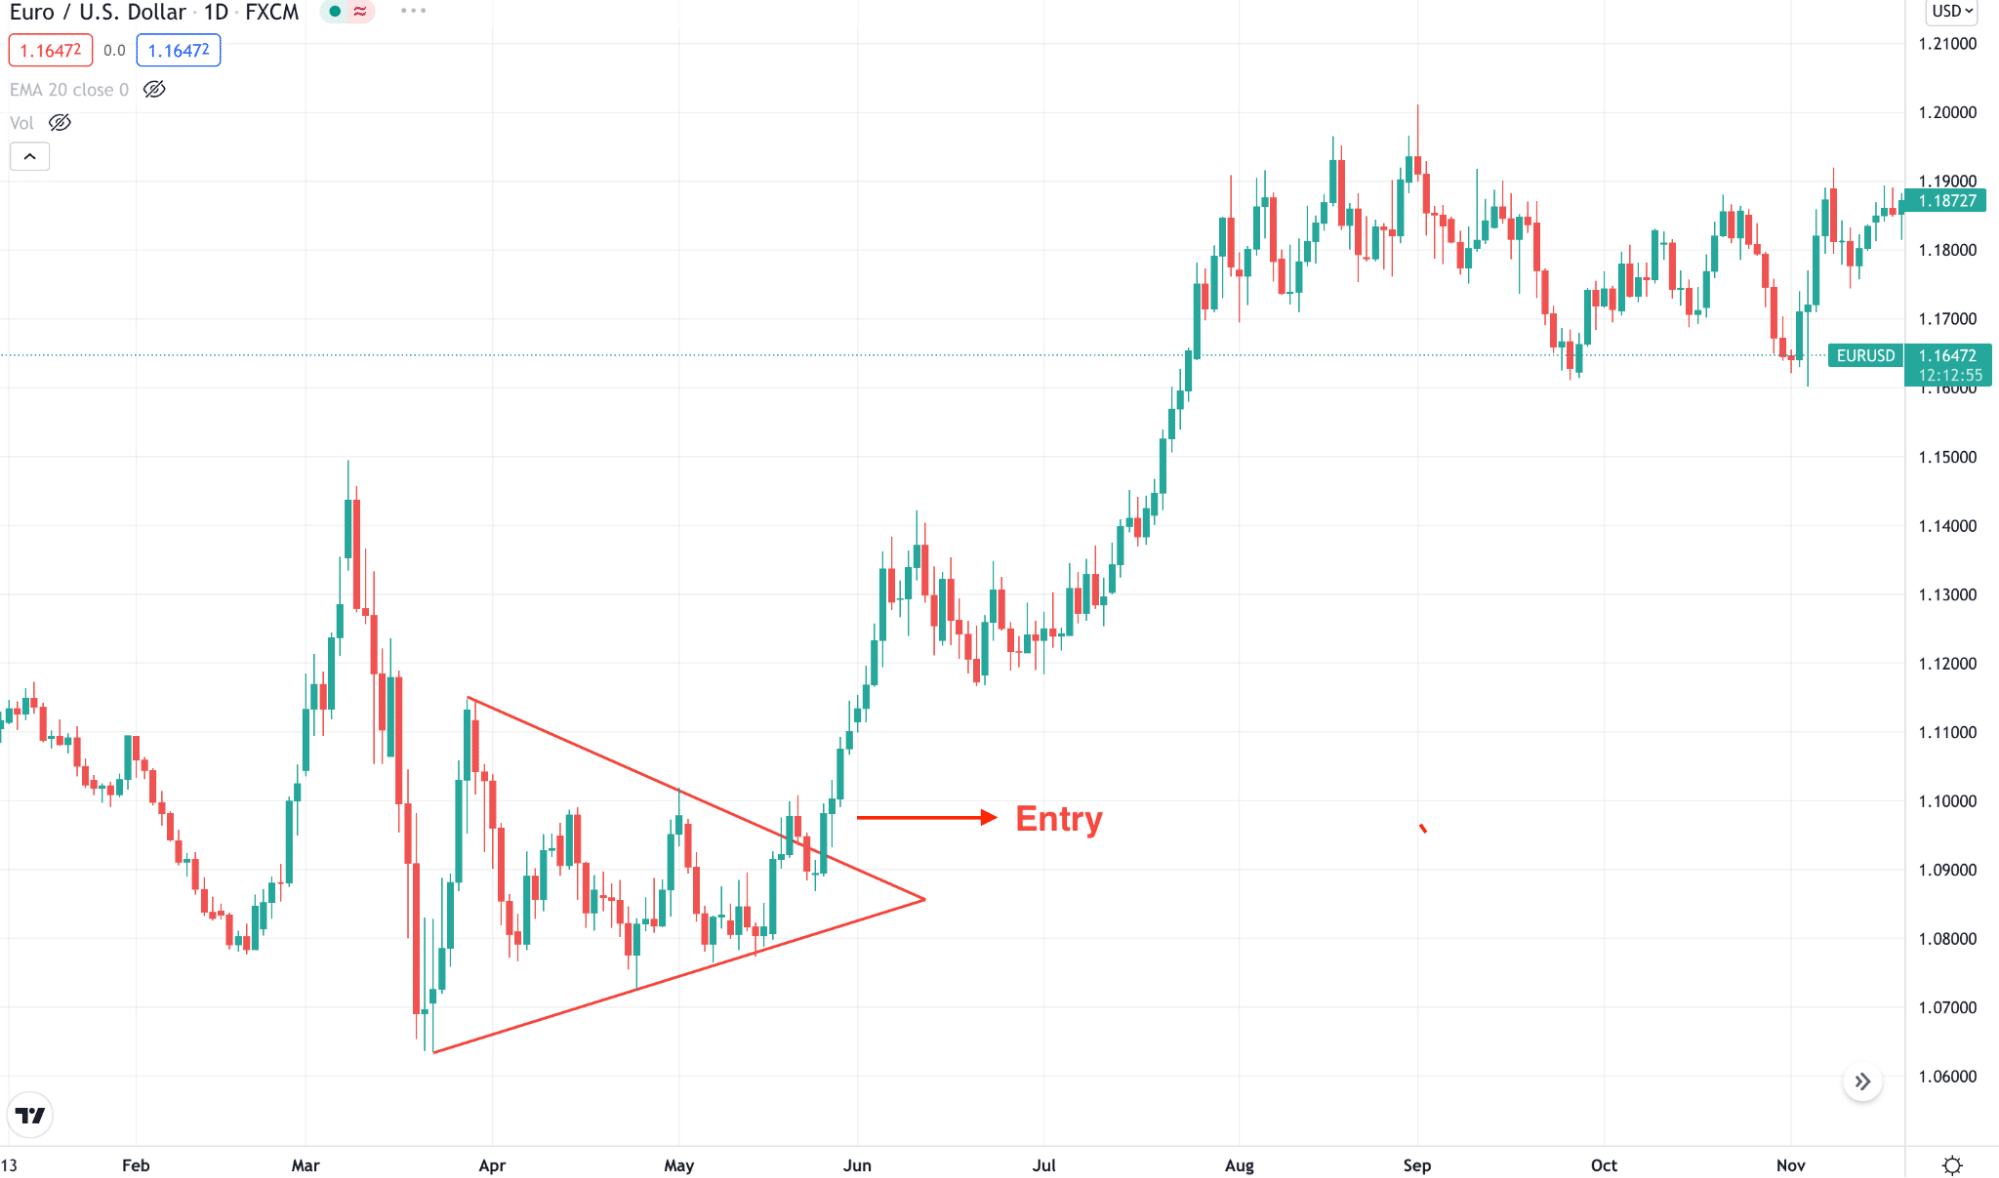
Bullish trade setup
Finding a bullish trend in the bullish trade setup is vital as the triangle pattern is effective towards the trend only. You can find the market trend by observing the higher time frame and the near-term support and resistance levels. After that, follow the below-mentioned rules to open a buy position:
- Price squeezes lower but remains within a horizontal resistance level.
- The pattern becomes valid once the price breaks out above the pattern high with an impulsive pressure.
- In some cases, the price may come back to the pattern to retest. However, it may move up straight without showing a retest.
- The first buy entry should be above the candle that breaks the pattern, and the second entry should be after a correction.
- Stop loss is below the pattern with some buffer, and ‘take profit’ is based on near-term levels.

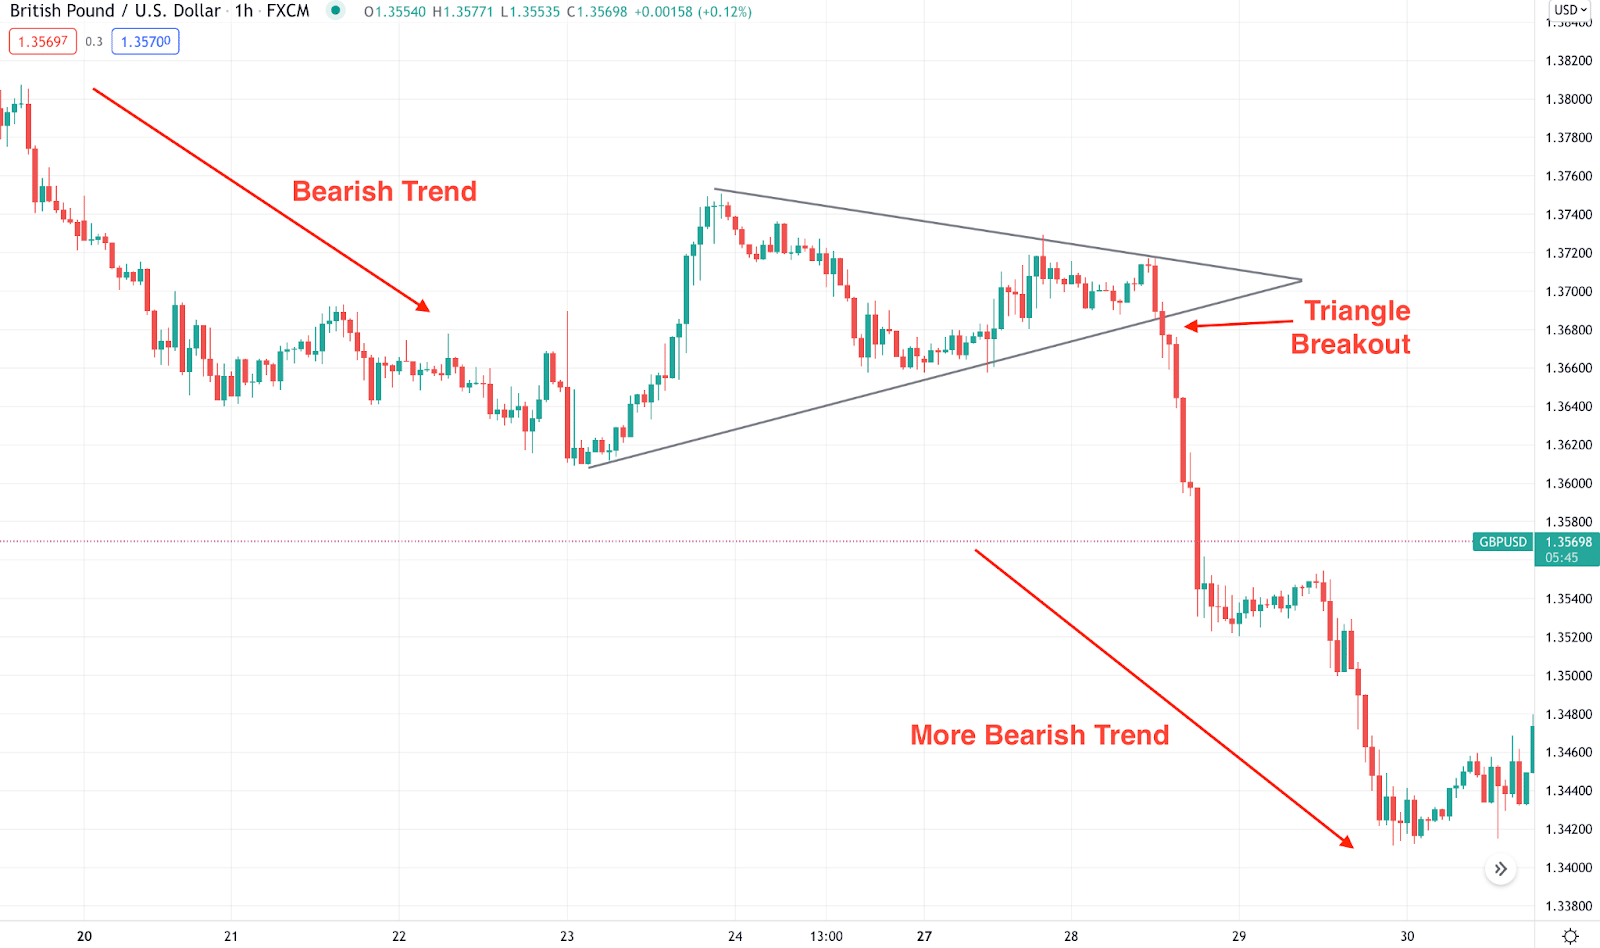
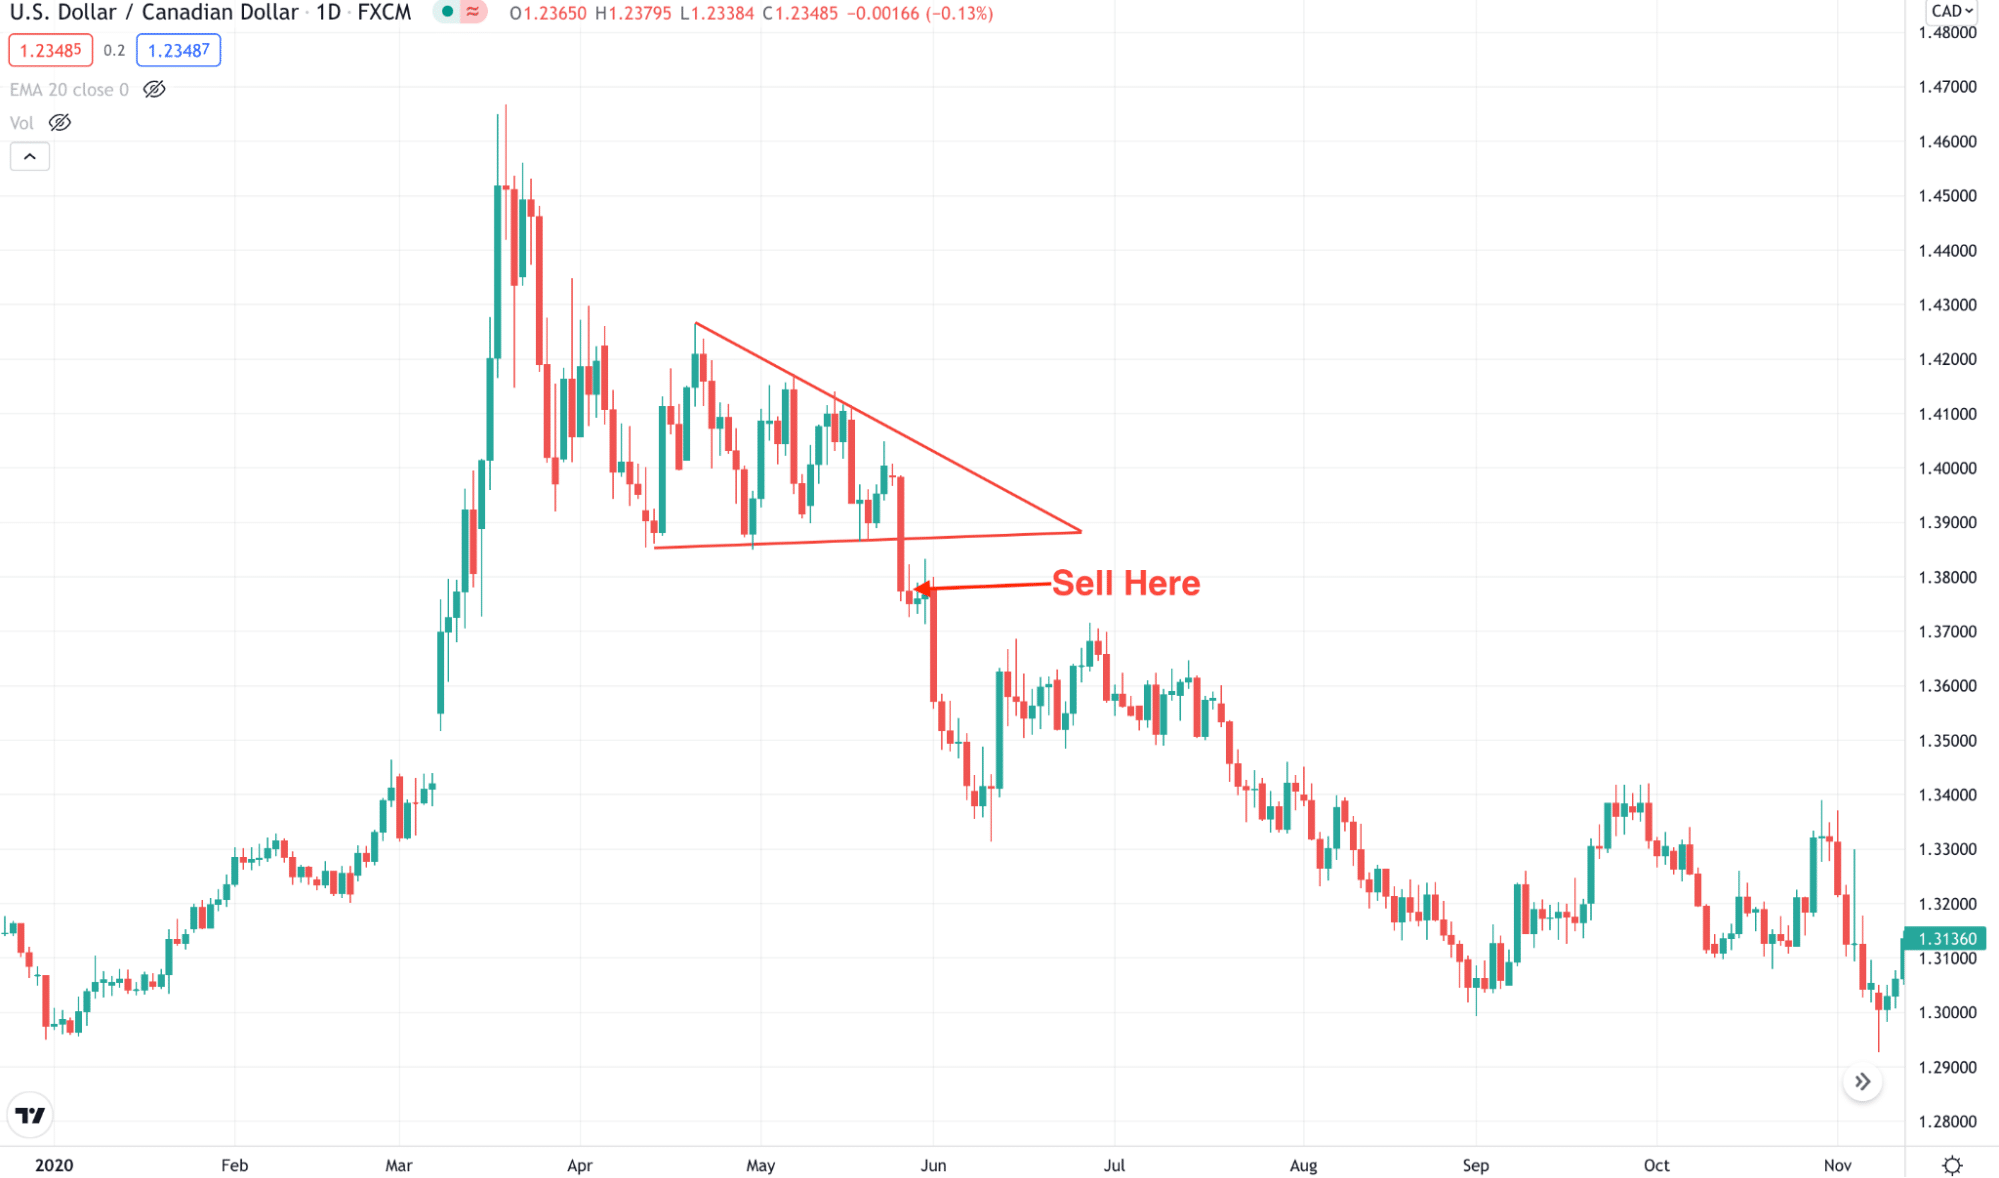
Bearish trade setup
It is almost similar to the bullish version, but we should find a descending triangle at a bearish trend. Once the candle breaks below the pattern, it becomes tradable.
Let’s see the process to take a sell position using the descending triangle:
- Price squeezes higher after a bearish trend but remains within horizontal support.
- The first sell should be above the candle that breaks the pattern, and the second entry should be after a correction.
- Stop-loss is above the pattern with some buffer and ‘take profit’ based on near-term levels.
A long-term strategy
The long-term method is similar to the short-term version, but it has a higher accuracy rate. Therefore, we recommend using this strategy in the daily chart to have the most accurate results.
Bullish trade setup
Make sure to find the below-mentioned confirmation in the bullish trade:
- The price is trending higher and moved above any important support level.
- The ascending or symmetrical price pattern appeared.
- A strong bullish buy candle formed above the pattern.
Bearish trade setup
The bearish trade setup is valid once the below-mentioned confirmations are present in the price:
- The price was trending lower and moved above any vital resistance level.
- A descending pattern appeared.
- A strong bearish sell candle formed below the pattern.
Pros & cons
Let’s see the pros and cons of the triangle trading system.
| Pros | Cons |
| It is a profitable trend continuation pattern that can explain the market sentiment. | It does not work well in finding the major price reversal. |
| It is profitable in any time frame from one minute to weekly. | Market uncertainty might make the pattern invalid. |
| Easy to spot by drawing trendlines. | Needs additional confirmation from candlestick and indicators. |
Final thoughts
It is a profitable trend trading indicator that is easy to spot by novice traders. However, it needs additional attention to the trade management as the FX market is full of uncertainties. Therefore, the ultimate success in this trading method depends on how investors are utilizing their funds with a proper trading method.