
The wave period oscillator is one of the most popular oscillators in the financial market. The using procedure of this indicator is so straightforward that it has become attractive to crypto investors. You can use this technical indicator to create stable crypto trading strategies that allow you to make enormous profits and reduce risks on capital.
However, it is compulsory to learn the components, and professional financial investors use procedures to use any indicator most effectively. This article will introduce the wave period oscillator indicator and the most efficient trading strategies using it with chart attachments for a better understanding.
What is the wave period oscillator indicator?
The WPO is a unique technical indicator to determine the market context. Akram El Sherbini first introduces this concept in IFTA Journal 2018, which shows results in an independent window containing several levels and a dynamic line.
The indicator usually generates trade signals by different crossovers of the dynamic line. It can detect the oversold, overbought, extreme oversold, and extreme overbought levels. This indicator’s default value is 14; you can modify it according to your desire.
How to trade crypto using the WPO indicator?
It is easily applicable to many trading instruments.
- When the dynamic line reaches above the central (0.0) line, it declares a positive force on the asset price. It suggests opening a buy position at that time and conversely declaring a declining pressure when it goes below the central line.
- When the reading reaches above the upper (2) level declares overbought, and near 2.7, it indicates an extremely overbought condition.
- Meanwhile, the reading reaches below the bottom (2) level when the price reaches the oversold condition and declares the extreme oversold condition at 2.7.
Crypto investors often combine this concept with other technical tools and indicators to detect trades’ most profitable entry/exit positions.
Short-term trading strategy
In this trading method, we combine the WPO indicator concept with another popular momentum indicator, MACD. It is popular among financial traders for its simplicity and universally applicable features. When the WPO indicates price movement in any direction, we confirm the direction from the indicator window before executing any trade.
Bullish trade scenario
Set both indicators at your target asset chart and seek to open buy positions when you can mark the scenarios below:
- The WPO line is above the central (0.0) line and heads on the upside.
- The dynamic blue line reaches above the dynamic red line at the MACD indicator window.
- MACD green histogram bars take place above the central line.
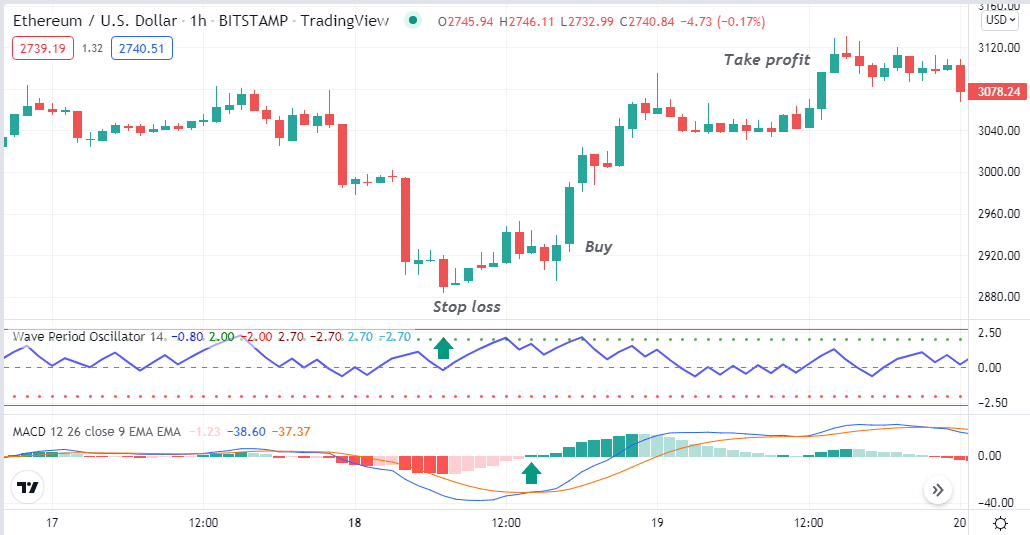
Entry
When these conditions above match your target asset chart, it declares a potential bullish pressure on the asset price. Open a buy position.
Stop loss
The initial stop loss level will be below the current swing low.
Take profit
Close the buy position by checking the conditions below:
- The WPO indicator reading reaches near the upper (2) level or at the extreme (2.7) level.
- The dynamic blue line comes below the dynamic red line at the MACD indicator window.
- MACD red histogram bars take place below the central line.
Bearish trade scenario
Set both indicators at your target asset chart and seek to open sell positions when you can mark the scenarios below:
- The WPO line is below the central (0.0) line and heads on the downside.
- The dynamic blue line reaches below the dynamic red line at the MACD indicator window.
- MACD red histogram bars take place below the central line.
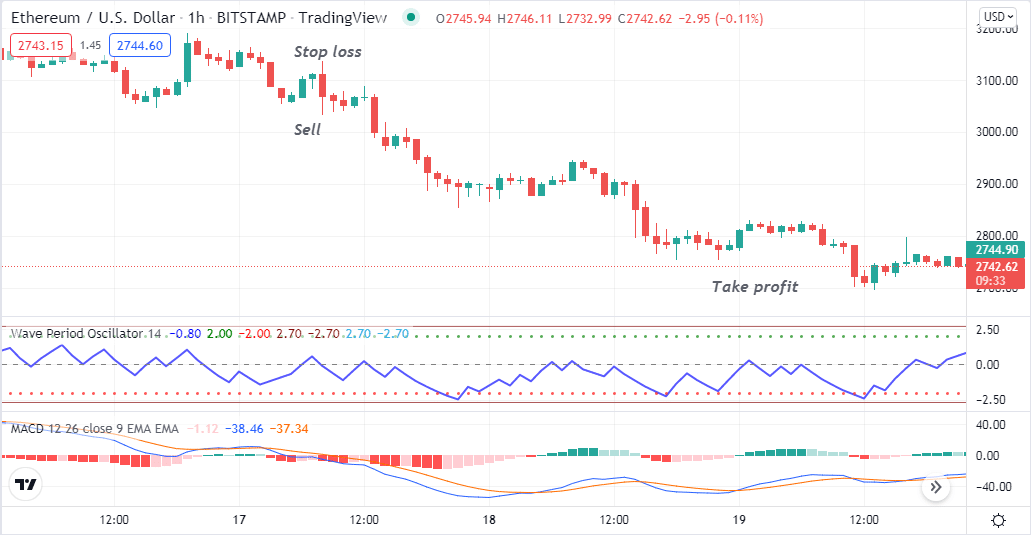
Entry
When these conditions above match your target asset chart, it declares a potential bearish pressure on the asset price. Open a sell position.
Stop loss
The initial stop loss level will be above the current swing high.
Take profit
Close the sell position by checking the conditions below:
- The WPO indicator reading reaches near the lower (-2) level or at the extreme (-2.7) level.
- The dynamic blue line comes above the dynamic red line at the MACD indicator window.
- MACD green histogram bars take place above the central line.
Long-term trading strategy
We use it as a supportive indicator to determine trend switching points in this trading method. In the meantime, the WPO confirms direction and trend. This technique allows crypto investors to detect the most promising trading positions. We recommend implementing this method in a daily or H4 chart to identify the most profitable long-term trading positions.
Bullish trade scenario
When entering buy trades, seek the scenarios below on both indicators:
- The WPO dynamic line reaches above the central (0.0) line and heads on the upside.
- Bullish (blue above red) crossover occurs between two dynamic lines near the stochastic oscillator window’s bottom (20) level.
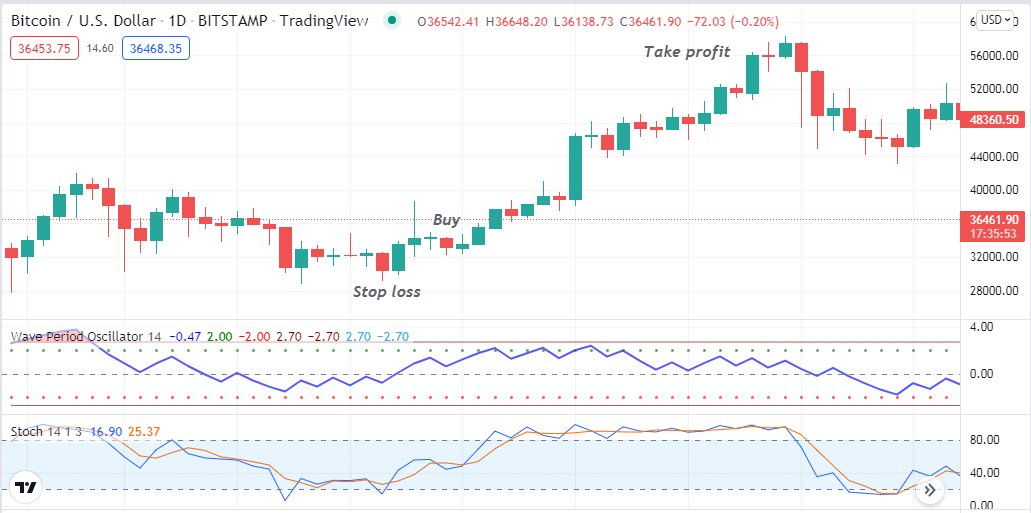
Entry
Match both conditions above and open a buy position.
Stop loss
The initial stop loss level will be below the current swing low.
Take profit
Close the buy order by checking the conditions below:
- The WPO line reaches the upper (2) level or near the extreme (2.7) level.
- The dynamic lines of the SO indicator window reach above the upper (80) level or start to decline after reaching that level.
- Bearish crossover (blue below red) occurs between two dynamic lines at the stochastic oscillator indicator window.
Bearish trade scenario
When entering sell trades seek the scenarios below on both indicators:
- The WPO dynamic line reaches below the central (0.0) line and heads on the downside.
- Bearish (blue below red) crossover occurs between two dynamic lines near the stochastic oscillator window’s top (80) level.
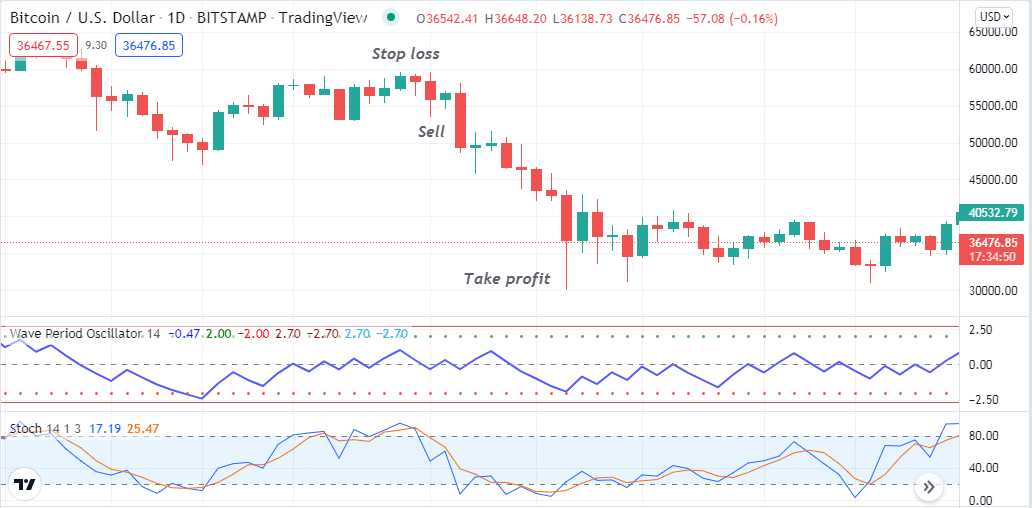
Entry
Match both conditions above and open a sell position.
Stop loss
The initial stop loss level will be above the current swing high.
Take profit
Close the sell order by checking the conditions below:
- The WPO line reaches the lower (-2) level or near the extreme (-2.7) level.
- The dynamic lines of the SO indicator window reach below the lower (20) level or start to rise after reaching that level.
- Bullish crossover (blue above red) occurs between two dynamic lines at the stochastic oscillator indicator window.
Pros & cons
| Pros | Cons |
|
|
|
|
|
|
Final thought
This article introduces you to one of the most powerful technical indicators for crypto trading. To utilize the WPO indicator effectively requires mastering the concept first by following a sound trade management system.


