
The Smoothed moving average (SMMA) targets diminishing the noise instead of lag. The indicator is indistinguishable from the simple moving average (SMA). It considers all the prices and utilizes a long past period. Previous prices have the slightest effect on the MA because of the low weight.
Yet the previous prices are not eliminated from the calculation under any circumstances. The indicator does both, removing the fluctuations and spotting the current trend by diminishing noise.
Moreover, the SMMA confirms trends and marks the support and resistance areas. The indicator is combined with different analysis methods and signals in most cases.
The following section will see the SMMA trading guide, including exact buying and selling trading methods.
What is SMMA?
It is the indicator applicable for both longer and shorter periods, which provides the same weighting to both the prices, recent and historical. Rather than preferring a fixed period, the calculation considers all accessible data series. And, it came via deducting the previous day’s SMMA from today’s price, adding up the previous day’s SMMA out-turns in today’s MA.
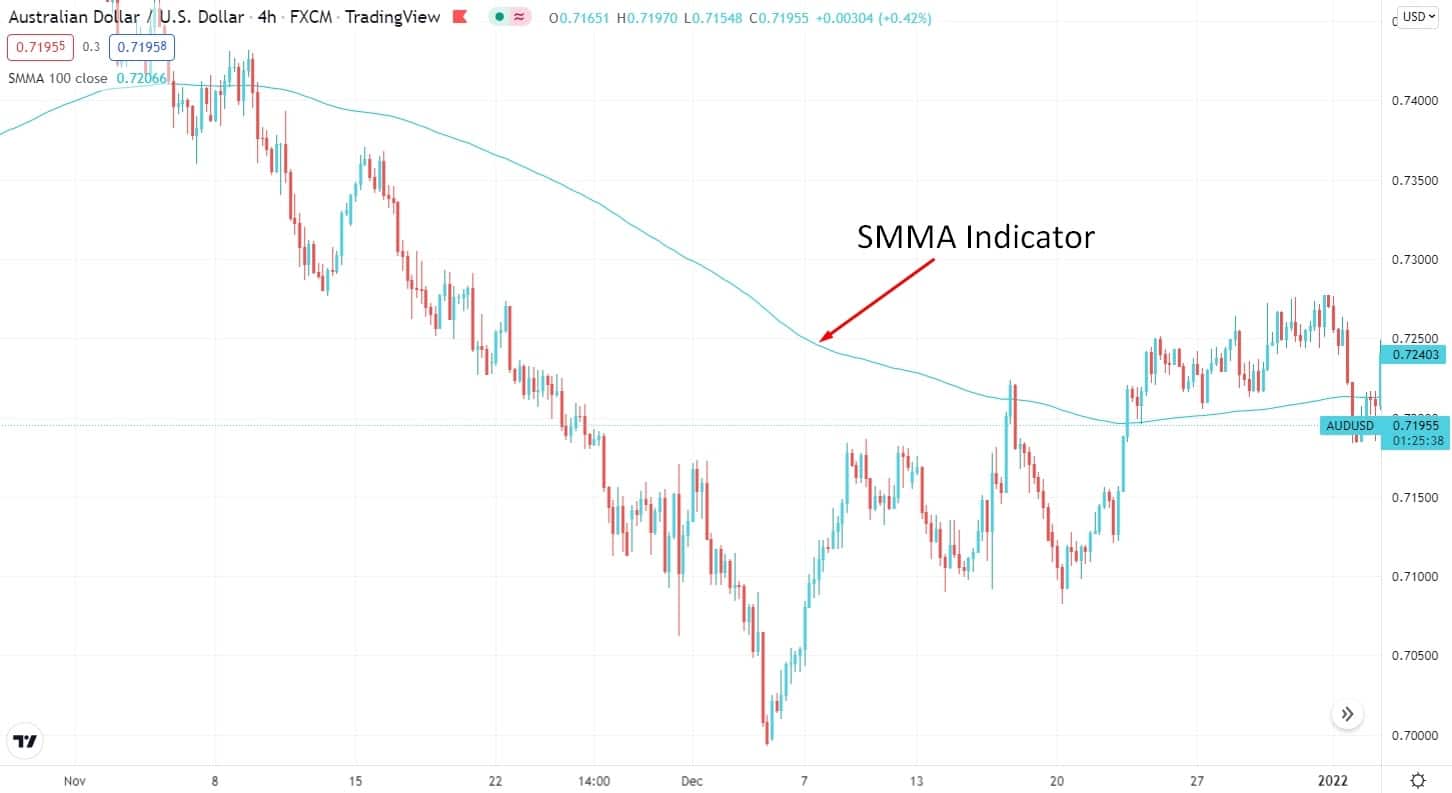
How to identify SMMA on the chart?
The SMMA is a different kind of MA. The price data has a similar weight in calculating the average in an SMA. Besides, the historical price data came from the moving average since a new price adds up to the calculation in a simple moving average. Figuring out the average SMMA utilizes a more extended period.
As the average is determined, SMMA gives weight to the price data. In this way, the historical price data in the SMMA did not come in any circumstances, yet they have minimal effect on the MA. However, the prime use of SMMA is that it makes the functioning smooth. Thus, the moving average depicts the current trend by eliminating the short-term fluctuations.
Furthermore, in the trending market, MA functions at its best.
- When the short- and intermediate-term averages pass over the longer-term from below, then a buy signal is issued.
- On the contrary, a sell signal occurs if the short- and intermediate-term averages surpass the longer-term from up to below.
A similar signal is applicable with two MAs. Yet utilizing longer-term averages is essential by the majority of the technical analysts while trading only two SMMAs in a crossover technique.
However, using the current price is another trading method. If the current price goes over the SMMAs, it’s a buy. When the current price passes below either MA, then liquidate the position. In terms of the short position, while the current price is under the SMMA, it’s a sell.
A short-term trading strategy
A trader can use SMMA in many different ways, but the best method is to identify the crossover of two SMMAs. Using the SMMA in the short-term trading is very profitable as it indicates the market direction in the lower time frame. Thus, we will use 20-period SMMA and 50-period SMMA to identify the entries. Moreover, we will look at only M5, H15, and H1 time frames for this short-term trading strategy.
Bullish trade setup
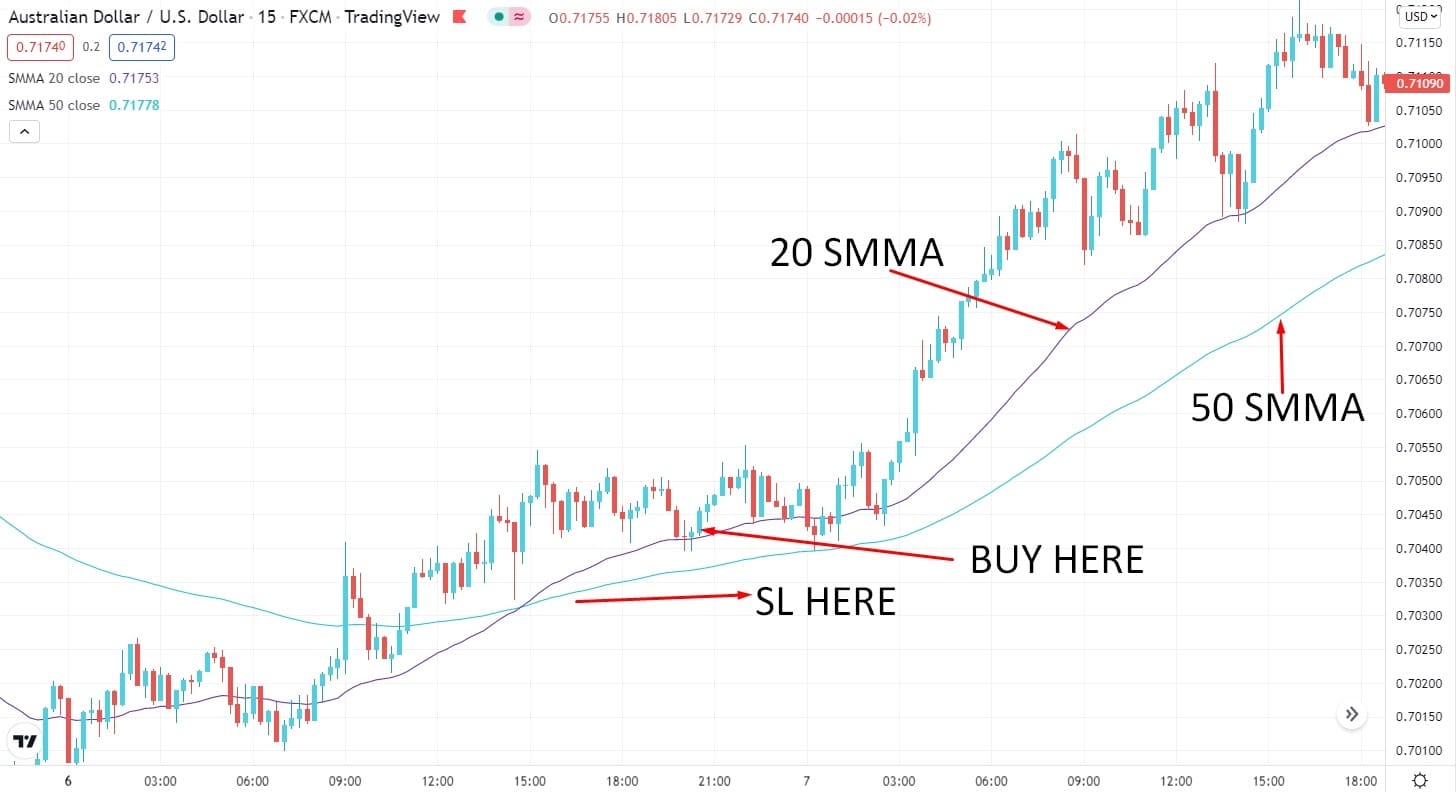
Entry
Look for a buy entry when the 20 SMMA crosses the 50 SMMA from downside to upside. Place a buy order when the price retraces back to the 20 SMMA.
Stop loss
Put the SL order below the 50 SMMA with a 5-10 pips buffer.
Take profit
Take the profit by calculating a 1:3 risk/reward ratio. Otherwise, you can close the trade when the price has an impulsive bearish candle close below the 20 SMMA line.
Bearish trade setup
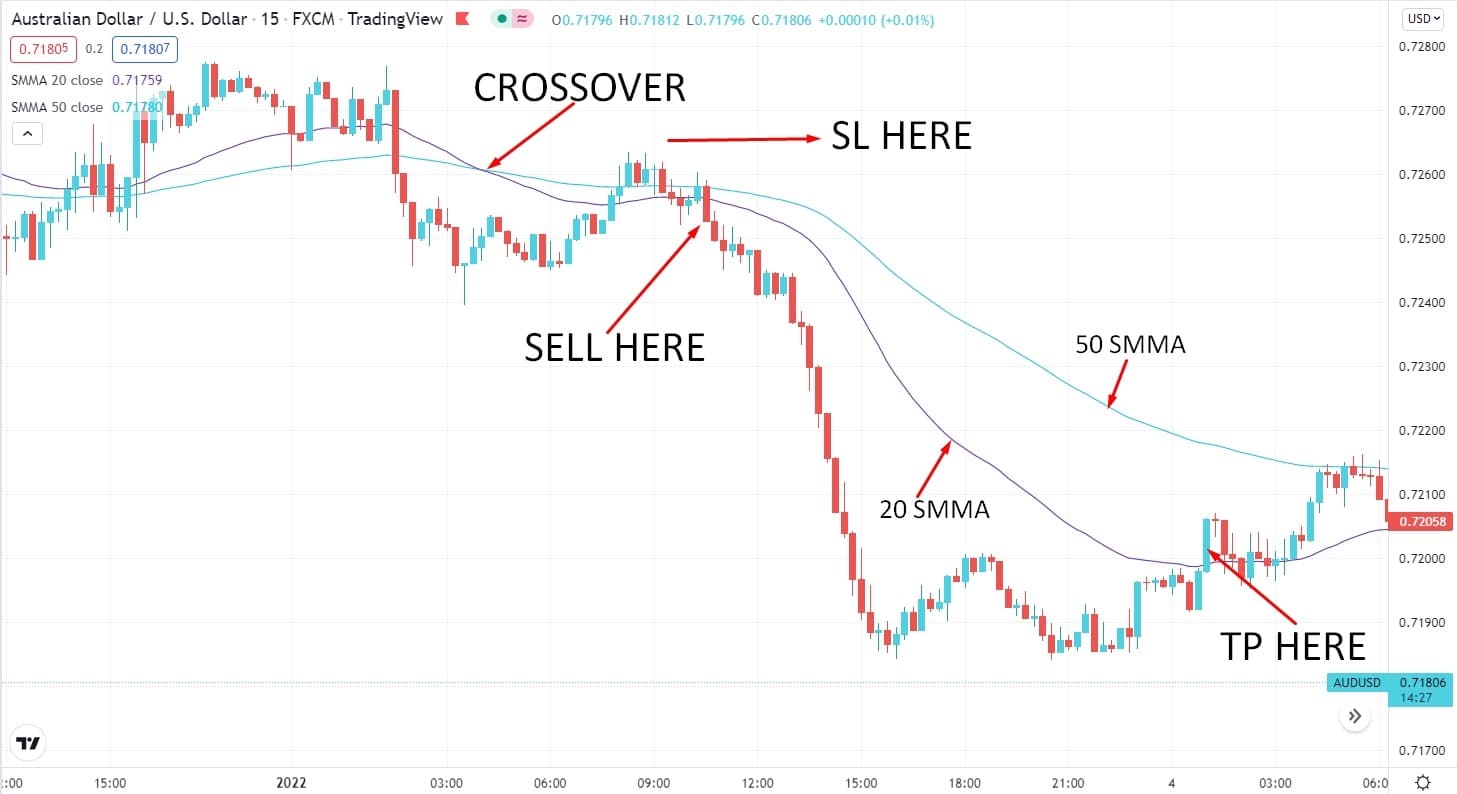
Entry
Look for a sell entry when the 20 SMMA crosses the 50 SMMA from upside to downside. Place a sell order when the price retraces back to the 20 SMMA.
Stop loss
Put the SL order above the 50 SMMA with a 5-10 pips buffer.
Take profit
Take the profit by calculating a 1:3 risk/reward ratio. Otherwise, you can close the trade when the price had an impulsive bullish candle close above the 20 SMMA line.
A long-term trading strategy
Long-term trading using the SMMA indicator is very profitable as it provides the long structure of the market trend. Thus, we will use 20- period EMA and 100- period SMMA to identify the entries. We will look at H4, D1, and W1 time frames in this long-term trading strategy.
Bullish trade setup
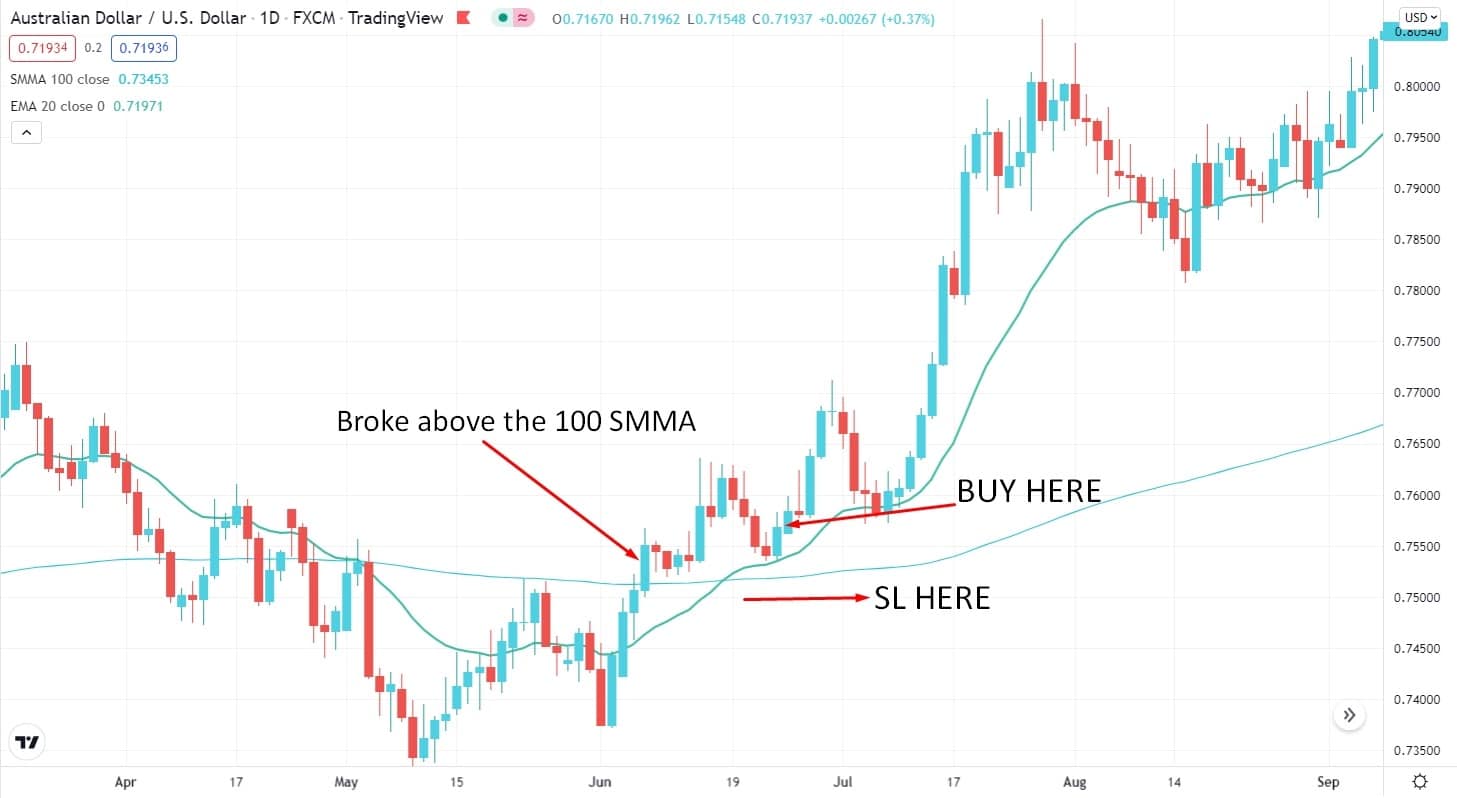
Entry
Look for a buy trade when the price broke above the 100 SMMA impulsively. Place a buy order when the price retraces towards 20 EMA and bounces back with a bullish candle close.
Stop loss
Put the SL order below the a-100 SMMA with a 10-15 pips buffer.
Take profit
Take the profit by calculating a 1:3 risk/reward ratio.
Bearish trade setup
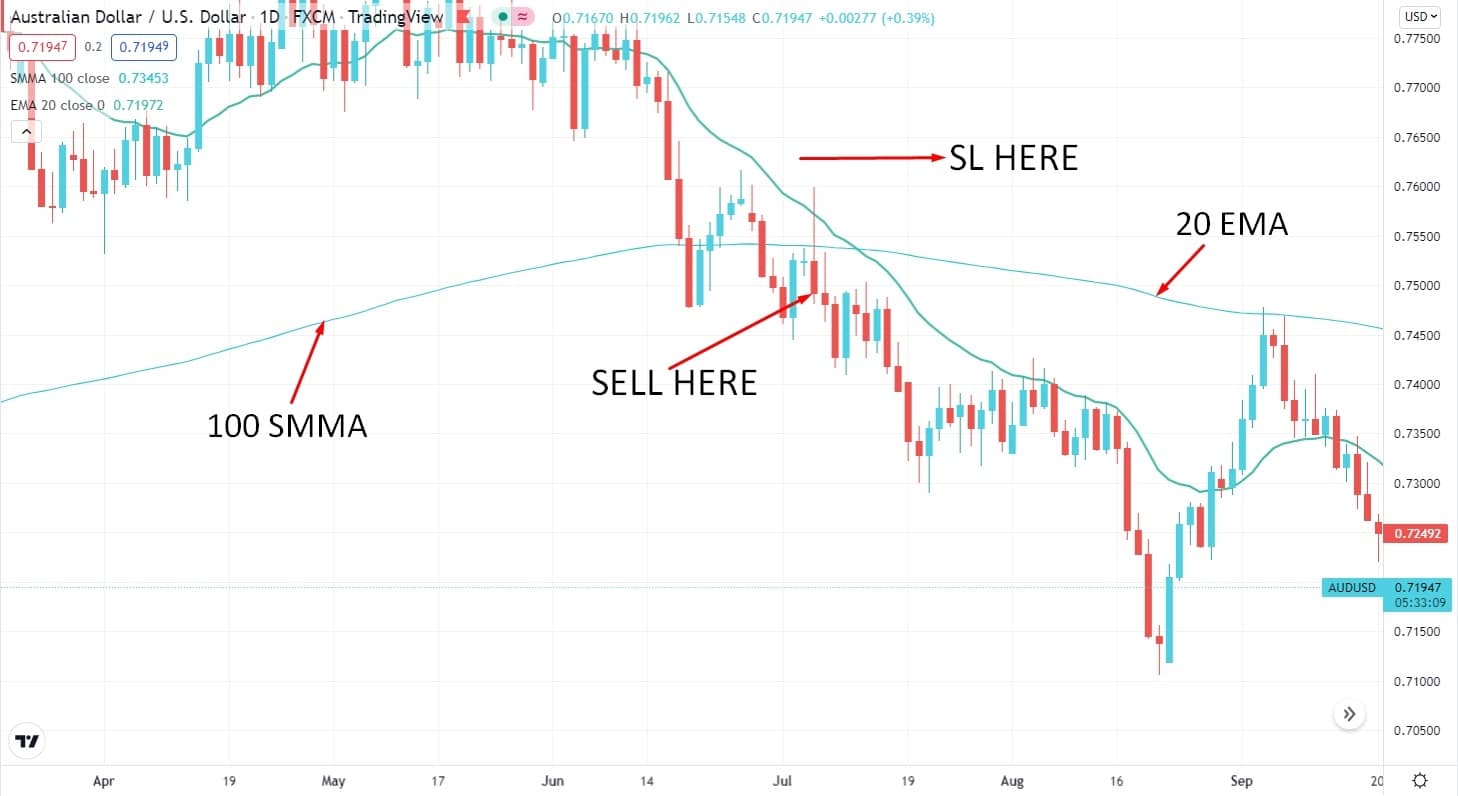
Entry
Look for a sell trade when the price broke below the 100 SMMA impulsively. Place a sell order when the price retraces towards 20 EMA and rejects with a bearish candle close.
Stop loss
Put the SL order above the a-100 SMMA with a 10-15 pips buffer.
Take profit
Take the profit by calculating a 1:3 risk/reward ratio.
Pros & cons
| Pros | Cons |
| The SMMAs are best suited for the trending market. | It may give false breakout signals. |
| It is the best functioning moving average for a longer term. | It gives a signal when the price has already moved. |
| It withdraws the short-term fluctuations allowing one to see the price trend easily. | Do not work in the ranging market. |
Final thoughts
In a nutshell, trading is a risky game; hence, you have to formulate suitable techniques as per your trading style. A smoothed moving average allows viewing a clear picture of the trends.
You’ll become more tactful towards the market trends by trading boldly. You may automatically obtain a jeopardizing attitude after a particular time in trading.

