
Technical analysis uses technical tools, indicators, and other forecasting methods to examine past pricing activity to detect trends and predict potential market changes. The vast array of trading strategies available to new traders that provide a decent profit from the market.
However, the bulk of these approaches fall into one of two categories: fundamental analysis or technical analysis. Although some traders do both, most traders nowadays rely primarily on technical analysis for various reasons that you can learn about in this short guide.
What is technical analysis?
It is studying market patterns in a specific trading instrument to detect anomalies and forecast potential price movements. There are several methods for identifying trends in capital markets, but most professional observers concentrate on the following:
Chart templates
Professional analysts use drawing techniques such as horizontal bars, trend lines, and Fibonacci levels to define known graphical trends such as symmetrical triangle formations and consolidation patterns. After finding the chart template, traders can easily find the price direction based on their analysis.
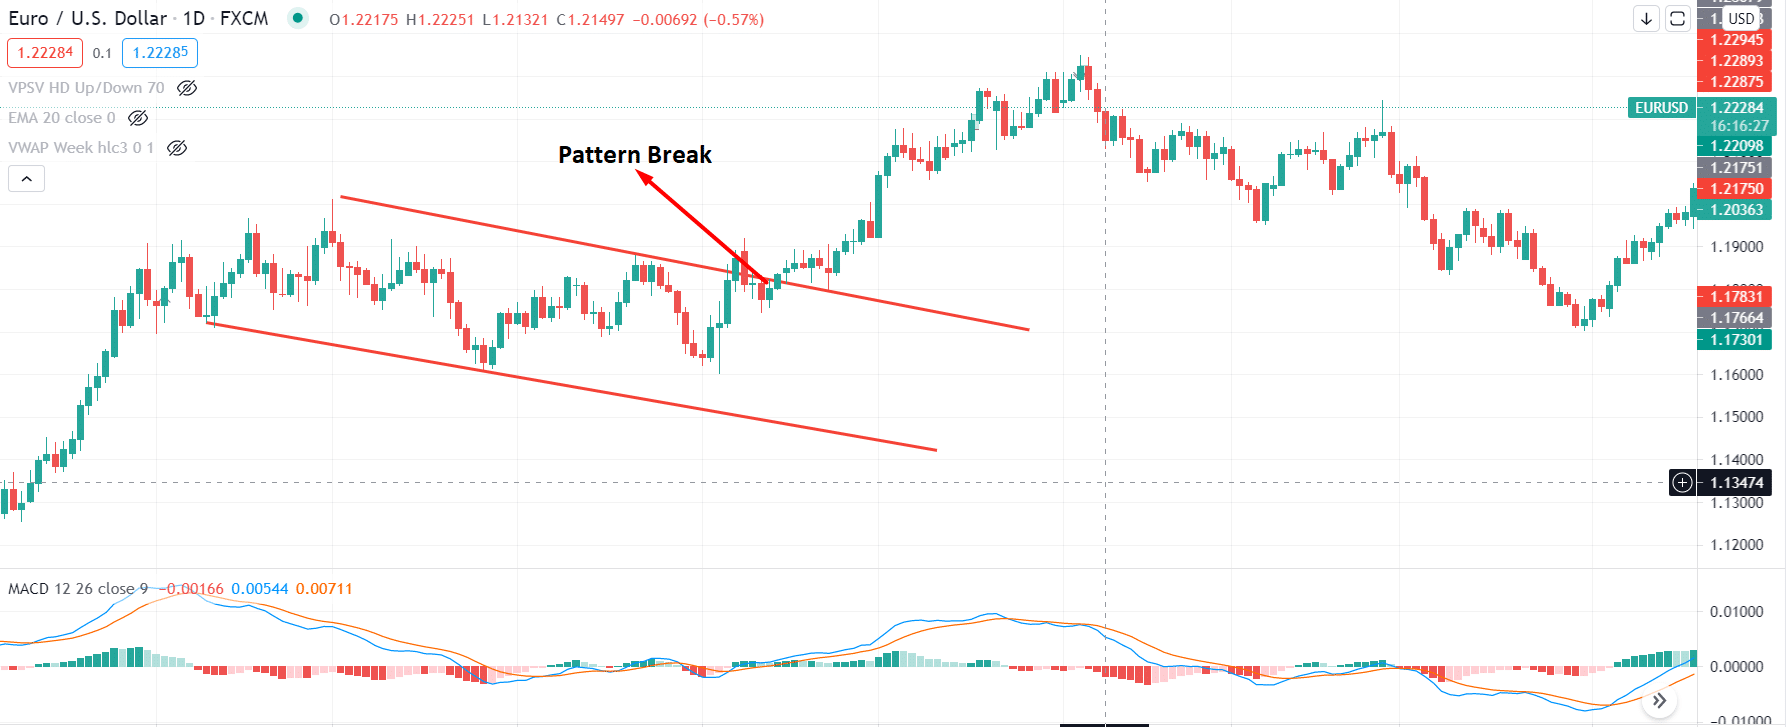
We can see how the price moved up as soon as a chart pattern breaks in the above image.
Candlestick chart
Traders use price charts in this analysis, such as candlestick charts showing open, closed, high, and low price levels over time. Traders try to divide the clues into the behavior of buyers and sellers in a short time.
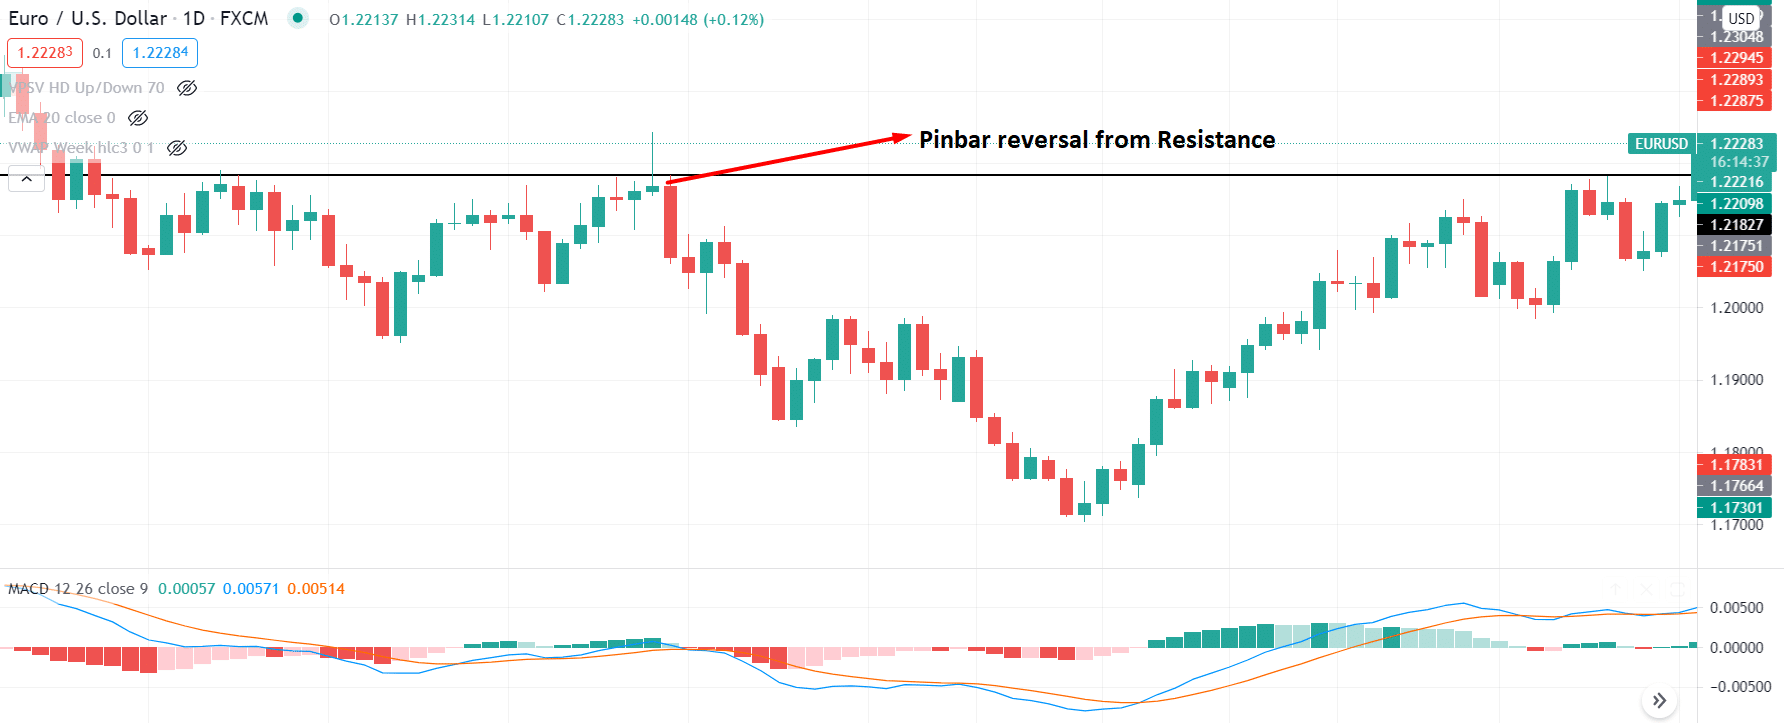
The above image shows a pin bar reversal from a resistance, saying that the price may move down.
Technical analysis indicators
To take into account the trading situation, traders use technical statistics. For example, if the market is overbought/oversold, some indicators will signal. Other metrics can give traders clues about increasing or decreasing momentum.
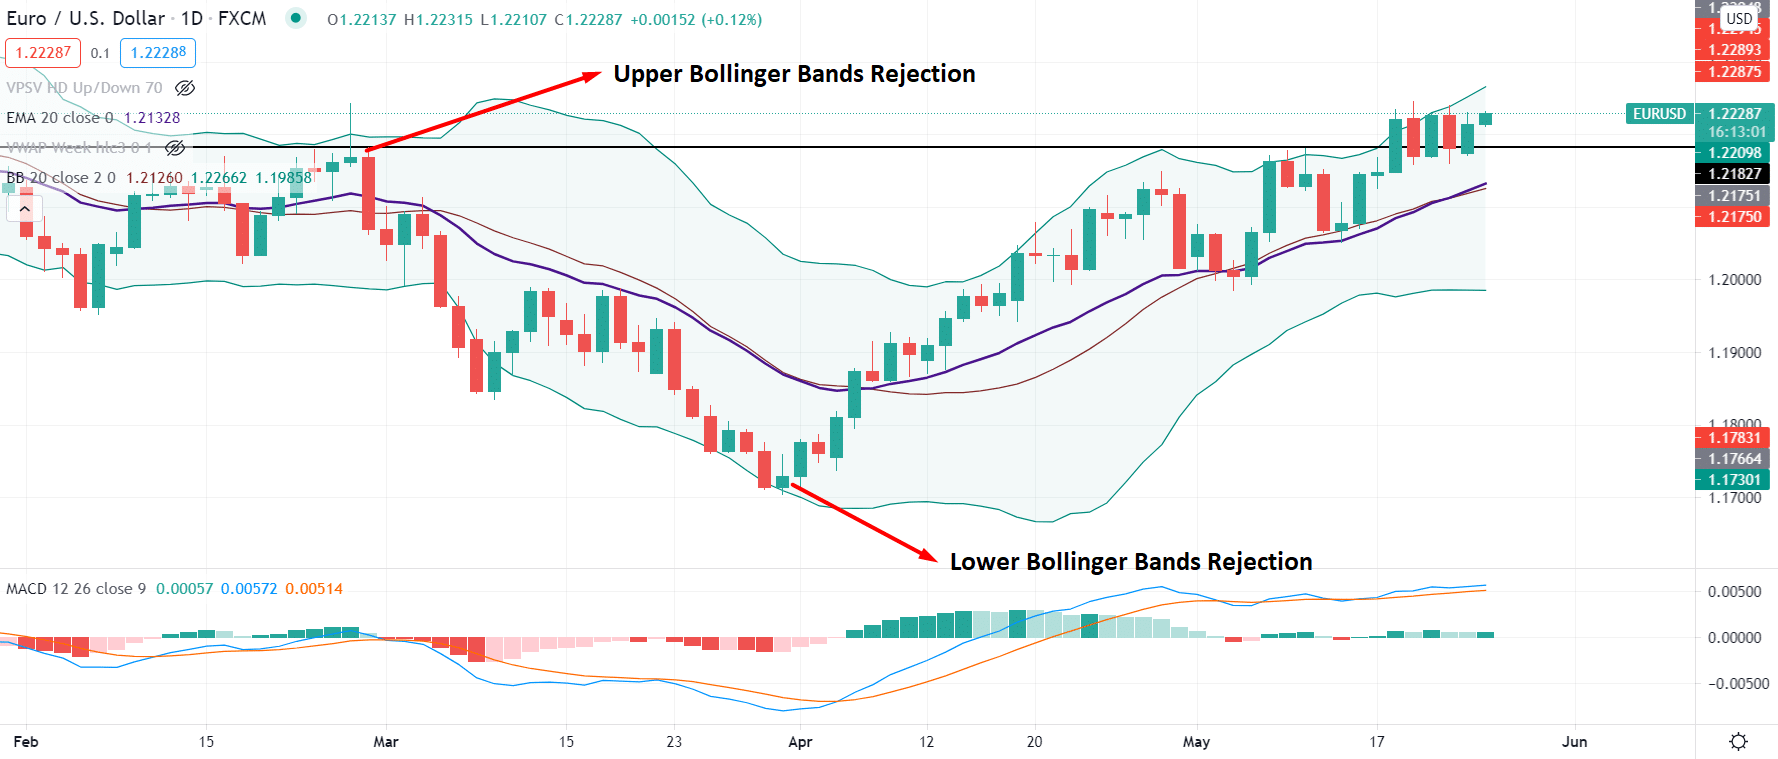
There are many indicators in the world, both default and custom-made, to the platform. Among these, we will see how to find price direction from Bollinger Bands.
Why is technical analysis critical in FX?
This type of analysis in the FX involves using technical indicators and charts to predict the signals. Forex traders have touted it as an effective tool for trading and understanding market movements. They also made recommendations for trading forex using technical analysis.
Technical assessment measures have been taken to meet supply and demand. In other words, there are more agreements on an open monetary tool than what is required or not. The additional confidence that a reasonable practitioner can assess where much demand enters the market provides you with insight into places where business departments are possible. Indeed, even traders who avoid such searches also get an overview of where these fields of the real-life stand.
Understand the market structure
One of the principal objectives of forex traders is to decide if a given pair is going in the right direction. You may assess industry dynamics by technical analysis. By examining price charts, traders can quickly point out the price direction. Every intelligent trader knows that he needs to know the overall market path to trade well and make money.
The technical analysis will do this since it assumes that the market dynamics have already been presented in prices to represent some fundamental element that affects the market. Human psychology is still working for trading analysis in the FX in the trade and technical markets.
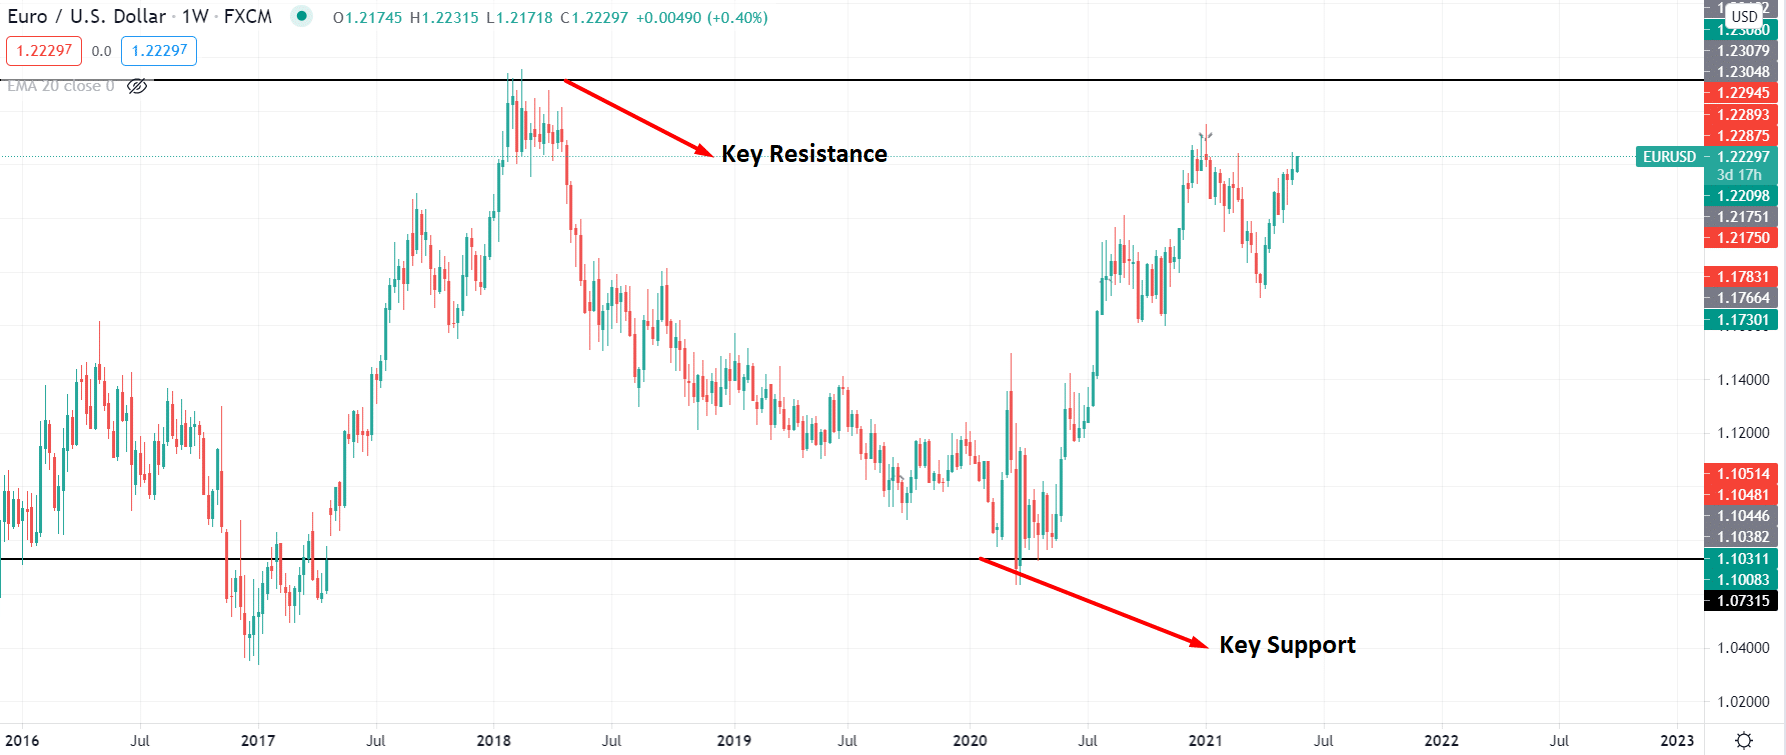
Here, for example, if the price is moving down from a key resistance, we can consider the market as bearish, and we will focus on sell trades. Similarly, if the price moves higher from the vital support, we will look for buy trades.
Understand market context
Technical testing is based on the premise that human and human psychological behavior never changes due to repeated price patterns and consistent prices. Therefore, price measurements are the result of human decisions, and traders can consider them meaningful.
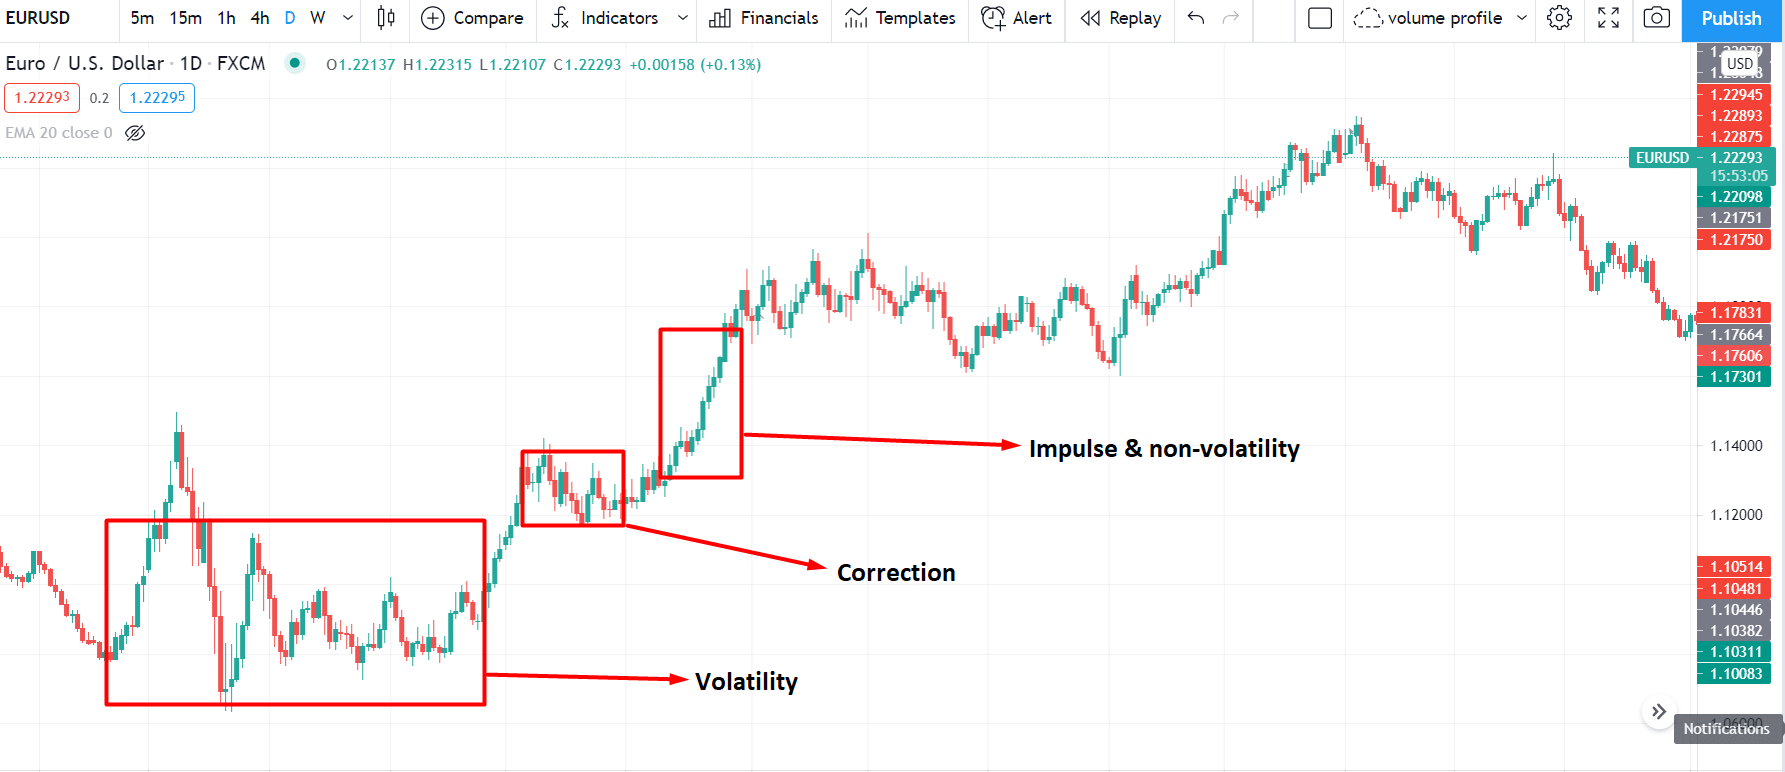
Although prices are random and unpredictable, this analysis can identify and measure behavioral trends based on previous markets. Thus, while markets remain volatile, traders should remain cautious about the risk. On the other hand, in a nonvolatile market, traders should focus on making maximum benefit of the trend.
The idea behind this is the goal of every trader to use the information to move forward.
Scale up the risk: reward
The use of financial research technology eliminates the need for complex accounting. Moreover, various technological steps are available to create profitable markets and businesses. So it takes less time, less efficiency, and less growth for forex traders.
Technical analysis will show any information about the market that is easily visible to the price chart. It will improve your trading skills and can help you get various tips on how to invest money. In addition, charts and technical indicators help identify short-term forex trading techniques.
For example, you probably found that the EUR/USD price will move up based on your analysis. But, the question remains: how long it will move up or how much floating risk you should carry.
Indeed, technical analysis will allow you to use the maximum usage of your fund with minimum risk.
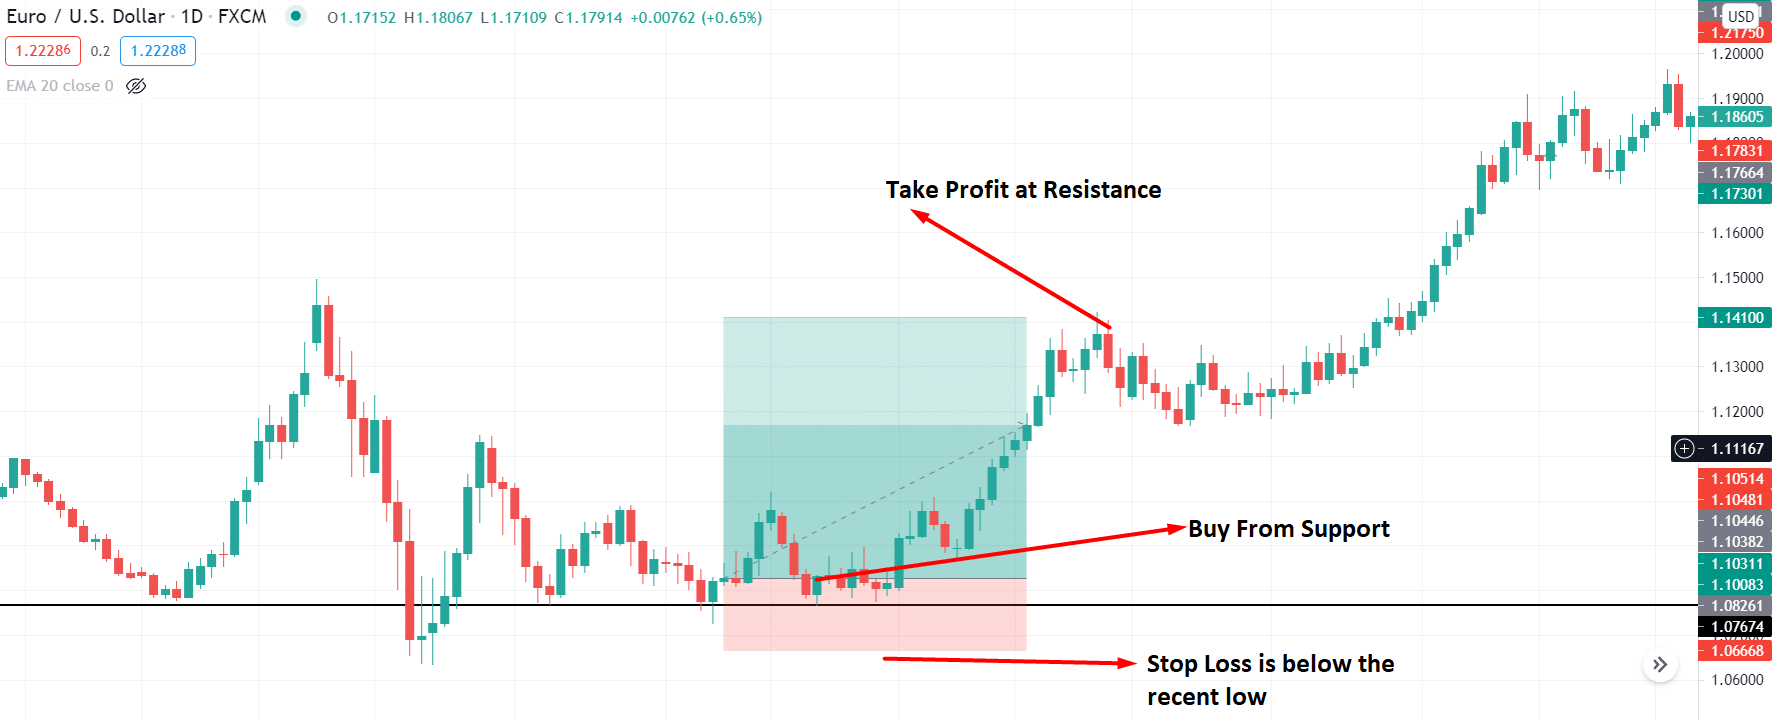
Here we can see a buy trade from the support level where the stop loss was below the most recent low and take profit was at the near-term resistance level.
Trade management
Traders using forex trading recognize this as an important way to identify volatile markets and trade wisely. Technical charts help to determine the development of the markets and the strength of the trends. By analyzing currency fluctuations, you can calculate your limits when making a buying or selling decision.
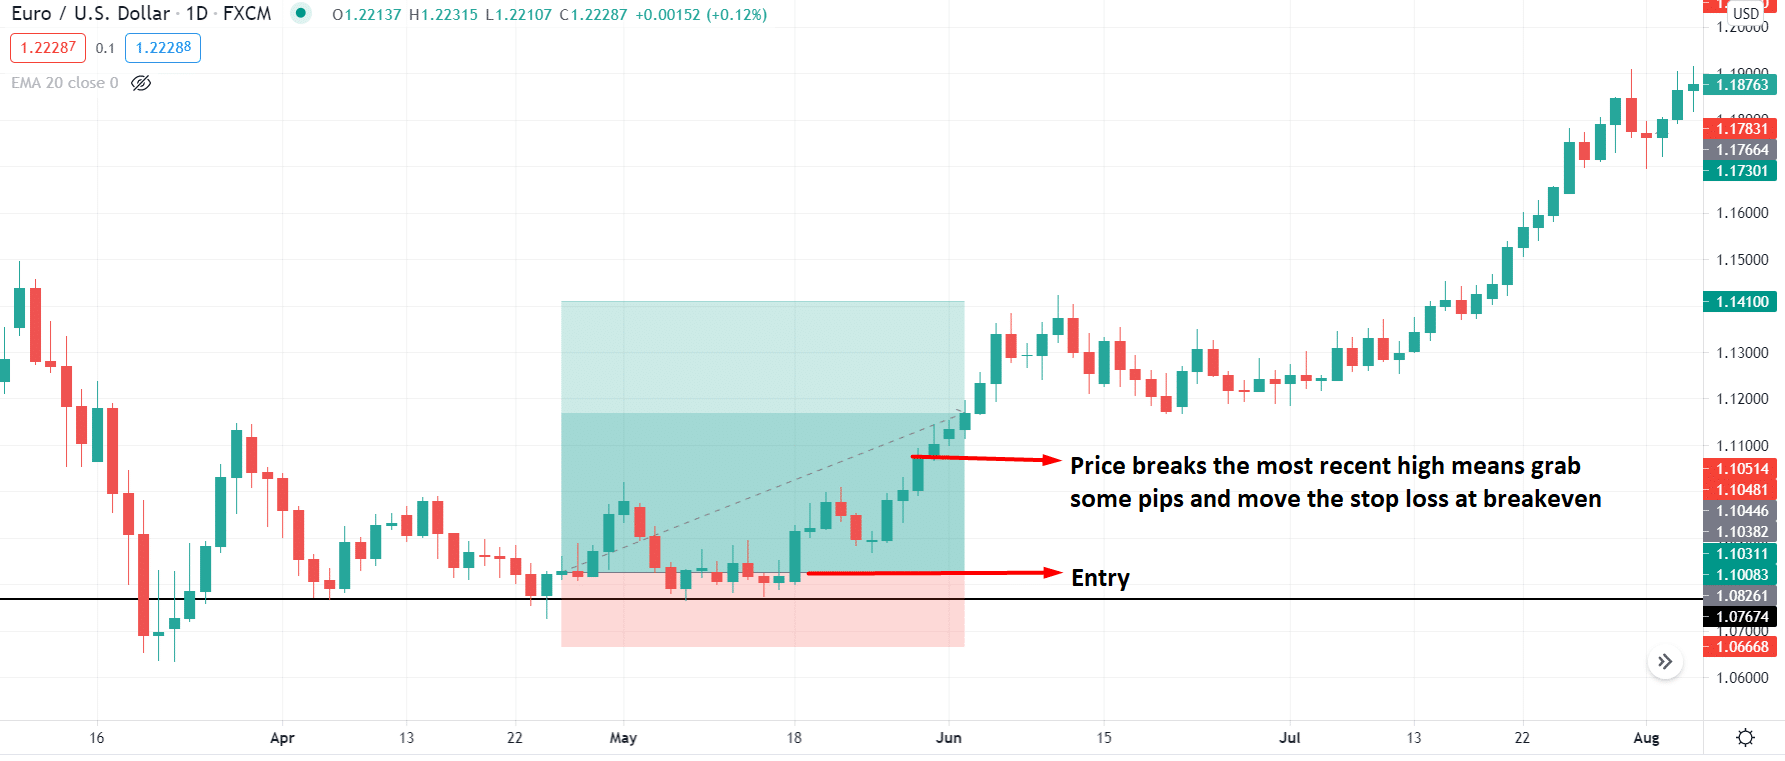
However, success in financial trading comes from how you manage your trades. The best approach is securing some pips after moving a considerable movement towards your direction and set the stop loss at breakeven. Moreover, if the price gives you a chance, allow it to move beyond your profit level.
Axioms of technical analysis:
- Price changes reflect all information
This hypothesis says that all the information needed to analyze value is already included in the price and trading volume. As a result, and according to the dynamics of their ratio, one can predict the development of the market. Therefore, technical analysis is convenient. It does not require studying all external factors affecting the FX and making it possible to quickly and accurately get a forecast.
- Price movement is subject to trends
The meaning of this statement is that the price movement is not a random quantity but has certain tendencies. Therefore, it is possible to split the time series of prices into intervals during which the change occurs in one direction. Thus, the charts of price changes have a smooth wave-like shape, consisting of the peaks of the rise in value and the dips. Hence, the three main trends in developing the FX are uptrend, downtrend, and sideways trend.
- History repeats itself
The essence of the hypothesis is that every event, be it the history of humanity or the situation at the farm, is repeated because the participants’ reaction remains the same. And knowing the past, one can easily predict future conditions. Thus, studying events in the market, one can find similar ones in the past, view their development, and conclude how they can continue in the future.
Based on this hypothesis, several traditional standard patterns have been developed for predicting price behavior. The earliest method for analyzing the market is the candlestick chart created by Japanese rice traders.
Final thought
Technical analysis is one of the essential tools available for predicting price movements in financial markets. There are quite a few reviews, but active traders praise its bread and butter. The FX commission comprises industry professionals, advisers, and research analysts with over fifteen years of experience in global trading.
The perception of market volatility is technical analysis, but price movement cannot be performed under any circumstances. No one knows what will happen next on the 100%.
Keep in mind that there is no magic combination of technical measures that will trigger a covert trading strategy. Risk management, sustainability, and the regulation of strong emotions are the keys to the effective management of a business. This analysis is based on the possibility of a chaotic market, although at the same time, the nature of prices has not changed completely. Remember that no one can know what will happen next.
Note that there is no magical combination of indicators that will open up a secret trade policy. Instead, risk management, sustainability, and intense emotional control are the keys to effective business.