
The Iceland pattern shows the unusual change in the running trend’s direction in the FX trading chart. This pattern is not yet very commonly used, but it is gaining the potential to grab the traders’ deliberation day by day.
Moreover, this figure can signal both bullish and bearish trend reversal, implying prices reverse regardless of the running trend in the market. To define the trend, the position, the gap is essential.
However, it appears after-hours trading or pre-market incidents due to news releases in most cases. If you are keen to catch the benefit from the price gap, the following section is for you.
Here we will see the complete trading guide on the Iceland pattern, including short-term and long-term trading methods.
What is the Island reversal pattern?
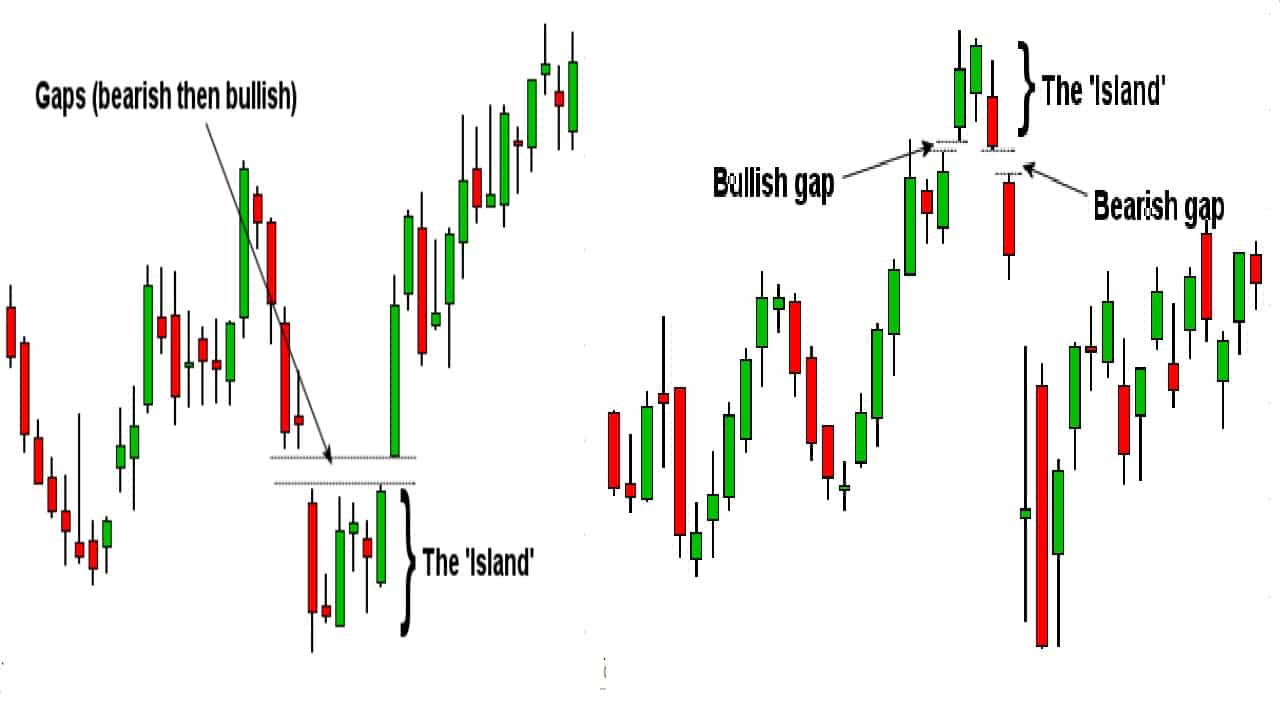
It is a figure, which predicts future market movements. It forms when a group of trading days is separated by two different gaps in the price action. It includes groups of isolated bars by the gaps on both sides. Moreover, these intersecting gaps form the price action island, so the figure is named ‘Island reversal.’
It can appear at the top or bottom, both. The Island appearing above the gap means a bullish reversal, and appearing below the gap means bearish Island reversal.
How to use it in trading strategy?
It is straightforward to identify the pattern as bullish or bearish. During a bearish trend, a bullish figure appears and reverses the bearish trend. A market downtrend should be available, and there should be a negative gap depicting the starting of a reversal.
Then it just needs to be noticed whether it is continuous market behavior going downtrend or consolidating. Moreover, the price should be reversing, but the gap area remains intact. It generates a positive gap afterward when the price action appears and trades below the gap for a moment. It normally appears at the price level or near to there, the emerging place of the first gap.
When it comes to recognizing the bearish, it is just opposite to the bullish. A bearish one appears during the bullish trend. The market uptrend must be there with a positive gap for a bearish reversal pattern. Here it is significant to monitor how the market is behaving. Is it static or combining and not filling the gaps. Also, it is required not to fill the gaps instantly since it will approve the bearish trend to occur around the first gap.
A short-term trading strategy
This strategy can provide highly accurate trades in lower time frames. If you give a little bit of an idea about the price action and market patterns, you can find the best ways to trade the this figure. In this short-term trading strategy, we will look at M5, M15, H1 time frames to identify the Island patterns.
Bullish trade setup
Entry
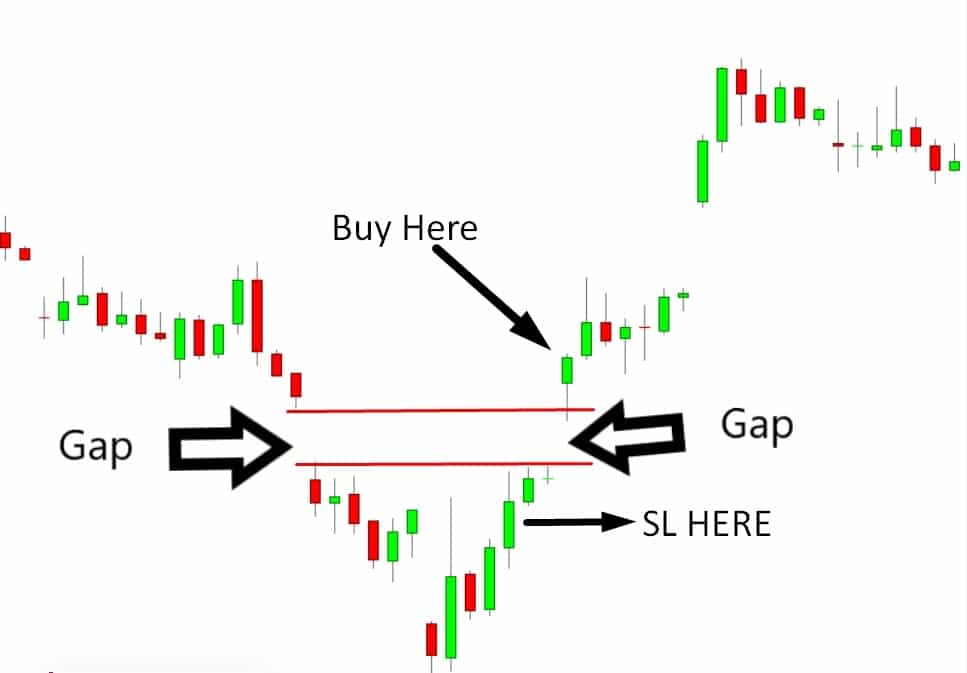
Place a buy order when the price gives a bullish reversal signal and has an impulsive bullish candle close above the bearish gap.
Stop loss
It’s always better to place an SL order below the last swing level. However, you can place your SL order below the bearish gap with at least a 5 -10 pips buffer.
Take profit
Set your TP level at the next resistance level. Or else, you can take the profit by calculating a 1:3 risk/reward ratio.
Bearish trade setup
Entry
Place a sell order when the price gives a bearish reversal signal and has an impulsive bearish candle close below the bullish gap.
Stop loss
It’s always better to place an SL order above the last swing level. However, you can place your SL order above the bullish gap with at least a 5-10 pips buffer.
Take profit
Set your TP level at the next support level. Or else, you can take the profit by calculating a 1:3 risk/reward ratio.
Long-term trading strategy
This strategy has proved to be a very profitable trading method. Because the price action on the higher time frame is the most authentic and reliable. Moreover, it can provide the best risk/reward ratio-based trade. We will look at H4, D1, and W1 time frames in this long-term trading strategy to identify the Island patterns.
Bullish trade setup
Entry
Open the position for buying when the price gives a bullish reversal signal and has an impulsive bullish candle close above the bearish gap.
Stop loss
Place your SL order below the bearish gap with at least a 10-15 pips buffer.
Take profit
Target the next resistance level to take the profit. Or else, you can take the profit by calculating a 1:3 risk/reward ratio.
Bearish trade setup
Entry
Sell when the price gives a bearish reversal signal and has an impulsive bearish candle close below the bullish gap.
Stop loss
Place your SL order above the bullish gap with at least a 10-15 pips buffer.
Take profit
Target the next support level to take the profit. Or else, you can take the profit by calculating a 1:3 risk/reward ratio.
| Pros | Cons |
| The pattern has the feature of easy defining. | It does not give any signal in a sideways market. |
| It gives early signals on a reversal. | Sometimes the figure shows an early signal. |
| It may very accurately foretell the price behavior of a particular direction. | It requires it to be used along with different other indicators. |
Final thoughts
Finally, it must consider that the figure is a short-term candle pattern, and it is necessary to use it with a good understanding of it. This is a unique pattern in trading, which is another essential thing to remember. Moreover, it is suggested to utilize it as a combination with other indicators since it is found to be incorrect due to unsatisfactory performance outcomes.