
Traders seek many strategies to make constant profits from the financial market. A particular trading approach is essential as it enables traders to maintain routine and perform trades with discipline. Swing trading methods are among the group of profitable trading techniques.
However, it requires some skills to catch the best swing trading opportunities. Meanwhile, there are many trading techniques available depending on various technical tools and indicators.
This article will introduce you to the best indicators for swing trading besides explaining different strategies using these indicators.
What is a swing trading strategy?
Swing trading focuses on making smaller profits on a certain asset price change and reducing losses quicker. These traders may gain little, but they make constant profits involving an excellent annual return from trading.
For example, traders who use other methods may have a profit target of 20-25%; meanwhile, a swing trader may target a profit of 10% or even 5% in an inflexible market condition.
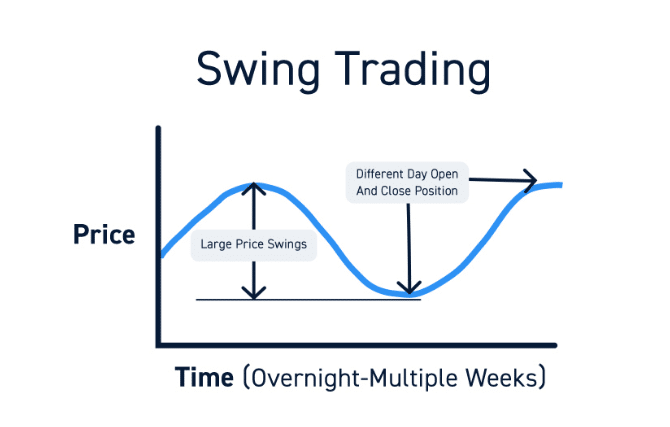
Trade duration varies in swing trading; it allows to hold positions overnight. Swing traders often carry trades for 5-10 days. The risk ratio amount is also different for these traders. Other trading methods may allow a 7-8% stop-loss; swing trading allows only 3-4%, as it focuses on cutting loss quickly.
Best swing trading indicators
There are many technical tools and indicators available to execute swing trading successfully. The top swing trading tools are the Fibonacci retracement, support resistance, technical chart patterns, etc. Meanwhile, the best indicators that swing traders choose are ease of movement, volume, moving average convergence/divergence (MACD), stochastic oscillator, relative strength index (RSI), moving averages, etc.
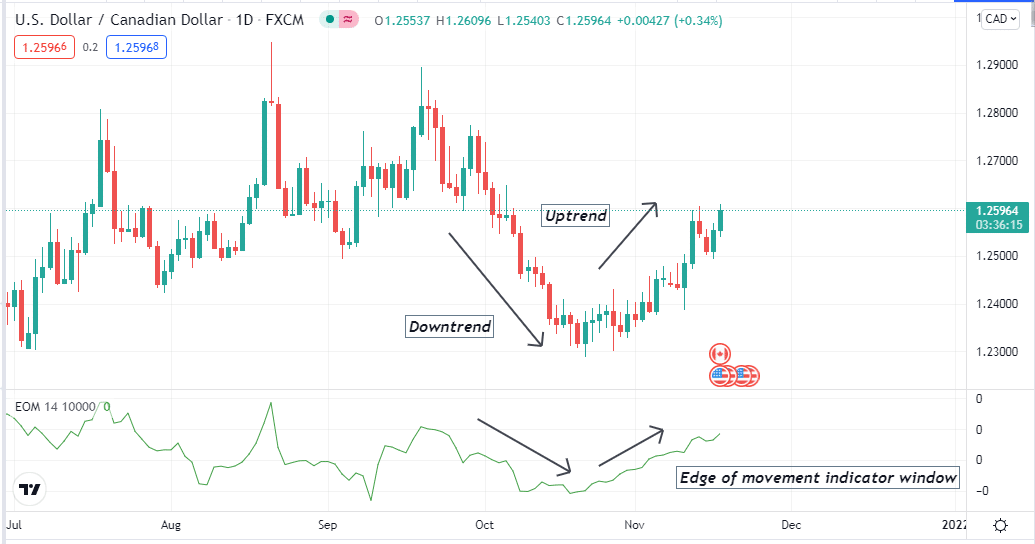
Ease of movement
This indicator shows the strengths of trends.
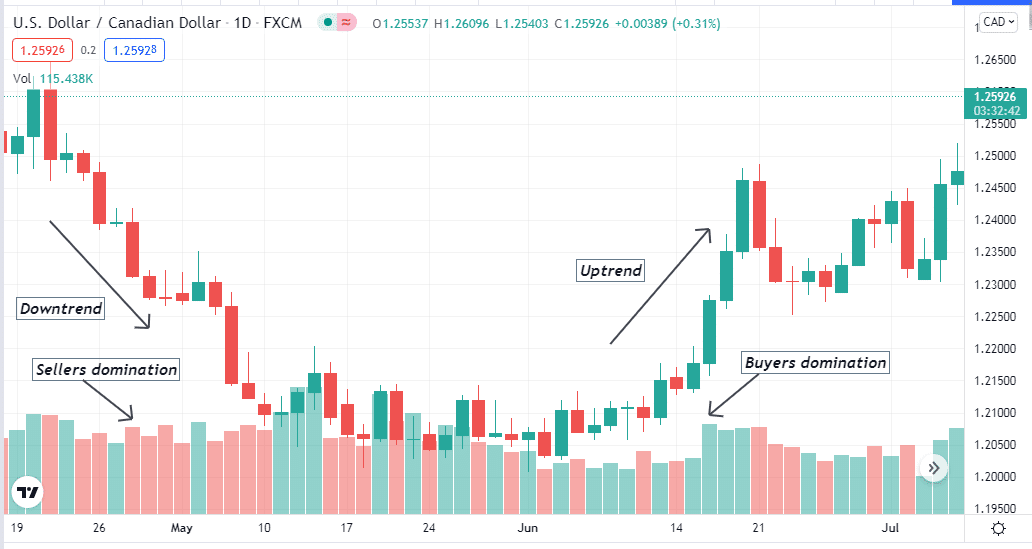
Volume
This indicator shows buyer/seller domination at the asset price for specific periods.
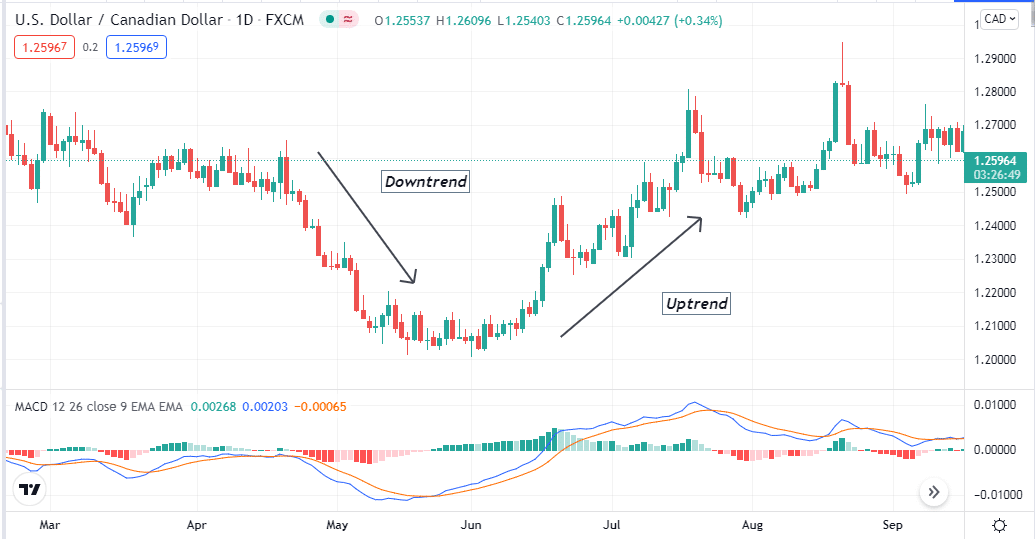
Moving average convergence/divergence (MACD)
This indicator defines the trend and strength of the current trend as well as reversal points.
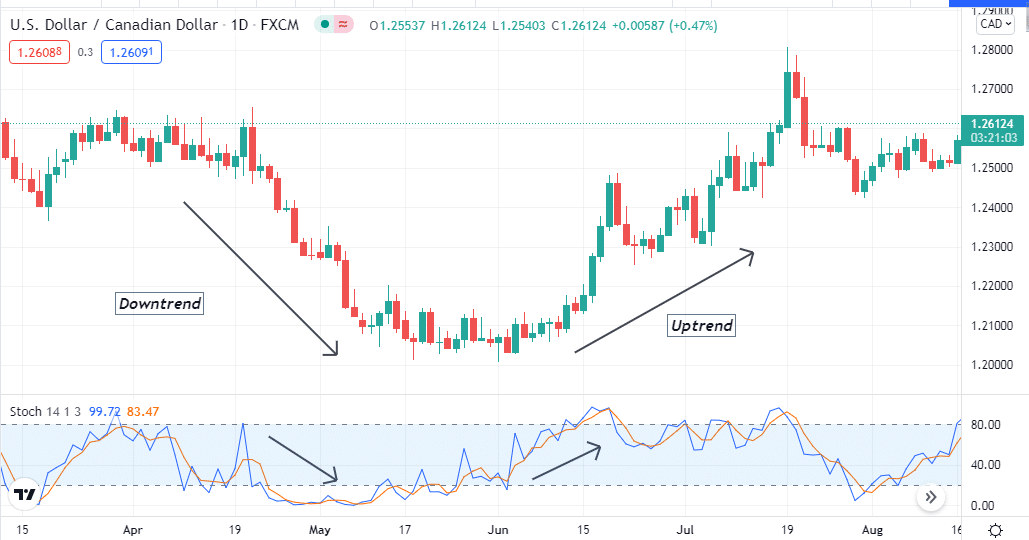
Stochastic oscillator
This indicator identifies swing points and defines trends as well as the oversold and overbought market conditions.
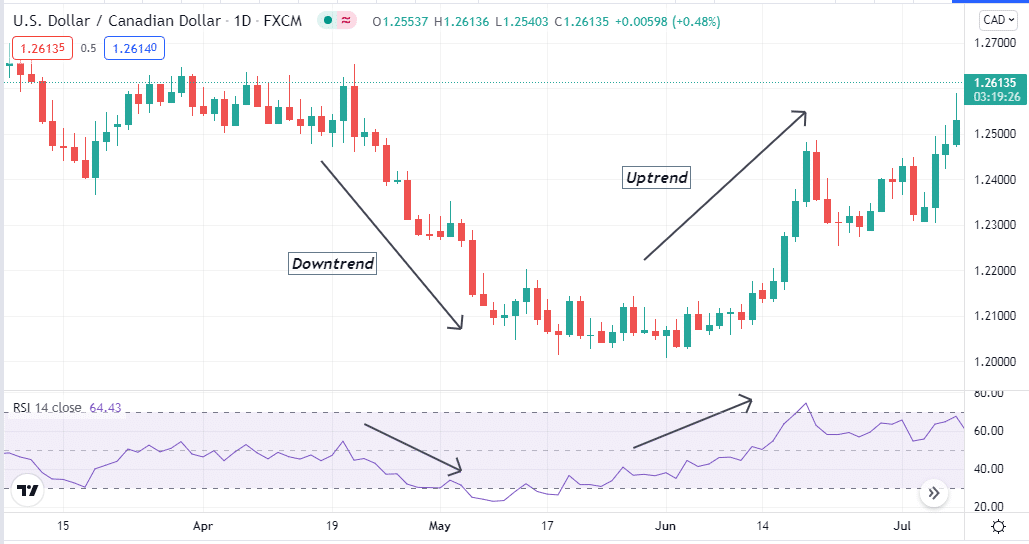
Relative strength index (RSI)
This indicator marks the oversold and overbought conditions besides defining trends.
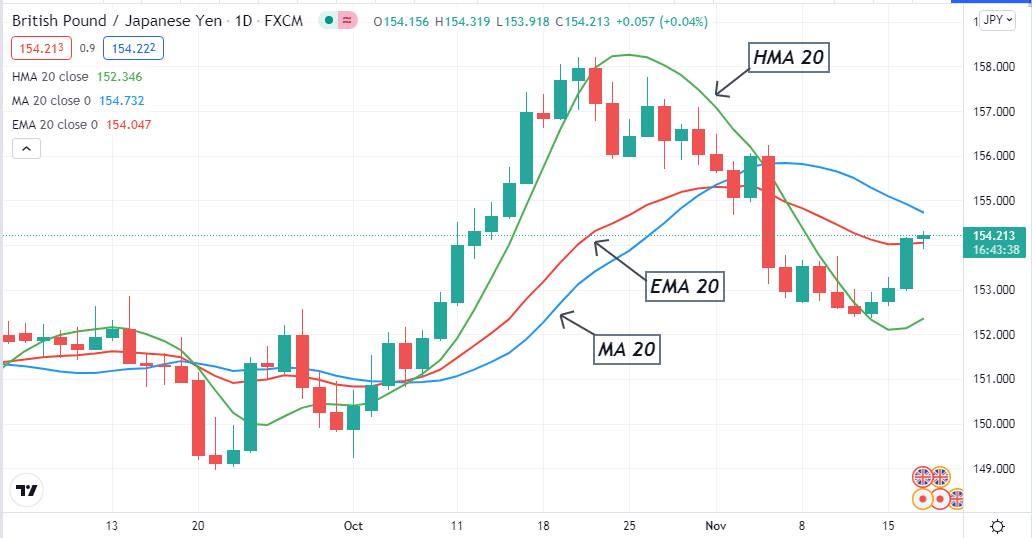
Moving averages
This indicator defines the price changing of assets in specific periods.
A short-term trading method
Our short-term trading method involves different moving averages. Three exponential moving averages are EMA 10, EMA 20, and EMA 50; crossover between those moving average lines generates trade ideas for swing traders.
- EMA 10 is blue
- EMA 20 is green
- EMA 50 is red
This strategy suits trading assets with sufficient volatility. Meanwhile, you will get excellent results applying this strategy on 15 min or hourly charts to catch short-term trades.
Bullish trade scenario
This trading technique suggest bullish pressure on the asset price when:
- The blue EMA crosses the green EMA on the upside.
- The green EMA crosses the red EMA on the upside.
- Both blue and green EMA crosses the red EMA on the upside, and all these EMA lines are heading upward.
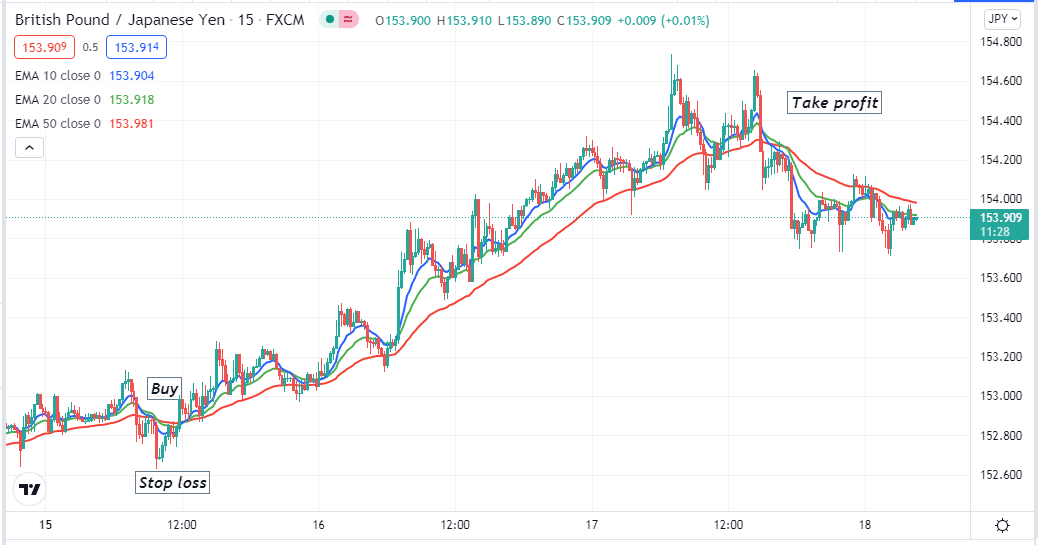
Entry
When these conditions above match your target asset chart, place a buy order.
Stop loss
The initial stop loss level will be below the first swing low of these crossovers.
Take profit
Close the buy position when:
- The blue EMA crosses below the red EMA.
- The green EMA crosses below the red EMA.
Bearish trade scenario
This trading technique suggest bearish pressure on the asset price when:
- The blue EMA crosses the green EMA on the downside.
- The green EMA crosses the red EMA on the downside.
- Both blue and green EMA crosses the red EMA on the downside, and all these EMA lines are heading downward.
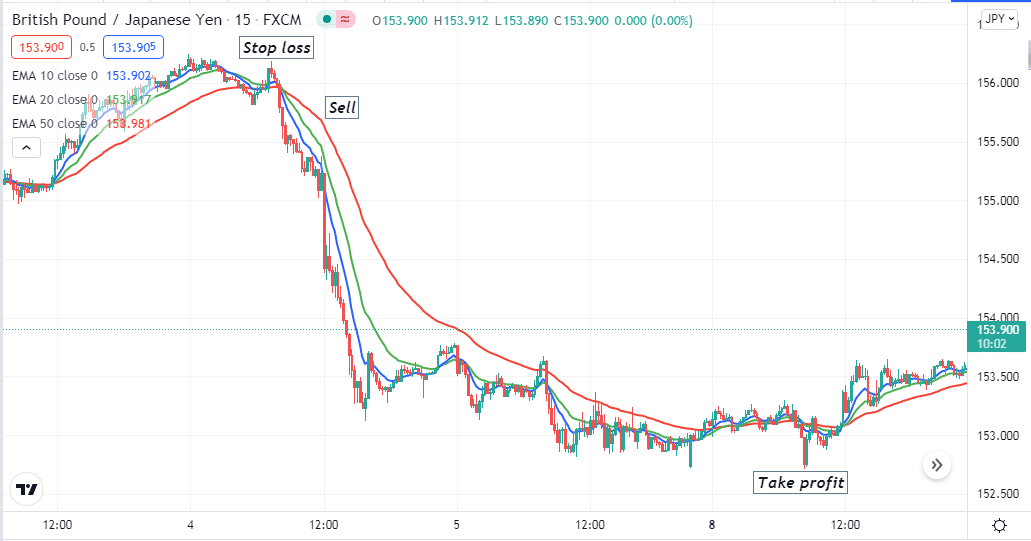
Entry
When these conditions above match your target asset chart, place a sell order.
Stop loss
The initial stop loss level will be above the first swing high of these crossovers.
Take profit
Close the sell position when:
- The blue EMA crosses above the red EMA.
- The green EMA crosses above the red EMA.
A long-term trading technique
Our long-term trading strategy involves using two popular technical indicators, the RSI and MACD. Both indicators show the market context in independent windows. To obtain excellent long-term trading positions, apply this method on an H4 or above time frame charts.
Bullish trade scenario
This strategy suggests fully potential bullish pressure on the asset price when:
- The dynamic blue line crosses the dynamic red line on the upside at the MACD indicator window.
- MACD green histogram bars appear above the central line.
- The RSI dynamic line is at or near the middle (50) line heading toward the upper (80) line.
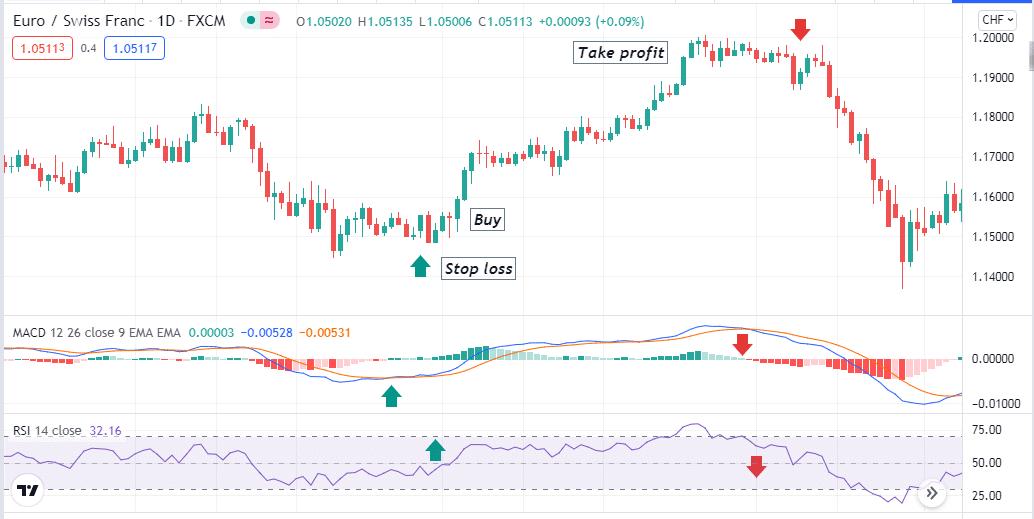
Entry
Match these conditions above with your target asset chart, then place a buy order.
Stop loss
Set an initial stop-loss for your buy order below the recent swing low.
Take profit
Close the buy order when:
- The dynamic blue line crosses the dynamic red line on the downside at the MACD indicator window.
- MACD red histogram bars take place below the central line.
- The RSI dynamic line is at or near the upper (80) line, heading downside.
Bearish trade scenario
This strategy suggests fully potential bearish pressure on the asset price when:
- The dynamic blue line crosses the dynamic red line on the downside at the MACD indicator window.
- MACD red histogram bars appear below the central line.
- The RSI dynamic line is at or near the middle (50) line heading toward the lower (20) line.
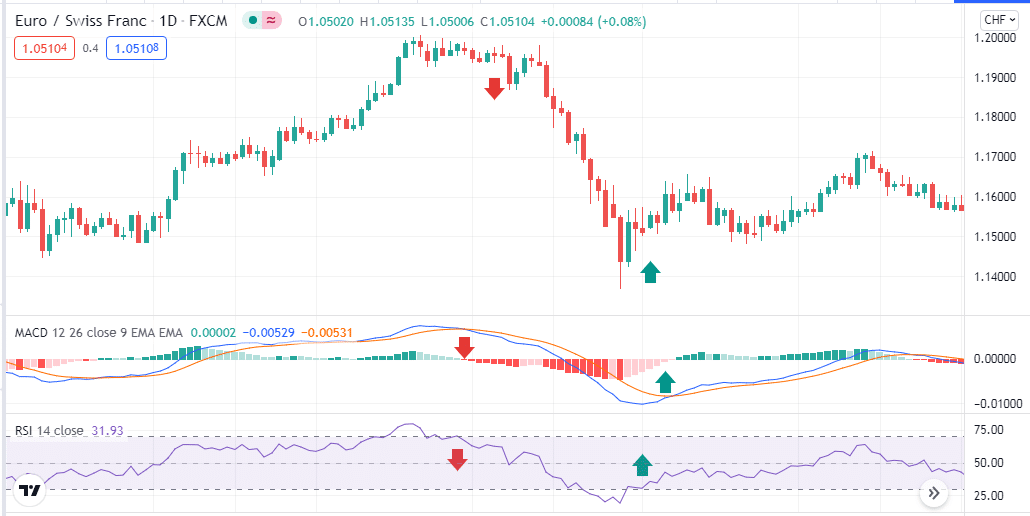
Entry
Match these conditions above with your target asset chart, then place a sell order.
Stop loss
Set an initial stop-loss for your sell order above the recent swing high.
Take profit
Close the buy order when:
- The dynamic blue line crosses the dynamic red line on the upside at the MACD indicator window.
- MACD green histogram bars take place above the central line.
- The RSI dynamic line is at or near the lower (20) line, heading upside.
Pros and cons of the trading method
| Pros | Cons |
| Allow shorter trading durations. | Swing trading can lead to greater losses. |
| Generates trade ideas with greater profits. | Allow catching only a portion of trends while traders can miss bigger profits. |
| Allow trading many financial assets. | Swing trading ideas can fail due to fundamental economic events. |
Final thought
Swing trading is a potential trading technique to make consistently profitable trades. Choose financial assets carefully that have sufficient volatility to execute swing trading positions. Observe the reading of swing trading indicators to sort out more accurate trading positions.