
The Renko trading strategy refers to a unique method to spot smaller price movements to generate considerably profitable trade ideas. This concept is so valuable for trading financial assets, and users can execute constantly profitable trades by using it effectively. So it makes sense that crypto investors also find this method attractive when making trade decisions.
However, it is not wise to start trading using any technical indicator without correctly understanding this tool’s components and operating procedures. This article is to help you to master the Renko trading strategy as it describes complete trade setups with chart attachments.
What is the Renko trading strategy?
When understanding the strategy, it is mandatory to know the Renko charts. They are similar to boxes of different colors with no shadows or wicks on either side. The title of this method comes from the Japanese word “Renga”, which means “Bricks” in English, as it creates a series of bricks of different colors to reflect the price movement. Renko usually ignores time factors meanwhile prior or focuses on price change factors.
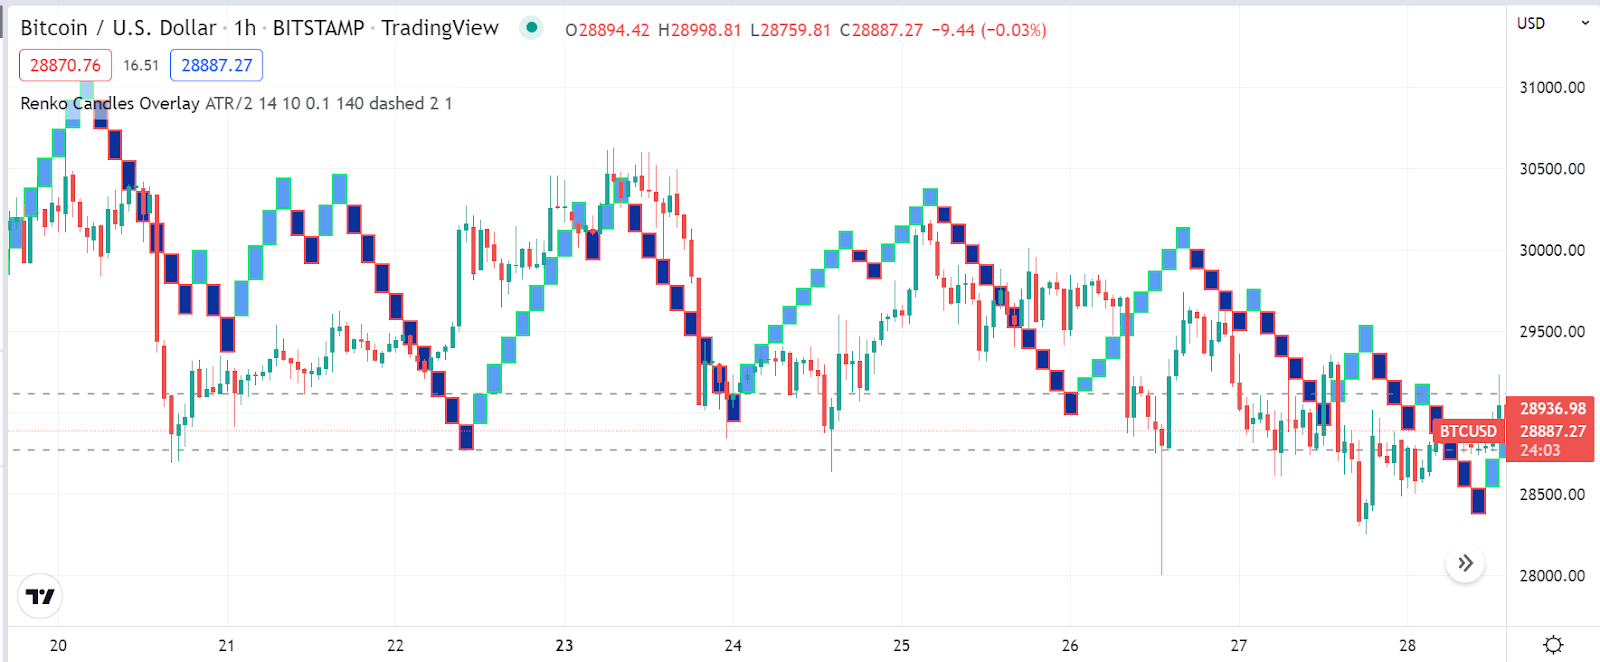
It filters market noise by detecting smaller price movements, and the box size changes according to the strength or weakness of the current trend. So users can easily detect trends using this useful technical tool.
How to trade crypto using the Renko trading strategy?
The Renko trading tool is straightforward. Investors with any level of experience can use this tool. You can use the concept independently or use different technical tools and indicators as a supportive tool to generate trade ideas. For instance, you can use an HMA line alongside this tool. When the price reaches above the HMA line and sky blue bricks appear in the chart, it indicates the initiation of bullish momentum and vice versa. Combining both indicator readings enables determining efficient trading positions.
Short-term trading strategy
We use the MACD indicator as a supportive indicator with the Renko chart to determine trading positions in this trading method. When both indicators confirm, the direction enables executing buy/sell orders. You can create a complete trading strategy combining both indicators readings. This method suits many time frame charts; we prefer 15 min or hourly charts to determine potential short-term trading positions.
Bullish trade scenario
Set both indicators at your target asset chart and seek to open buy positions when the scenarios below appear:
- The Renko chart starts creating sky blue bricks on the bottom side of price candles.
- The dynamic blue line crosses the dynamic red line on the upside at the MACD indicator window.
- MACD green histogram bars take place above the central line.
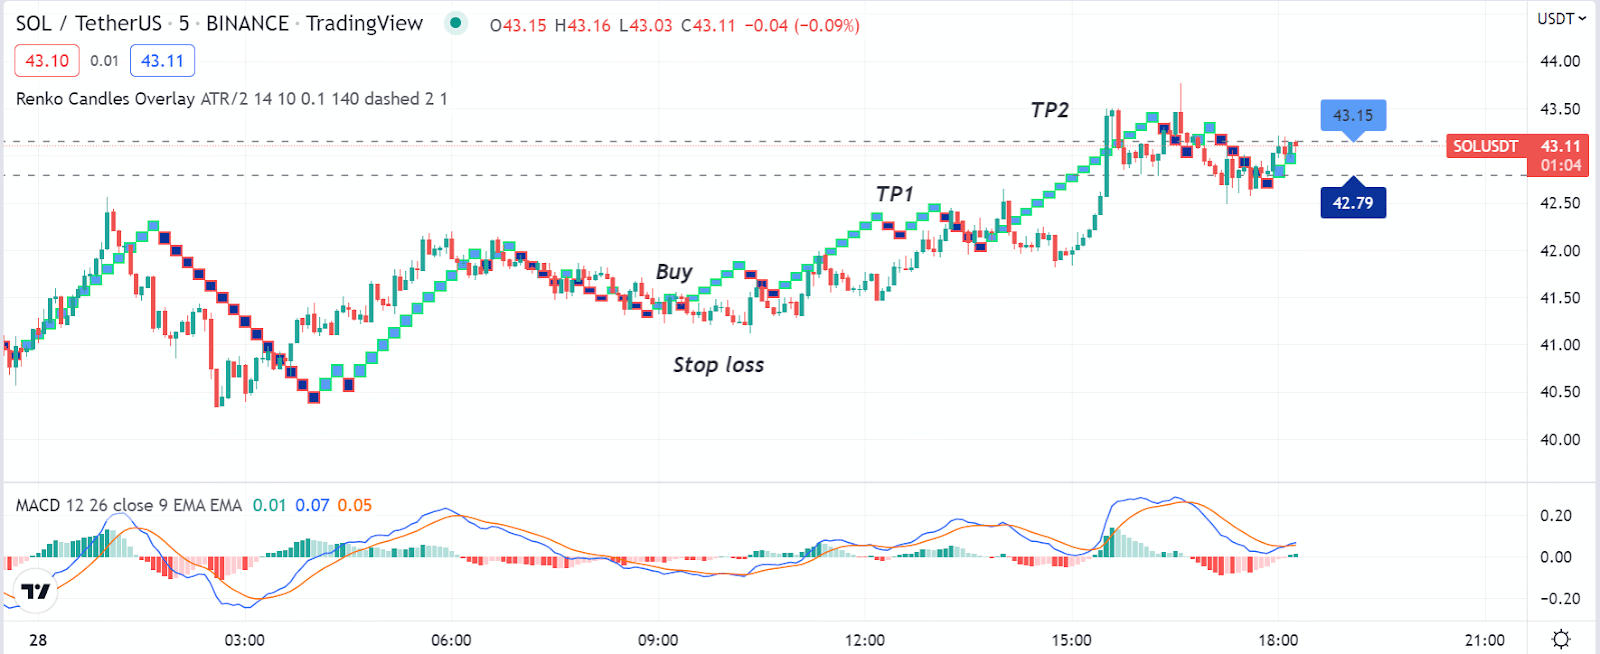
Entry
When these conditions above match, it declares sufficient bullish pressure on the asset price. Open a buy position.
Stop loss
The initial stop loss will be below the current swing low.
Take profit
Close the buy order by matching the readings below:
- The Renko chart starts to create deep blue bricks.
- The dynamic blue line gets below the dynamic red line at the MACD indicator window.
- MACD red histogram bars appear below the central line.
Bearish trade scenario
Set both indicators at your target asset chart and seek to open sell positions when the scenarios below appear:
- The Renko chart starts creating deep blue bricks on the top side of price candles.
- The dynamic blue line crosses the dynamic red line on the downside at the MACD indicator window.
- MACD red histogram bars take place below the central line.
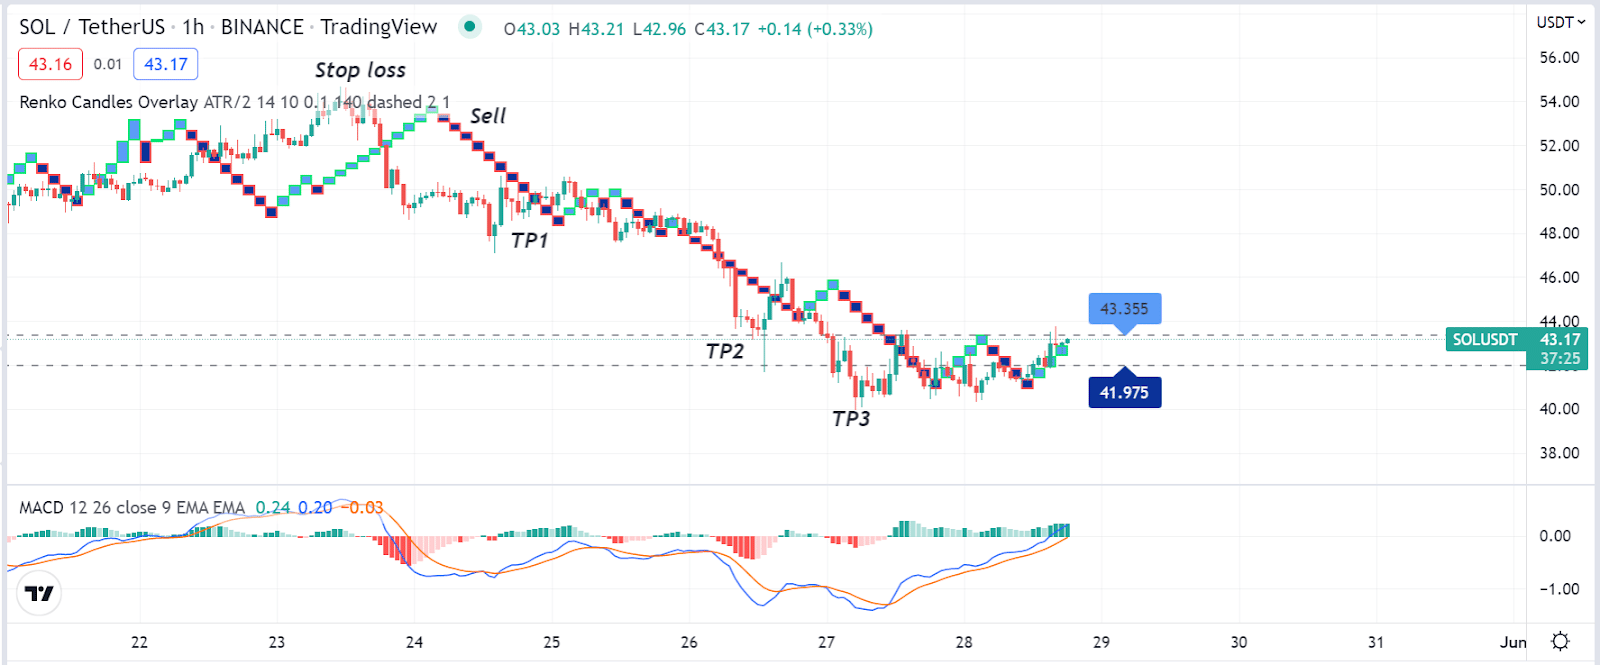
Entry
When these conditions above match, it declares sufficient bearish pressure on the asset price. Open a sell position.
Stop loss
The initial stop loss will be above the current swing high.
Take profit
Close the sell order by matching the readings below:
- The Renko chart starts to create sky blue bricks.
- The dynamic blue line gets above the dynamic red line at the MACD indicator window.
- MACD green histogram bars appear above the central line.
Long-term trading strategy
This trading method contains two technical indicators:
- Ichimoku cloud
- Renko charts
Combining both indicators readings makes it easier to determine trades’ trends and entry/exit points. We suggest using this method on daily or H4 charts to obtain the best results.
Bullish trade scenario
This method suggests opening buy positions when the conditions below occur:
- The Tenkan-sen is above the Kijun-sen.
- Chikou Span line is above price candles.
- Price candles are above the cloud (green or red).
- Renko sky blue bricks appear and start making a series of 45-degree angles on the upside.
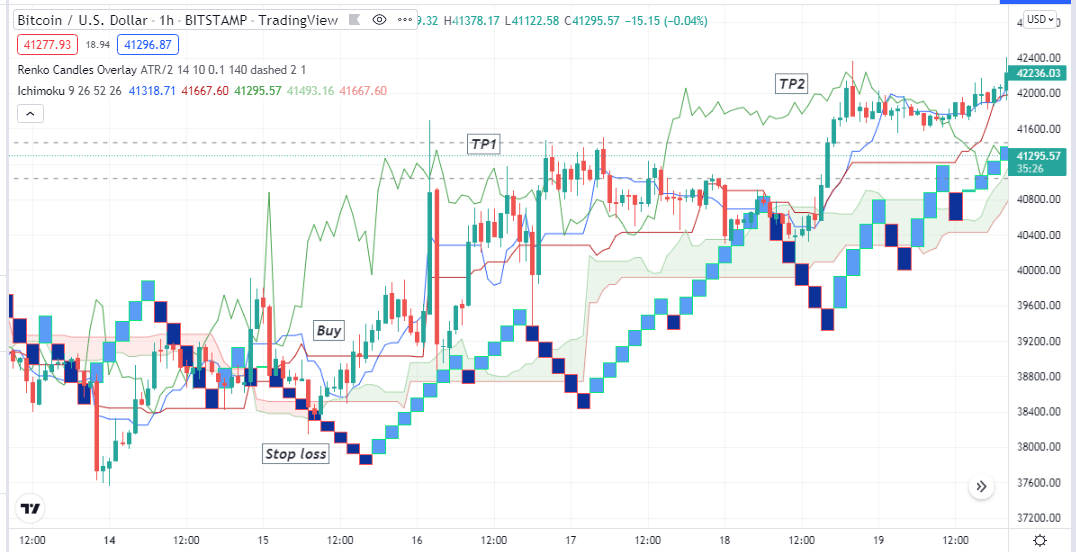
Entry
Enter a buy order after matching the conditions above.
Stop loss
Place an initial stop loss below the current bullish momentum.
Take profit
You can continue your buy order till the price remains above the green cloud. Close the buy position when the appearance below occurs:
- Renko bricks turn deep blue.
- The Tanken-Sen line crosses below the Kijun-sen line.
- The Chikou Span line is crossing the price on the downside.
Bearish trade scenario
This method suggests opening sell positions when the conditions below occur:
- The Tenkan-sen is below the Kijun-sen.
- The Chikou Span line is below-price candles.
- Price candles are below the cloud (green or red).
- Renko deep blue bricks appear and start making a series of 45-degree angles on the upside.
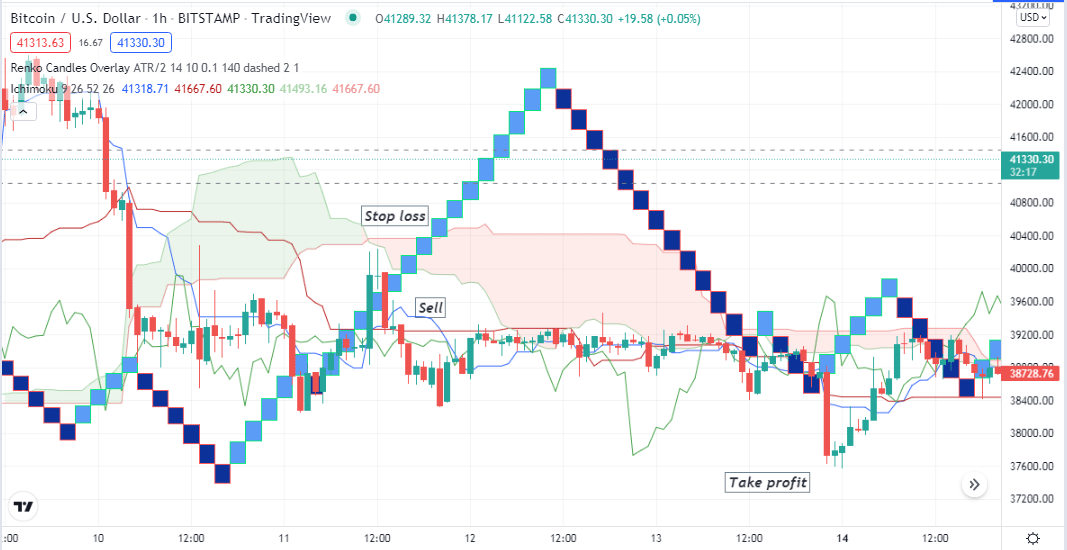
Entry
Enter a sell order after matching the conditions above.
Stop loss
Place an initial stop loss above the current bearish momentum.
Take profit
You can continue your sell order till the price remains below the red cloud. Close the sell position when the appearance below occurs:
- Renko bricks turn sky blue.
- The Tanken-Sen line crosses above the Kijun-sen line.
- The Chikou Span line is crossing the price on the upside.
Pros and cons
| Pros | Cons |
|
|
|
|
|
|
Final thought
Finally, the strategy helps trade many trading assets, including cryptos. To use this technical concept most effectively, combine many other technical tools and indicators such as Parabolic SAR, moving averages, RSI, etc. Master the concept by doing sufficient practice before using it in live trading.


