 Crypto Strategy: How to Expose Potential Trades?")
The Directional Movement Index (DMI) is a preferable technical indicator while measuring the future price direction of any crypto asset. It consists of several lines that a trader can use to find the potential price direction.
It is not wise to trade using any technical tool or indicator without knowing the primary components, calculation pattern, and effective ways of use. This article will introduce the DMI indicator and sustainable trading methods using chart attachments.
What is the DMI indicator?
It is a popular technical tool for financial traders to determine the trend strength and the trend directions. J. Welles Wilder is the developer of this indicator and the developing period is 1978.
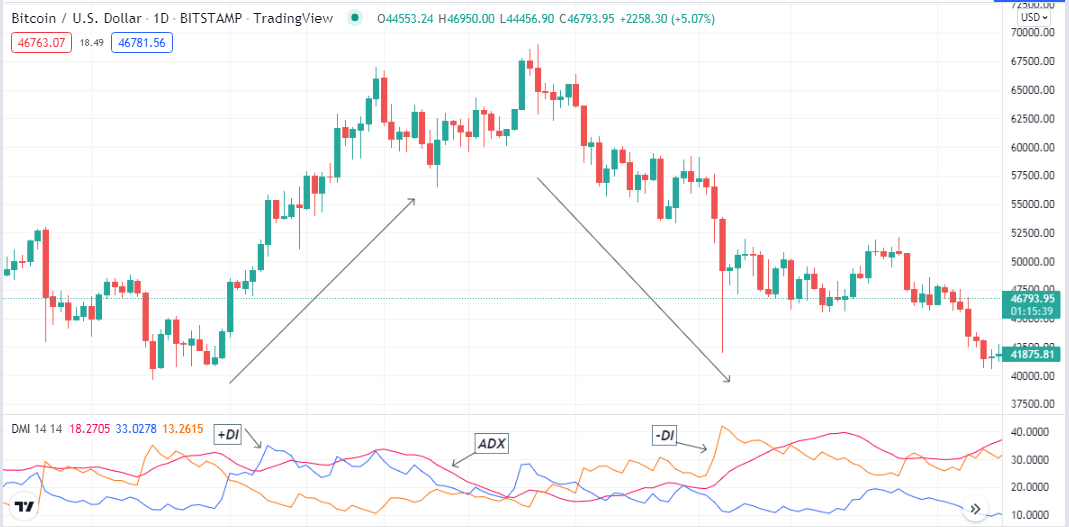
The indicator shows readings on an independent window containing three dynamic lines.
- Positive Directional index line (+DI).
- Average Directional Index (ADX).
- Negative Directional Index (-DI).
It reduces false signals by combining readings from these dynamic lines. The tool is preferable as it shows both the direction and strengths.
How to use DMI indicator in crypto trading?
It is easy to generate trade ideas through the indicator as it calculates the market data and effectively shows results.
- When the +DI line surpasses the -DI line on the upside, it declares an initiation of bullish momentum.
- Meanwhile, the -DI line reaches above the +DI line with the increasing declining pressure on the asset price.
The third line is the ADX line, which measures the current trend’s strength. Investors usually consider that the direction may have sufficient power when the reading of this indicator rises above 20. You can use this tool independently while making trade decisions or combine readings of the DMI indicator with other technical tools to create a potentially profitable strategy.
Short-term trading strategy
We use the Parabolic SAR alongside the DMI indicator to determine short-term trading positions in crypto assets in this trading method. Parabolic SAR makes a series of dots above/below price candles to show the current trend. The dots flip as a valid swing high/low occurs by the price movement. This strategy works fine on many time frame charts; we recommend an H1 or a 15 min chart to get the best trade setups.
Bullish trade scenario
Apply those indicators at your target asset chart and seek to open buy positions when:
- The +DI (blue) line surpasses the -DI (orange) line on the upside at the DMI indicator window.
- The ADX value rises above 20.
- The Parabolic SAR dots start making a series below price candles.
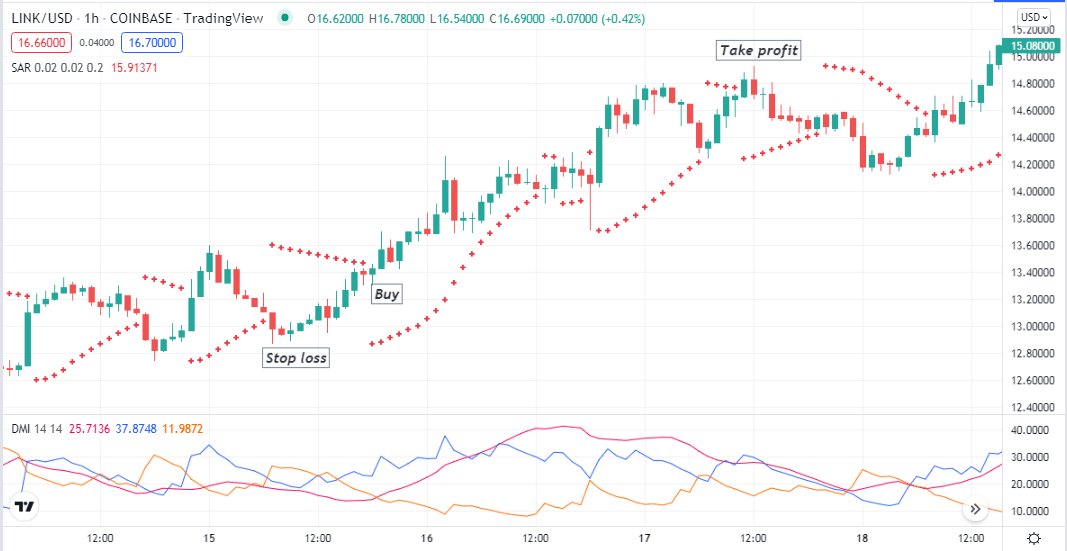
Entry
Match these conditions above and open a buy position.
Stop loss
Place an initial stop loss below the current swing low with a buffer of 5-10pips.
Take profit
Close the buy order when:
- The dynamic blue (+DI) line drops below the dynamic orange (-DI) line in the DMI indicator window.
- The ADX value drops below 20.
- Parabolic SAR dots switch on the upside.
Bearish trade scenario
Apply those indicators at your target asset chart and seek to open buy positions when:
- The -DI (orange) line surpasses the +DI (blue) line on the upside at the DMI indicator window.
- The ADX value rises above 20.
- The parabolic SAR dots start making a series above price candles.
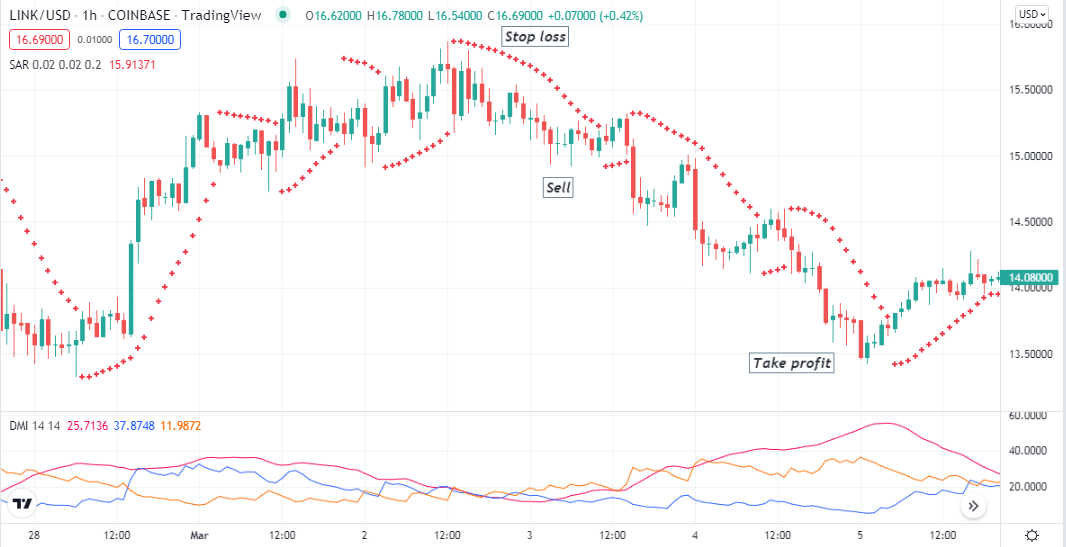
Entry
Match these conditions above and open a sell position.
Stop loss
Place an initial stop loss above the current swing high with a buffer of 5-10pips.
Take profit
Close the sell order when:
- The dynamic orange (-DI) line drops below the dynamic blue (+DI) line in the DMI indicator window.
- The ADX value drops below 20.
- Parabolic SAR dots switch on the downside.
Long-term trading strategy
We recommend using an H4 or a daily chart to get trade setups when seeking long-term trading positions. In this trading method, we use the volume indicator and a hull moving average (HMA) of 21 periods alongside the DMI indicator.
HMA is a simple indicator that reduces lags of other MAs such as SMA. We enter at any trades through this trading method by confirmation from all three indicators, enabling participation in more potential trades.
Bullish trade scenario
Implement all three indicators at your target asset chart and observe when:
- +DI line crosses the -DI on the upside at the DMI indicator window.
- The ADX value rises above 20.
- Price closes above the HMA line, and the HMA line slops on the upside.
- The volume indicator declares buyers’ domination on the asset price.
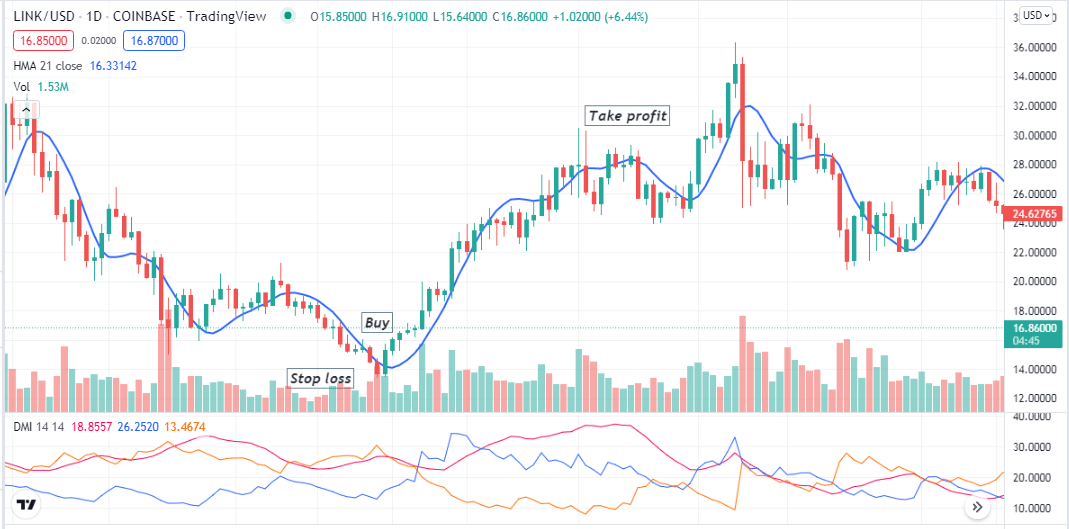
Entry
When these conditions match your target asset chart, it indicates bullish momentum. Open a buy order.
Stop loss
Place an initial stop loss below the current bullish momentum.
Take profit
Close the buy order when:
- +DI line drops below the -DI line on the DMI indicator window.
- The ADX value drops below 20.
- Price closes below the HMA line, and the HMA line starts sloping on the downside.
- The volume indicator shows increasing selling volume.
Bearish trade scenario
Implement all three indicators at your target asset chart and observe when:
- -DI line crosses the +DI on the upside at the DMI indicator window.
- The ADX value rises above 20.
- Price closes below the HMA line, and the HMA line slops on the downside.
- The volume indicator declares sellers’ domination on the asset price.
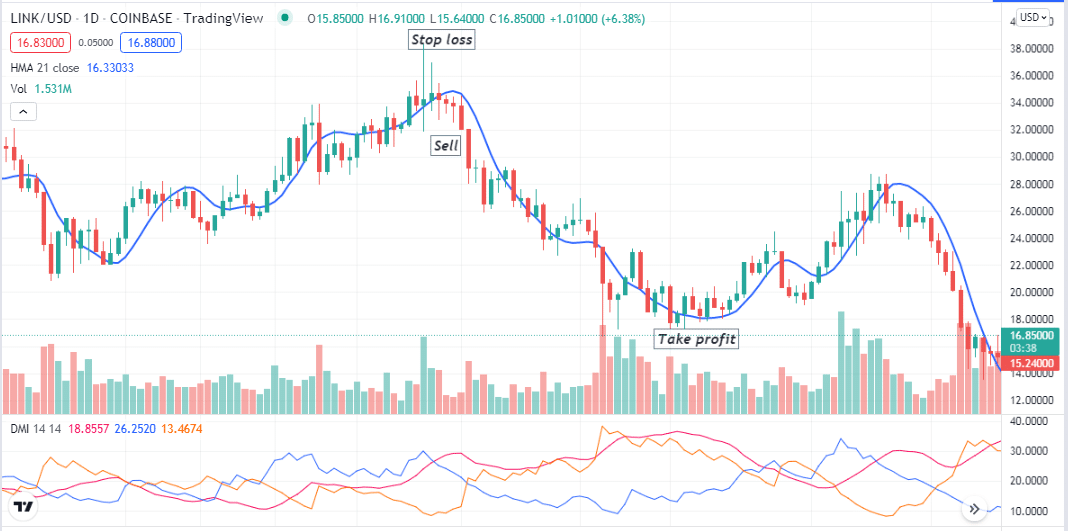
Entry
When these conditions match your target asset chart, it indicates a bearish momentum. Open a sell order.
Stop loss
Place an initial stop loss above the current bearish momentum.
Take profit
Close the sell order when:
- -DI line drops below the +DI line on the DMI indicator window.
- The ADX value drops below 20.
- Price closes above the HMA line, and the HMA line starts sloping on the upside.
- The volume indicator shows increasing buy volume.
Pros & cons
| Pros | Cons |
|
|
|
|
|
|
Final thought
Finally, the DMI indicator is popular among financial traders as you can use the readings to confirm price action. It is widely acceptable to financial traders for its functionalities. However, in consolidating phases, this indicator generates false or confusing signals, and avoid trade with this indicator in those situations.


