
Indicator-based trading is a common practice among successful financial investors. Hundreds of technical indicators and tools determine the most potent trading positions with different appearances, calculations, and functionalities. The Donchian Channels is one of the best trading indicators expert crypto traders rely on.
However, when seeking to use any indicator to execute successful trades, it is mandatory to understand functionalities, features, and professionals’ way of use. This article will reveal the Donchian Channels (DC) indicator that allows you to make profits in both uptrend and downtrend price movements.
What is the Donchian channels indicator?
It is a technical indicator that contains three lines, which makes channels. The price moves within the channel, and Richard Donchian is the developer of this indicator. The upper band of this indicator declares the highest/peak price of the asset for a certain period, whereas the lower band use to show the lower price of that particular period.
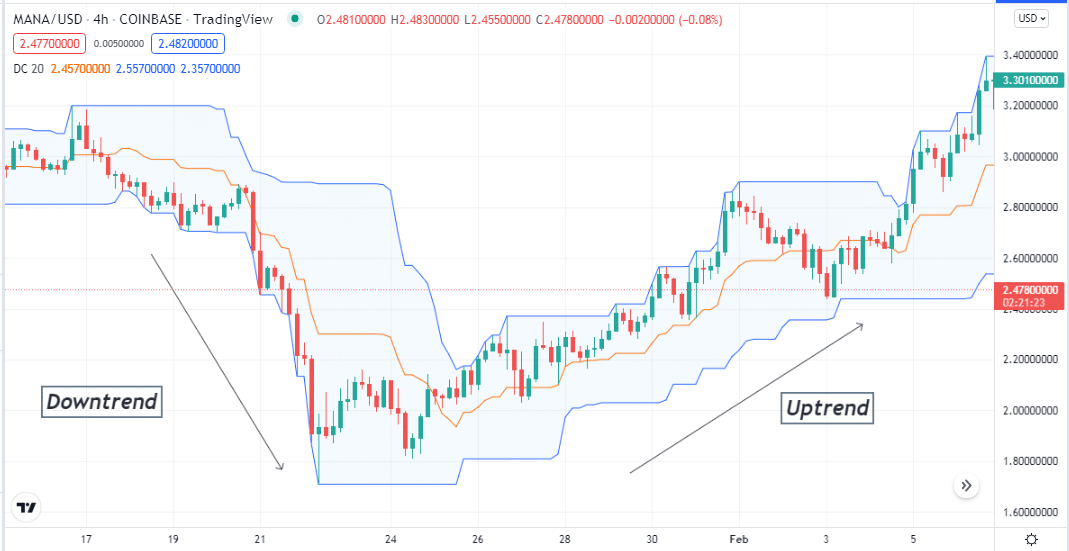
This technical indicator is very useful with multiple functionalities as you can use it to define potential oversold/overbought, breakouts, and measuring volatility. It may share similarities in appearance to the Bollinger Bands, but the calculation is different. The default value of this indicator is 20 and is usually available on many trading platforms in the section of default technical indicators.
How to use the Donchian Channels indicator in crypto trading?
Cryptocurrencies are similar to other financial assets when conducting technical analysis. Technical indicators generate the same trading ideas depending on market context and relative calculations. When you seek to use the DC indicator at crypto trading, you can use it for determining support resistance points, swing points, trends, etc.
This trading indicator suits many trading assets, including commodities, stocks, currencies, cryptocurrencies, etc. The price remains on the upper channel or between the upper and middle bands. You can consider the buyers are in control of the price movement. On the other hand, when the price declines, it remains on the lower channel of the indicator. You can use it to create a complete trading strategy or combine the reading with other technical tools and indicators to generate profitable trade ideas.
Short-term trading strategy
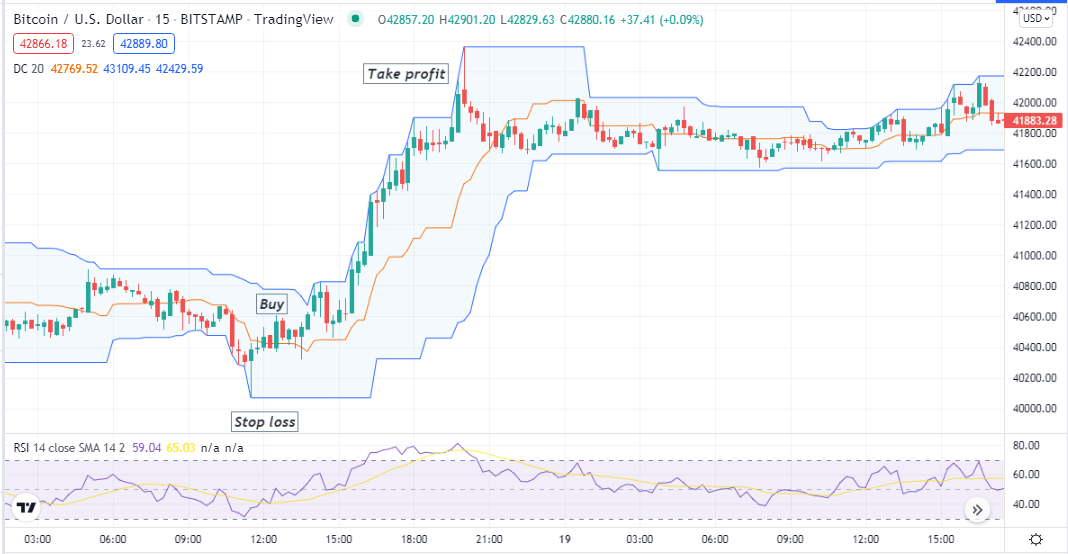
We use the RSI indicator alongside the DC indicator to generate short-term trading ideas in this trading method. This method suits many time frame charts on any crypto chart. We recommend using a 15-min or hourly chart to catch the most potent short-term trades.
Bullish trade scenario
First, implement both indicators in your target asset chart. Then seek to open buy positions when the price gets the lower band of the DC indicator. Observe when:
- The price bounces back toward the middle band from the lower band of the DC indicator.
- The price crosses the middle band of the DC on the upside.
- The RSI dynamic line is near the central (50) line heading toward the upper (70) level.
Entry
When these conditions above match your target asset chart, it declares sufficient bullish pressure on the asset price, and the price may enter a bullish trend. Place buy order.
Stop loss
The initial stop loss for your buy order will be below the current swing low with a buffer of 5-10pips.
Take profit
Close the buy order when:
- The price reaches the upper band of the DC indicator or starts to decline toward the middle band after reaching that level.
- The RSI dynamic line is above the upper (70) level or starts to drop below that level toward the central (50) level.
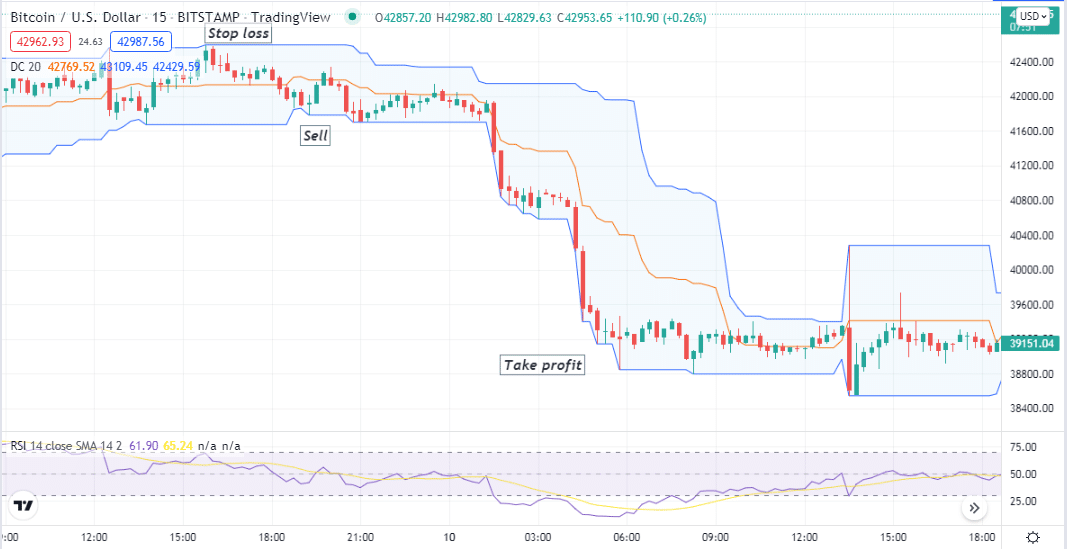
Bearish trade scenario
First, implement both indicators in your target asset chart. Then seek to open sell positions when the price gets the upper band of the DCl indicator. Observe when:
- The price declines back toward the middle band from the upper band of the DC indicator.
- The price crosses the middle band of the DC on the downside.
- The RSI dynamic line is near the central (50) line heading toward the lower (30) level.
Entry
When these conditions above match your target asset chart, it declares sufficient bearish pressure on the asset price, and the price may enter a bearish trend. Place sell order.
Stop loss
The initial stop loss for your sell order will be above the current swing high with a buffer of 5-10pips.
Take profit
Close the sell order when:
- The price reaches the lower band of the DC indicator or starts to bounce toward the middle band after reaching that level.
- The RSI dynamic line is below the lower (30) level or starts to rise above that level toward the central (50) level.
Long-term trading strategy
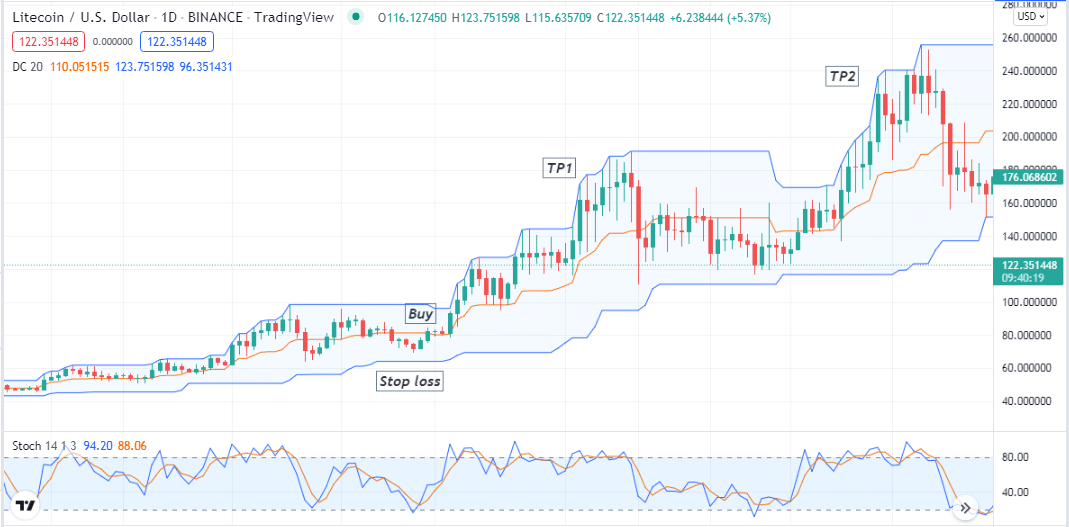
In this trading method, we use the Stochastic oscillator besides the DC indicator as a supportive indicator to generate long-term trading positions. The preferable time frame to catch potential long-term trades through this trading method is an H4 or daily chart.
Bullish trade scenario
Seek to open buy positions when:
- The price enters at the upper channel of the DC indicator.
- The dynamic blue line gets above the dynamic red line on the Stochastic oscillator indicator near the bottom line.
Entry
Match these conditions above and place a buy order.
Stop loss
The stop loss level will be below the current bullish momentum.
Take profit
Close the buy order when:
- The price starts declining from the upper band of the DC indicator.
- The dynamic blue line drops below the dynamic red line of the Stochastic oscillator indicator, and both head toward the downside.
Bearish trade scenario
Seek to open sell positions when:
- The price enters at the lower channel of the DC indicator.
- The dynamic blue line gets below the dynamic red line on the Stochastic oscillator indicator near the upper line.
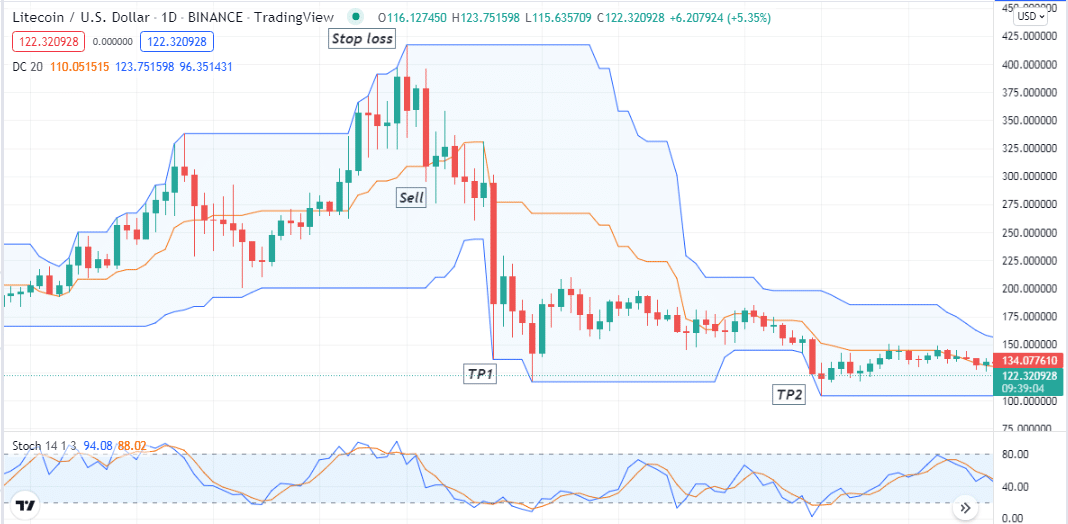
Entry
Match these conditions above and place a sell order.
Stop loss
The stop loss level will be above the current bearish momentum.
Take profit
Close the sell order when:
- The price starts rising from the lower band of the DC indicator.
- The dynamic blue line gets above the dynamic red line of the Stochastic oscillator indicator, and both head toward the upside.
Pros & cons
| Pros | Cons |
| The DC indicator allows making trades in the direction of the current trend. | The tool only depends on technical data while suggesting trades. |
| The indicator suits many trading assets. | This indicator can fail due to fundamental reasons. |
| You can catch both long-term and short-term trades using the indicator. | This indicator is not so useful in consolidating phases of the price movement. |
Final thought
Finally, this article introduces one of the most effective trading indicators that you can use to execute unlimited successful trades on crypto assets. We suggest mastering these strategies by practicing them before applying them to live crypto trading.


