
If you want to build a trend detector using technical indicators, you can include Bollinger Bands (BB) in your system. It is a sophisticated trading tool that shows the market sentiment in both trending and ranging phases.
Forex indicators are programs that show the market sentiment based on some specific parameters. Investors use these tools to find the market performance and predict what may happen in the future. However, no technical indicator can provide you a guarantee of profit. But, if you can implement it with trade management rules, you can surely achieve your target.
If you want to use Bollinger Bands in your trading system, the following section is for you. Here we will discuss the critical elements of BB, including a vital explanation.
Basic of Bollinger Bands
John Bollinger created this fantastic indicator in the 1980s as a stock trading element. It is a volatility-based trading tool that calculates trading instruments’ high or low prices compared to the previous candle.
This indicator uses standard deviation as an essential element to define price volatility. We know from the basics of Standard deviation that the perfect market correlation stays with the 0 levels. If the standard deviation is above zero, the trading instrument will react more to the price change. Conversely, the standard deviation below zero is a sign of a negative market correlation.
But how does this concept work in the BBs?
BB is a combination of three lines, and when the market volatility increases, these Bands will expand. Similarly, when the market sentiment remains corrective, Bands will remain closed.
Upper Band
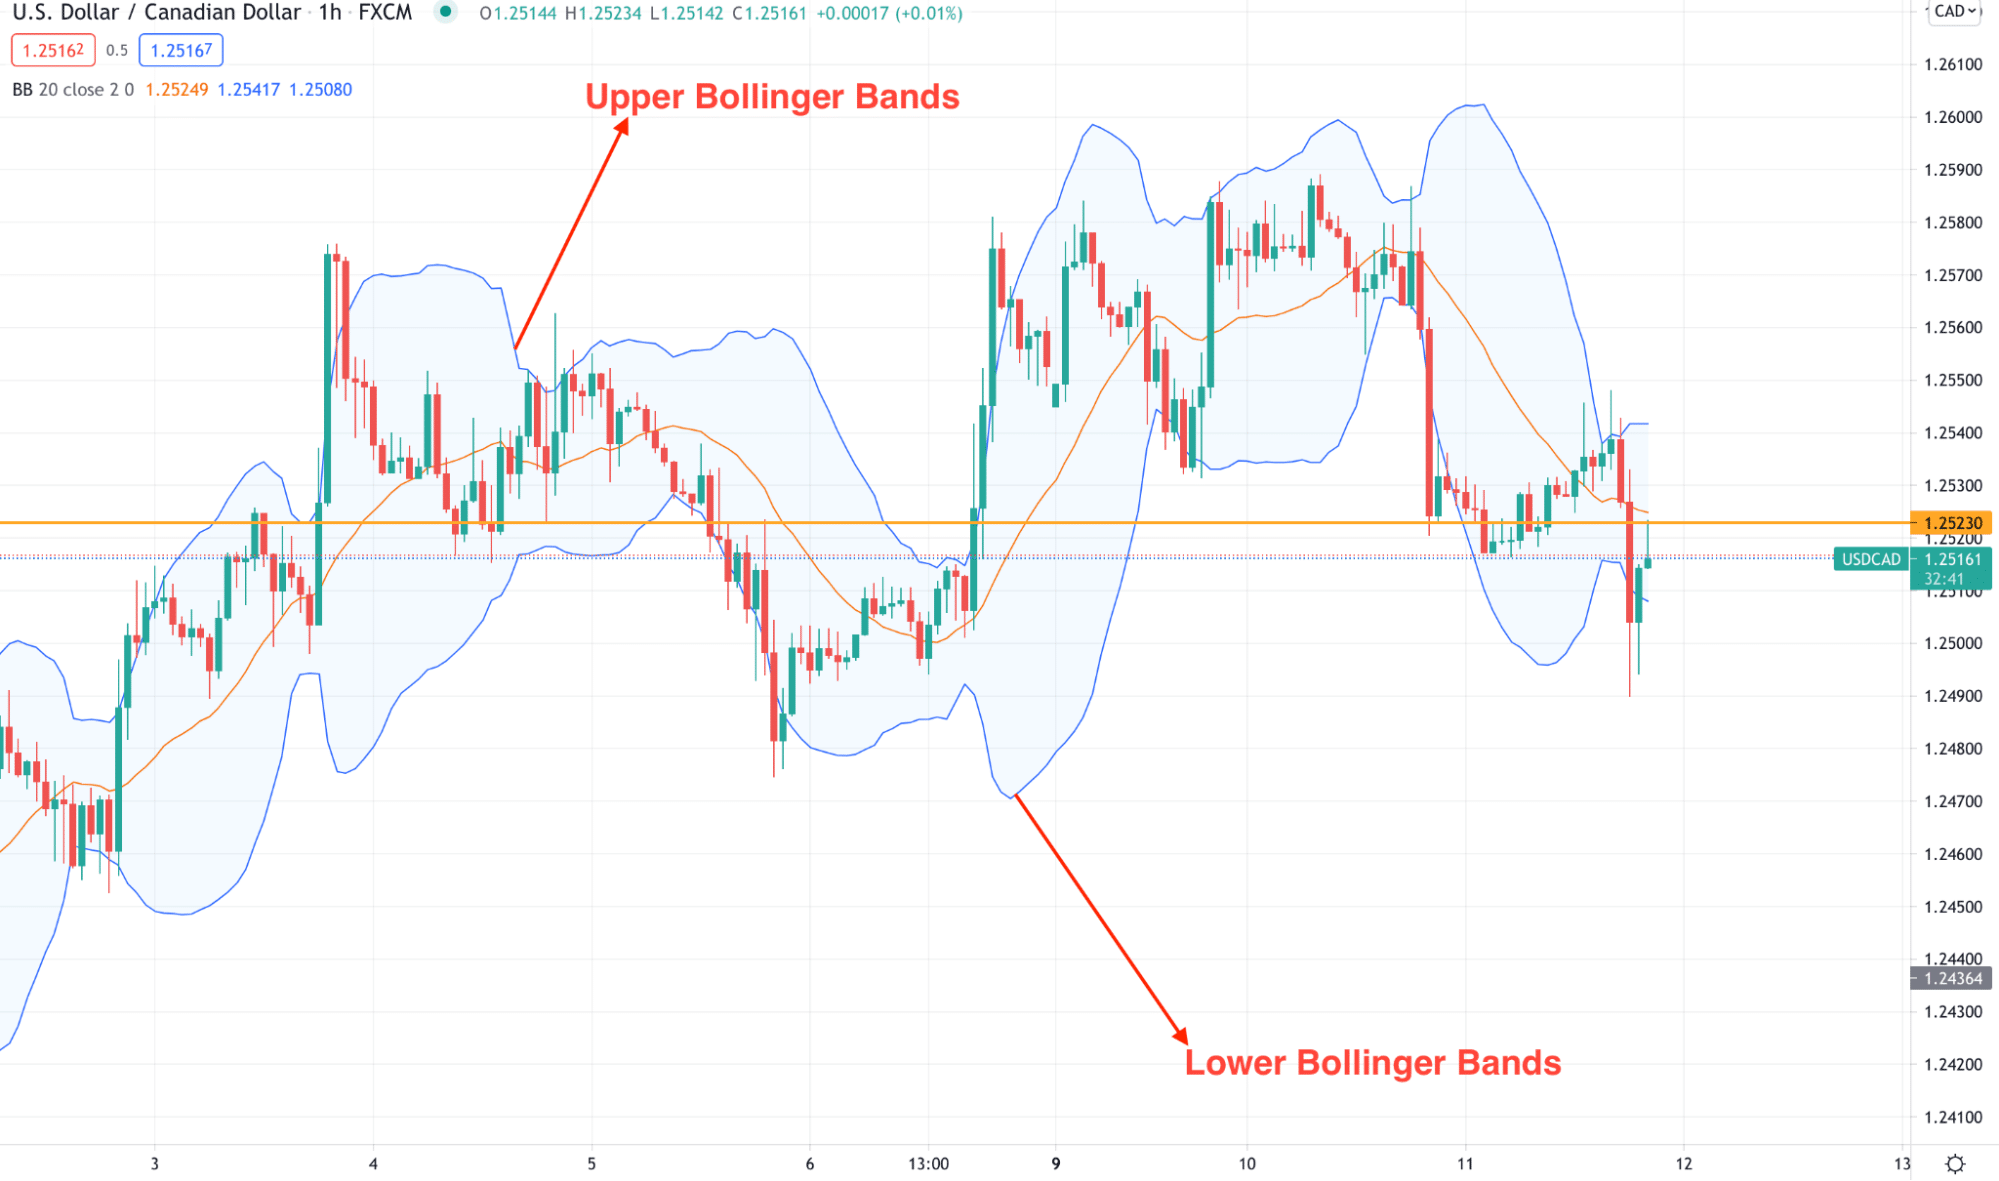
BB has three dynamic lines from where the upper Bands work as dynamic resistance to the price. If the price reaches upper Bollinger Bands, it may face minor resistance. Therefore, if the overall market context is selling, you can open a good selling position after finding a rejection and bearish candle close from the upper Bands.
Lower Band
Remember that the lower BB is a dynamic level like the traditional moving average, and it changes its direction with the movement of price. It is similar to the upper Bands, but it usually remains below the price and provides minor support. Any rejection from the lower Band with a bullish candle close indicates a possible buying entry in an upturn.
Now, look at the image below where the upper and lower BB are marked.
What Bollinger Band tells us
In any financial trading, it is essential to understand every element you use as a tool. BBs have a strong logic behind their formation, but it cannot guarantee success. You have to find the most effective way to use parameters like BBs.
It does not mean whether you trade a trend or against the trend. You can always use parameters like today and find the price direction. Let’s see the use of Bands in the trending or non-trending phase.
The squeeze
In the forex market, squeezing happens when multiple tool elements come close in the absence of liquidity.
Why does the squeeze happen?
When buyers’ domination exceeds the seller’s, the price moves in forex trading; it usually happens when most big traders are in the market. On the other hand, the absence of big volume barely makes a movement indicating a squeeze.
Now, look at the image below to see how we can find the squeeze using BB.
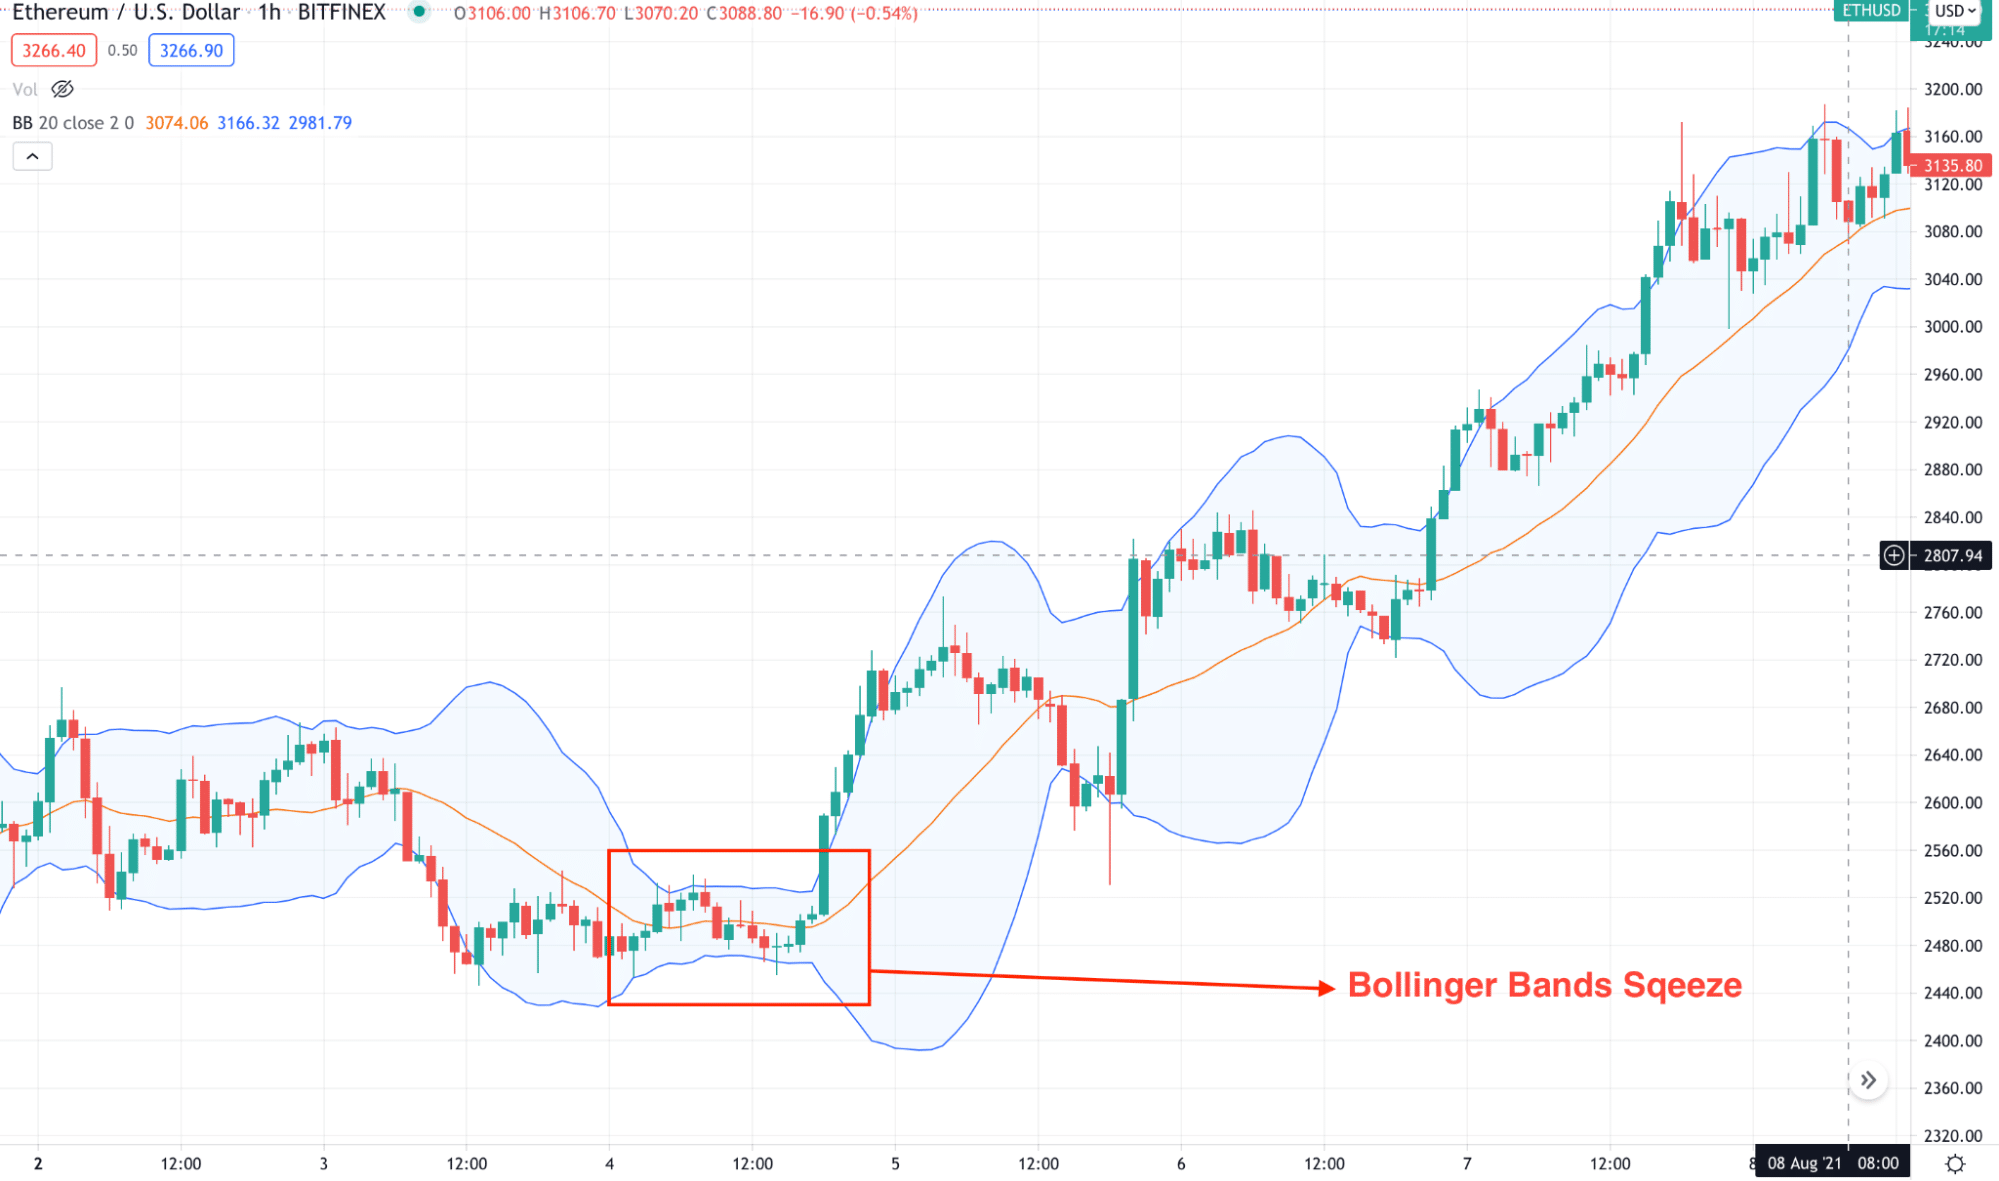
As per the above image, when the upper and lower Bands were closed, the price made a corrective movement without breaking any near-term level. It is an indication of corrective market pressure where this indicator tells us to wait for a breakout.
The breakout
It is a process where buyers and sellers remain active in the price and move with solid pressure. We can spot it in the naked chart by observing the market level and pressure. However, the best approach is to use upper and lower Bands.
So why does the breakout happen?
The breakout is a process when the price doesn’t follow the mean reversion force of the Bollinger Bands. In this process, the price should close beyond Bands, pointing out the breakout direction.
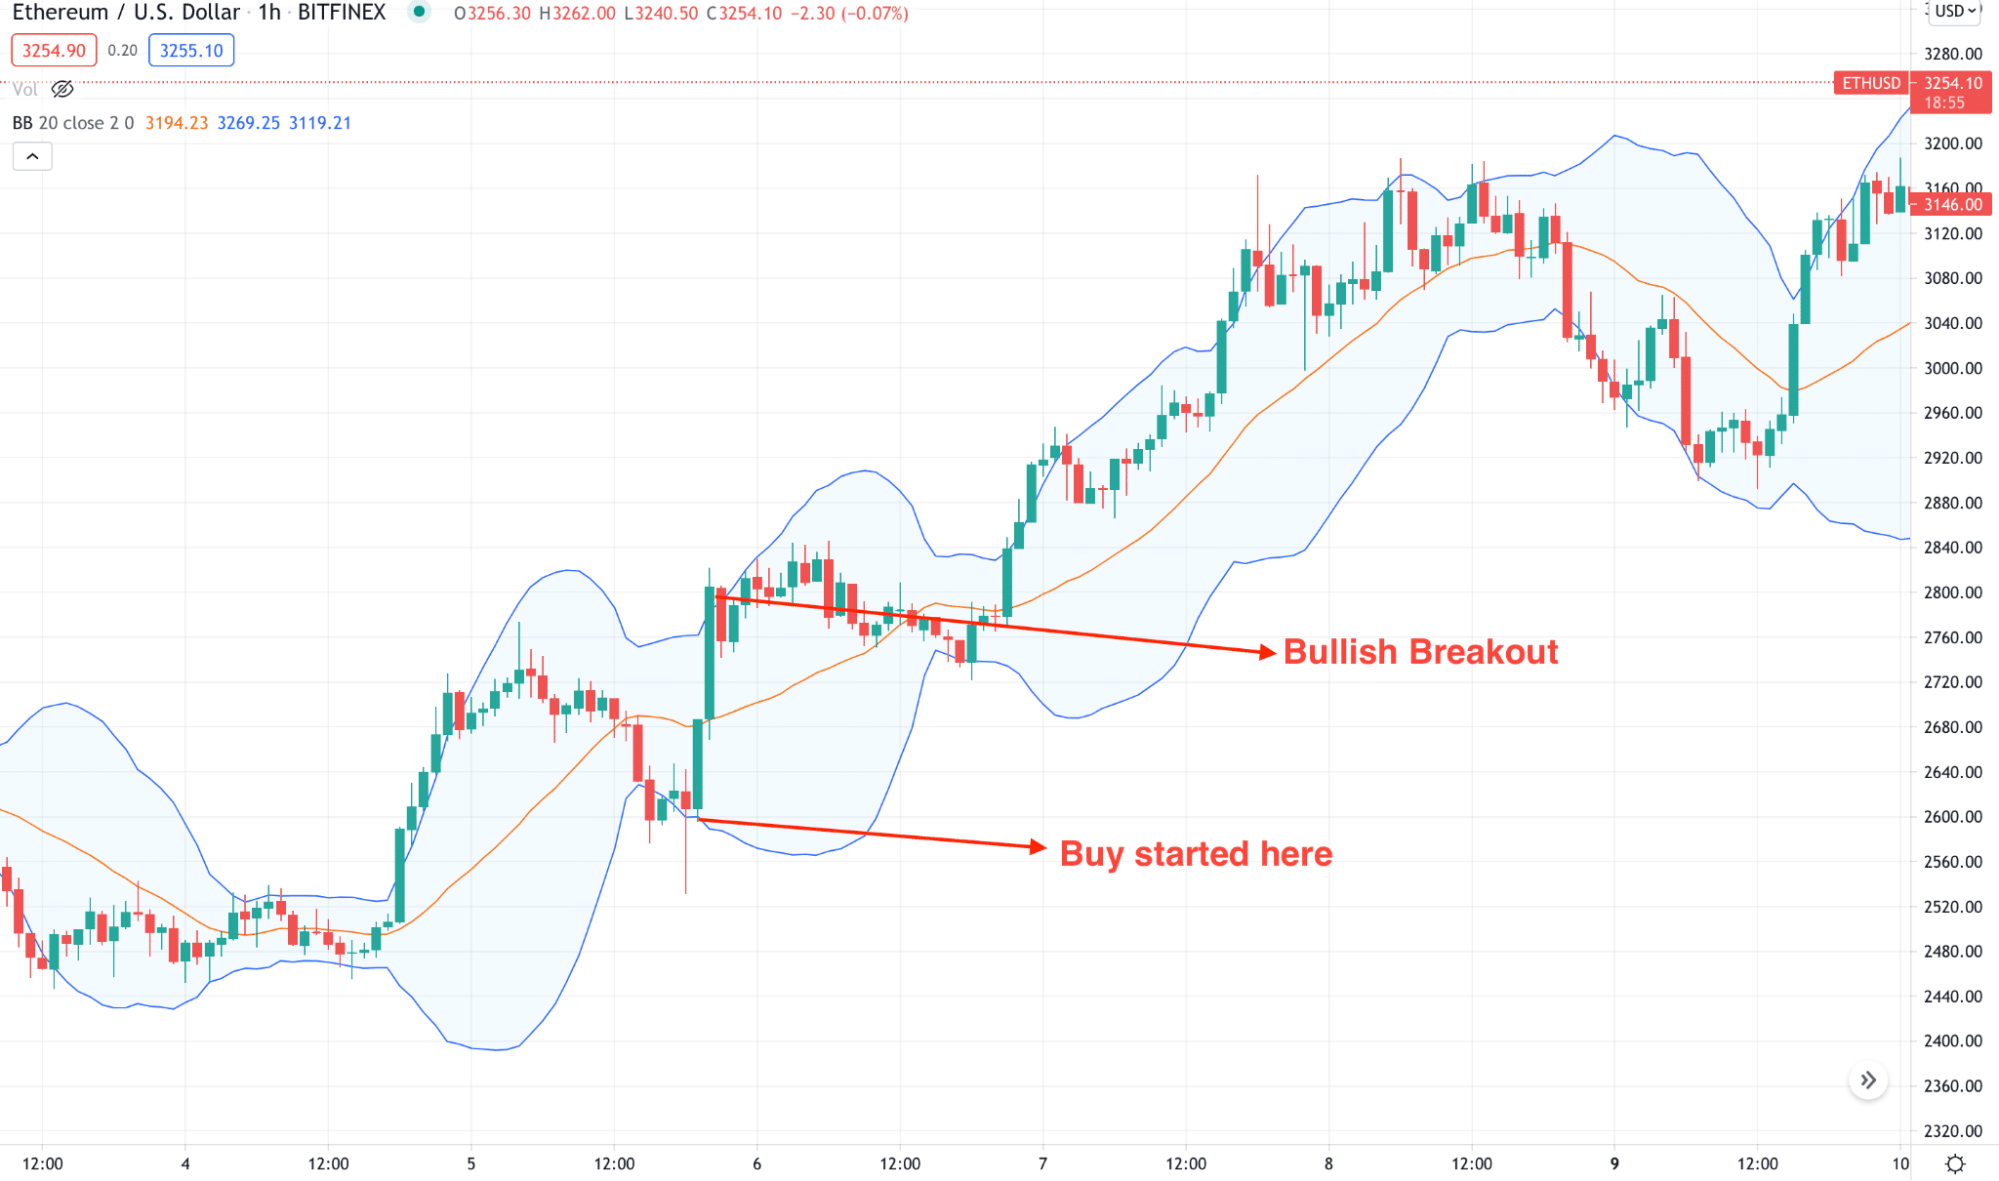
Now, look at the image below to see how we can find the breakout using BB.
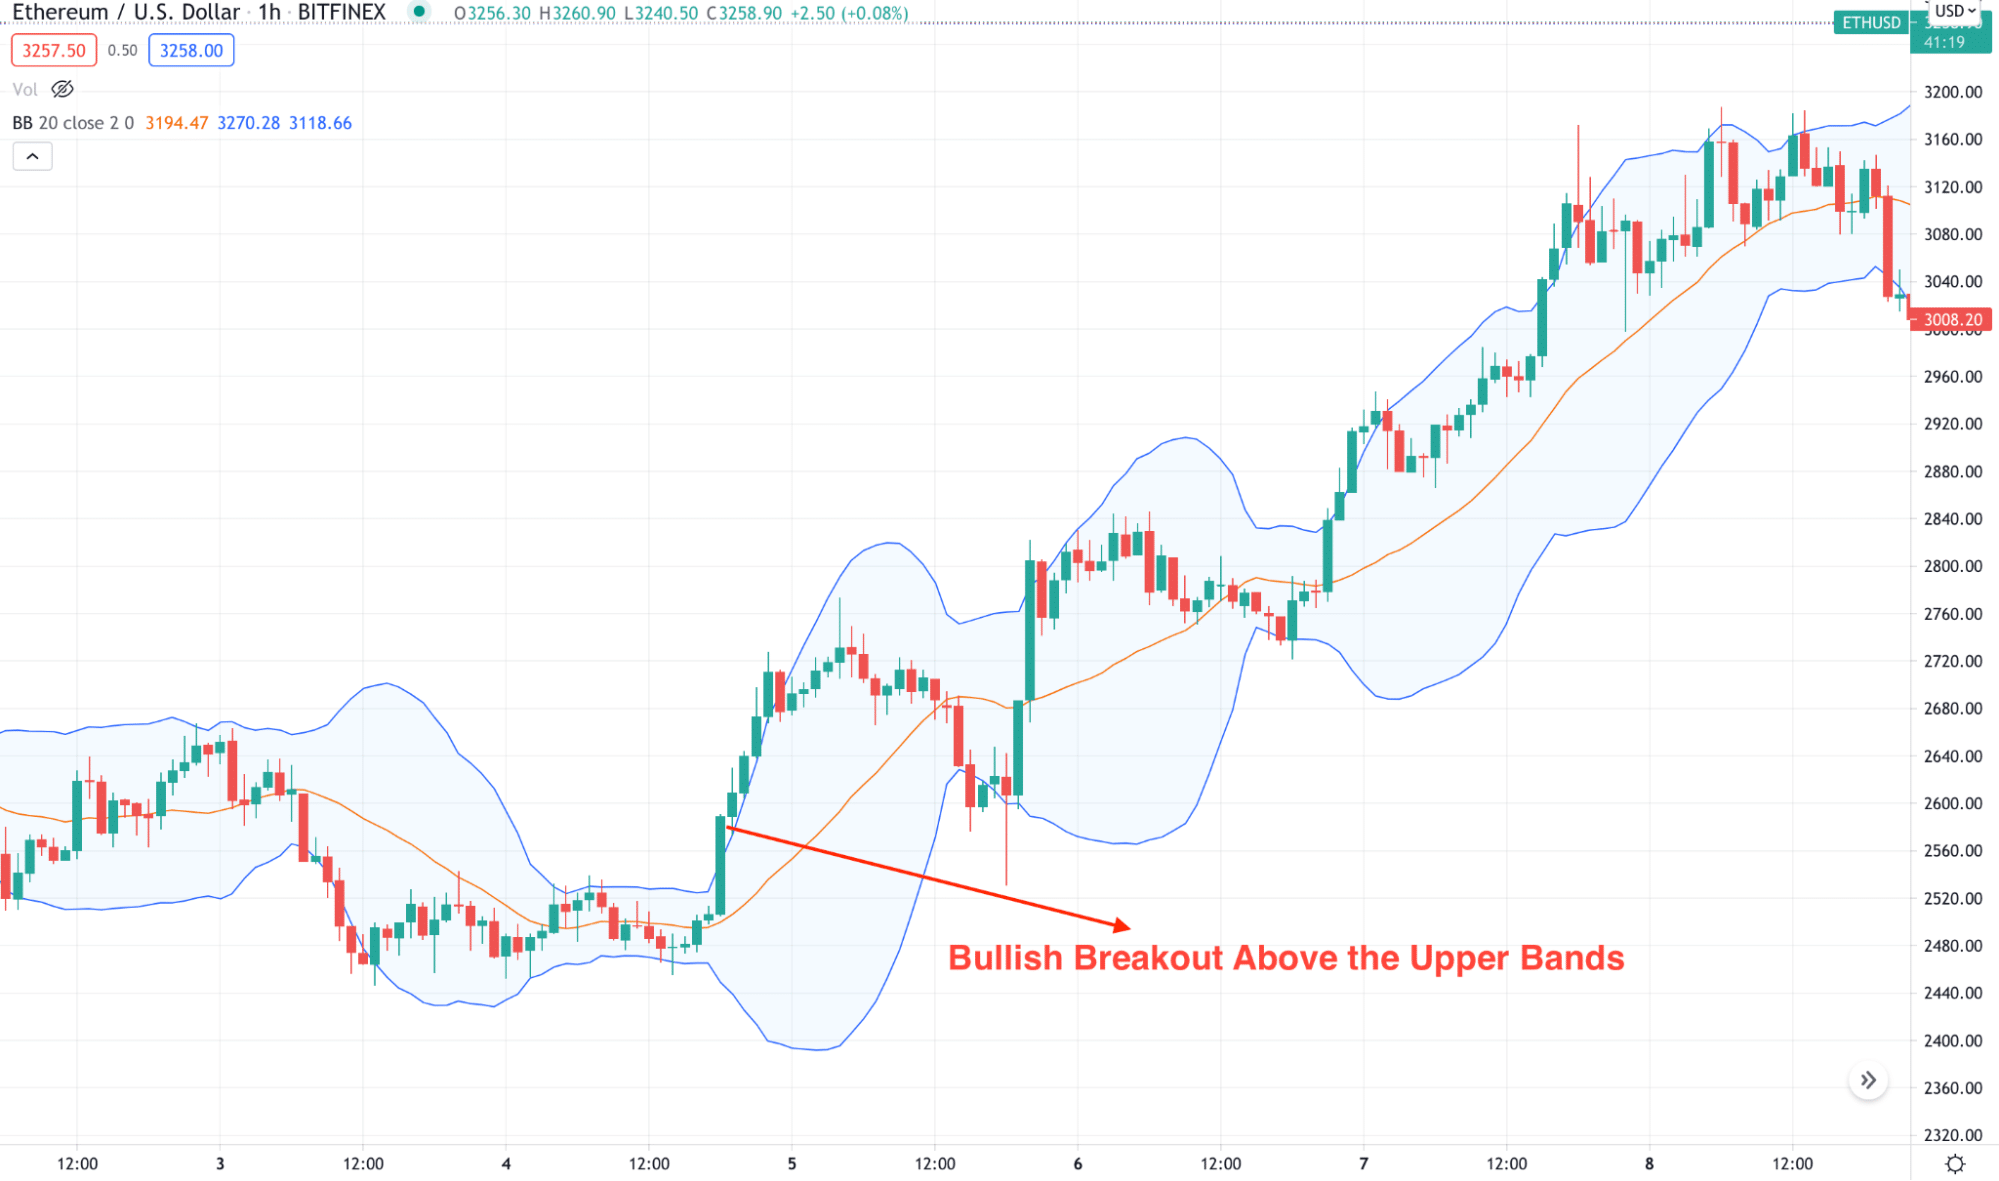
As per the above image, we can see that a candle closes above the upper dynamic level, indicating a bullish trend. Therefore, if you join the buying trend on the breakout candle, you would get a decent profit from the market.
Limitations of Bollinger Bands
Although BBs are a fantastic tool to identify market trends and consolidation periods, there is no way to say that it is a complete and perfect indicator.
Like other trading tools, BBs often provide false signals. For example, you may see the price breaking below or above the dynamic levels of this tool and reverse back immediately.
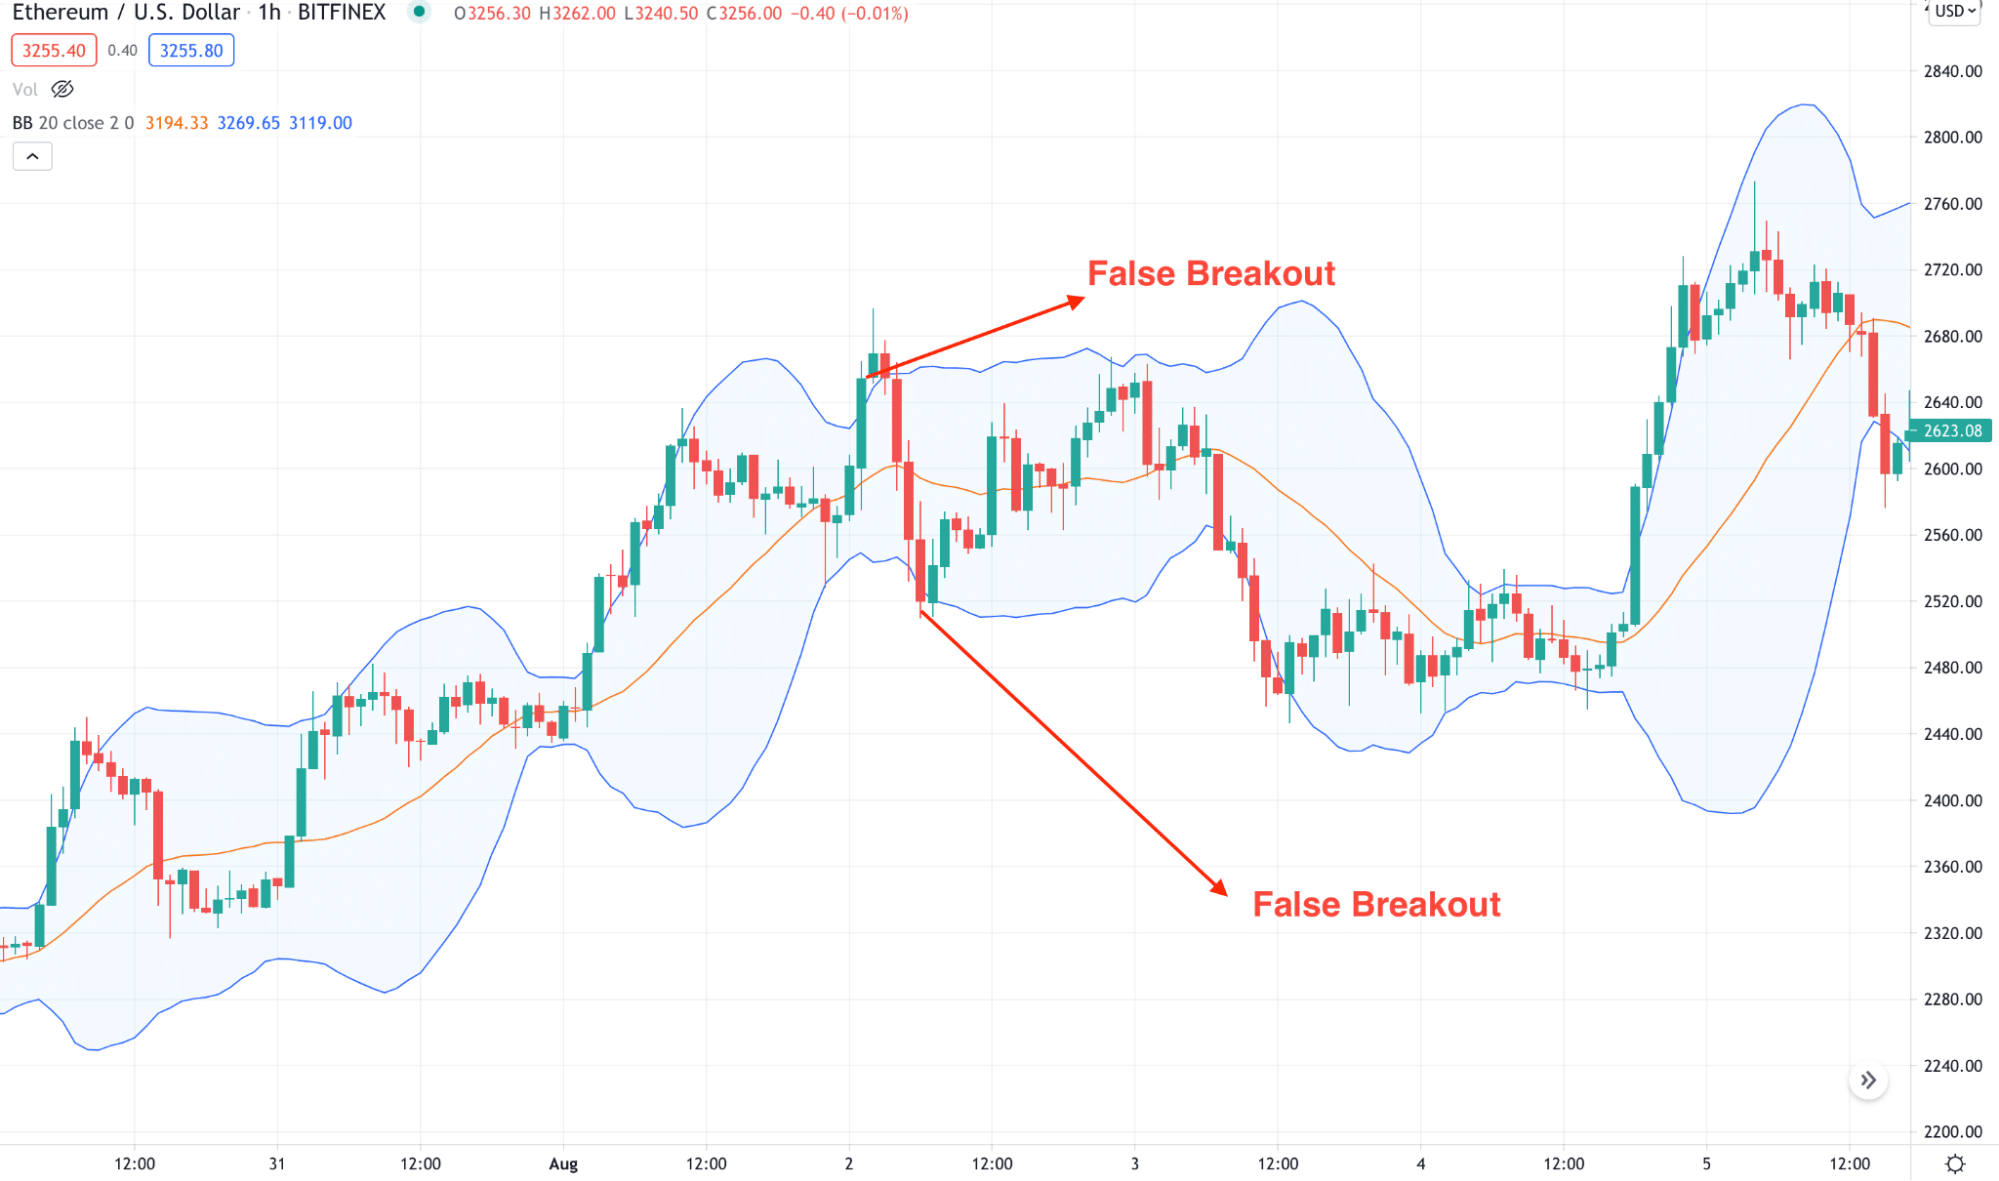
In the above image, we can see how the price pays with the market sentiment. On both sides, the price moved higher and below the Band’s low and reversed immediately.
Besides, it is a lagging indicator that shows the market movement after happening. Therefore, if you rely on this indicator blindly, it would cost you pips.
The above image shows how the price moved above the upper Bands and initiated a bull run that started from the rejection at lower Bands.
Another limitation is its setting that you can change anytime. However, traders often find it challenging to find the best indicator setting for them.
Final thoughts
In the final section, we will see the best approach to using BBs in financial trading. Until now, we came to know that this tool alone is incomplete, and it requires more confirmation in building a trading strategy. Nevertheless, many traders use this tool to identify the market direction and take trades based on other warranties.
On the other hand, trade management is another vital element of trading that you cannot ignore. Make sure to manage your risks as low as possible to get the maximum benefit from trading.