The FX PostThe FX Post
    What's Hot

    FlatQube Trade Volume, Trade Pairs & Trust Score

    November 7, 2022

    Step Guide to Winning Forex Trading

    September 19, 2022

    Relationship Between Currency Risk and Foreign Bonds

    September 2, 2022
    The FX Post The FX Post
    • Best Fx Robots
    • Forex
      • News
      • Forex 101
      • Forex Forecasts
      • Broker Reviews
    • Crypto
      • News
      • Crypto 101
      • Crypto Forecasts
      • Crypto Reviews
    • Indices
      • News
      • Analysis
      • Commodities
      • Reviews
    • Automated Trading
      • Forex Signals
      • Forex Robots
      • Copy Trading
    • Top
      • Best Forex Robots
    The FX PostThe FX Post
    Home ยป Dow Jones Forecast: Djia Sees Its Worst September in a Decade
    Analysis Indices

    Dow Jones Forecast: Djia Sees Its Worst September in a Decade

    October 1, 20213 Mins Read
    Facebook Twitter Pinterest LinkedIn Reddit
    The statue of bull
    Share
    Facebook Twitter LinkedIn Pinterest Reddit

    On Friday, September 30, DJIA dropped to its lowest since 2011 due to concerns about rising bond yields, inflation fears, and rising interest rates. 

    • In September, the Dow suffered a 4.3% decline and was the worst performer of the three major indexes. 
    • News on rising interest rates and inflation hikes caused concerns for investors. 
    • The political climate also added uncertainty. 

    DJIA fundamental forecast

    The Dow Jones Industrial Average plummeted 546.80 points, or 1.59 %, to 33,843.92 on Thursday, September 30. 

    Markets are invaded by algorithms
    Secure your passive income with algo-based trading systems
    Learn more

    Weaker broader market

    The stock market experienced an unfavorable September, as many had predicted. Unfortunately, there isn’t a single person or thing to blame. 

    On Thursday, the Dow Jones Industrial Average lost 546.80 points, or 1.6 percent, while the S&P 500 sank 1.2 percent. After being in the green earlier in the day, the Nasdaq Composite fell 0.4 percent. Both the S&P 500 and the Dow Jones Industrial Average had their worst September since 2011.

    The market’s weakness occurred on the last day of a difficult month for stocks, which has been roiled by increasing rates, inflation fears, and concerns over the Chinese housing market.

    The Dow fell 4.3% for the month and was the third quarter’s poorest performance of the three main US indices. The index fell over 2% in the third quarter, marking the biggest quarterly point and percentage drop since the first quarter of 2020.

    Government shutdown

    President Joe Biden signed a short-term funding deal late Thursday, preventing a partial government shutdown by only a few hours. The Senate and House of Representatives agreed to finance the government until December 3.

    To prevent a federal default, Congress must approve a debt ceiling increase, with Republicans insisting that Democrats pass it on their own.

    Infrastructure bill 

    The $1 trillion infrastructure bill, which has bipartisan support, is in jeopardy. The vote was put off late Thursday evening after House Speaker Nancy Pelosi publicly indicated that it would happen that day. On Friday, the House may try again.

    The infrastructure package had been promised to be opposed by many leftists. Instead, they want to see considerable progress, if not outright passage, on another divisive tax-and-spend measure first.

    If the vote had gone forward, a high-profile defeat looked probable, with Democrats just having a three-seat majority in the House and only a handful of Republicans expected to support the infrastructure measure.

    What’s next? 

    There is little or no motivation for investors to increase their exposure. Good things don’t happen when the stock market is trading below the 21-day and 50-day moving averages. Moreover, the overall trend is still negative. Could the market surge roar back to new highs from here, with Thursday’s low being the bottom? Yes, but we might also be on the verge of a market downturn.

    DJIA technical analysis: key levels in action  

    DJIA is below the 50-day moving average on the daily chart, and the MACD is downward. 

    DJIA reached its recent high in August when it crossed the 35631-mark. At the time of writing, the DJIA is trading at 33843.93. 

    Dow Jones Industrial Average Index chart
    Dow Jones Industrial Average Index chart

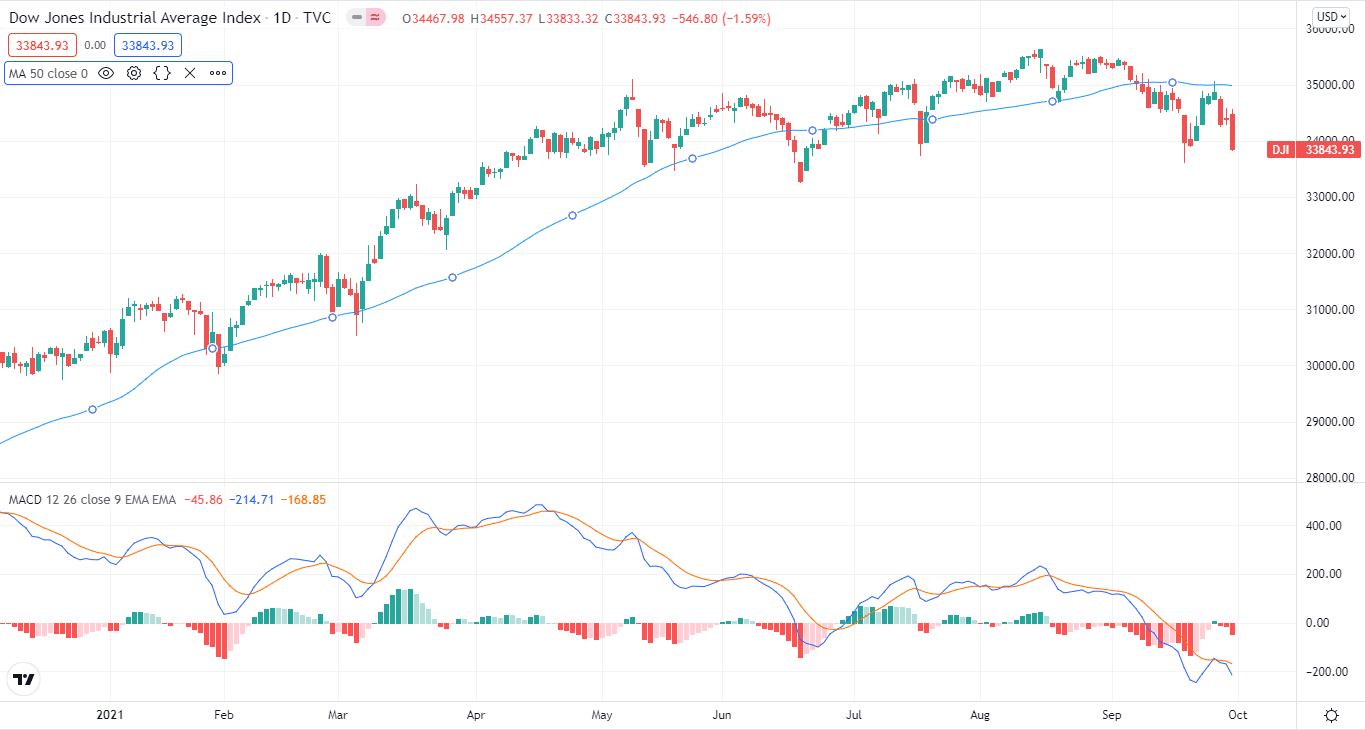
    All the signals for the index suggest a red zone in the upcoming days. The 10, 20, 50, and 100-day moving averages are all in the sell zone. Only the 200-day MA is in the buy zone. However, considering September, it is unlikely that the index will return to the green zone. 

    Markets are invaded by algorithms
    Secure your passive income with algo-based trading systems
    Learn more
    Dow Jones Index US Economy
    Share. Facebook Twitter Pinterest LinkedIn Reddit

    Related Posts

    European Central Bank

    Christine Lagarde Solidifies ECB’s Message on Combating Inflation

    June 28, 2022
    Salesforce-backed front

    Salesforce-Backed Front Valued at $1.7 Billion in Financing Round

    June 28, 2022
    G7 countries to hit Russia

    G7 Countries to Hit Russia With Brand-New Assents

    June 27, 2022
    China's clean power growth

    China’s Clean Power Growth Outlook for 2022 Maintains Getting Bigger

    June 24, 2022
    Add A Comment

    Leave A Reply Cancel Reply

    23  −  20  =  

    Best FX Post
    Best Forex Robots (Expert Advisors) 2021

    Best Forex Robots (Expert Advisors) 2022: Passive Income From Algo Trading Systems

    July 7, 2021

    Top 10 Lending Platforms for Crypto Loans

    June 1, 2022
    forex eurusd trading charts

    Top 10 Best Forex Brokers In All Times

    June 1, 2022
    Recent Posts
    • FlatQube Trade Volume, Trade Pairs & Trust Score
    • Step Guide to Winning Forex Trading
    • Relationship Between Currency Risk and Foreign Bonds
    • Best Social & Copy Trading Platforms
    • Bitcoin Dips Listed Below $20,000 With Fundstrat Considering ‘Last Washout’
    Featured Reviews
    TechBerry

    TechBerry Review: Pros, Cons, Recommendations

    September 18, 2021
    CryptoHero

    CryptoHero Review: Pros, Cons, Recommendations

    June 3, 2022
    Bitsgap

    Bitsgap Review: Pros, Cons, Recommendations

    April 29, 2022
    Categories
    • Analysis
    • Automated Trading
    • Best FX Post
    • Broker Reviews
    • Commodities
    • Copy Trading
    • Crypto
    • Crypto 101
    • Crypto Bots
    • Crypto Forecasts
    • Crypto Reviews
    • Forex
    • Forex 101
    • Forex Forecasts
    • Forex Robots
    • Forex Signals
    • Guides
    • Indices
    • News
    • News
    • News
    • Reviews
    • Reviews
    • Uncategorized
    Twitter BlogLovin
    © 2023, Thefxpost.com.
    • Contact

    Type above and press Enter to search. Press Esc to cancel.