
EUR/USD is the most traded currency globally that has a decent possibility of providing a solid return in Q4. If you can identify the price direction with an appropriate strategy, you can significantly return this pair.
After the Covid-19 pandemic, the global economy has seen a dramatic change. The lockdown, shutdown, and central banks easing positions have created a good opportunity for financial traders.
The following section can deeply analyze the EUR/USD Q4 of 2021 movement with an appropriate buying and selling idea.
EUR/USD post-pandemic movement
After the Covid-19 pandemic, central banks became cautious about the rising inflation while the temporary ultra-loose monetary policy kept the price prediction difficult. However, for the US economy, inflation remained stable while employment was picking up. Therefore, the Fed might remain optimistic against the mute European Central Bank.
After mentioning the persistently accommodative economic policy in the post-pandemic scenario, the European Central banks remained silenced for weeks. In August, the German ZEW economic sentiment remained below the satisfactory 50 levels while the CPI was confirmed at 3.8% year-over-year.
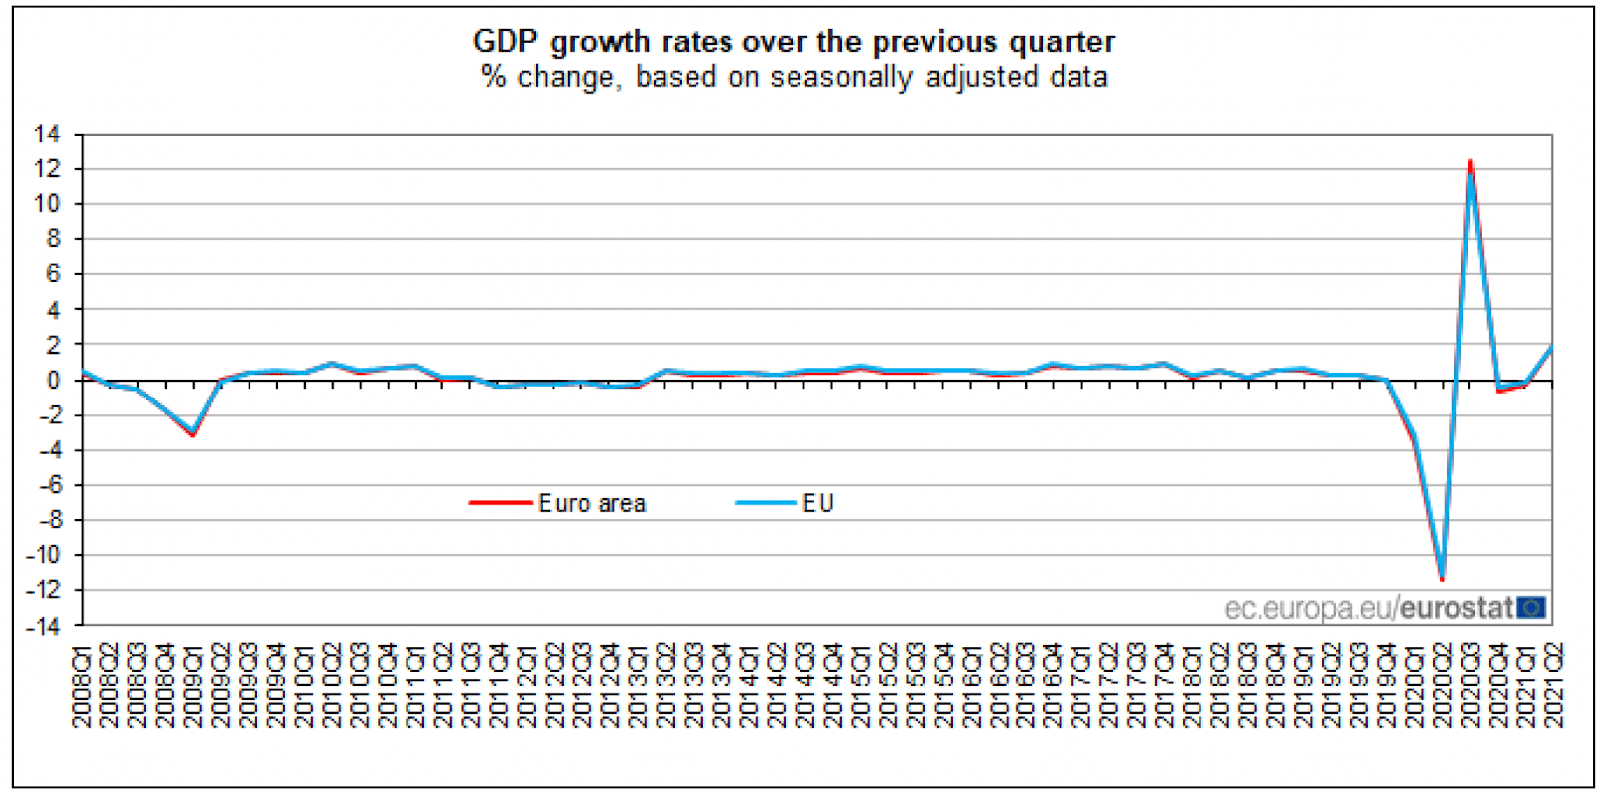
Investors have seen the Q2 GDP come with a 2% growth, while investors have some faith. Therefore, besides the data, any support from the European Central Bank may increase buyers’ presence in the EUR/USD.
On the other hand, the European counterpart, the US, is playing well that started with an optimistic view over the economy. Currently, the Fed sees multiple rate hikes later in 2021, but the main concern is the possible increase in inflation.
In the latest findings, the quarterly CPI inflation was in line except for the core inflation. Meanwhile, the GDP in Q1 and Q2 was above or in line with the expectation. These developments show that the USD is already priced and may lose some momentum during the yearly decrease.
EUR/USD weekly time frame
This section will see a technical analysis on EUR/USD Q4 that might help anticipate the price movement and take trading decisions.
EUR/USD started 2021 with a bullish momentum but failed to break December 2020 high and formed a double top pattern on the weekly chart. However, the multiple indecision candle on the yearly high is a sign of a bearish pressure for the coming weeks. Therefore, the price moved down and reached the March low. Moreover, the price moved below the Ichimoku Kumo cloud and Kijun Sen line that created an opportunity for additional bearish pressure.
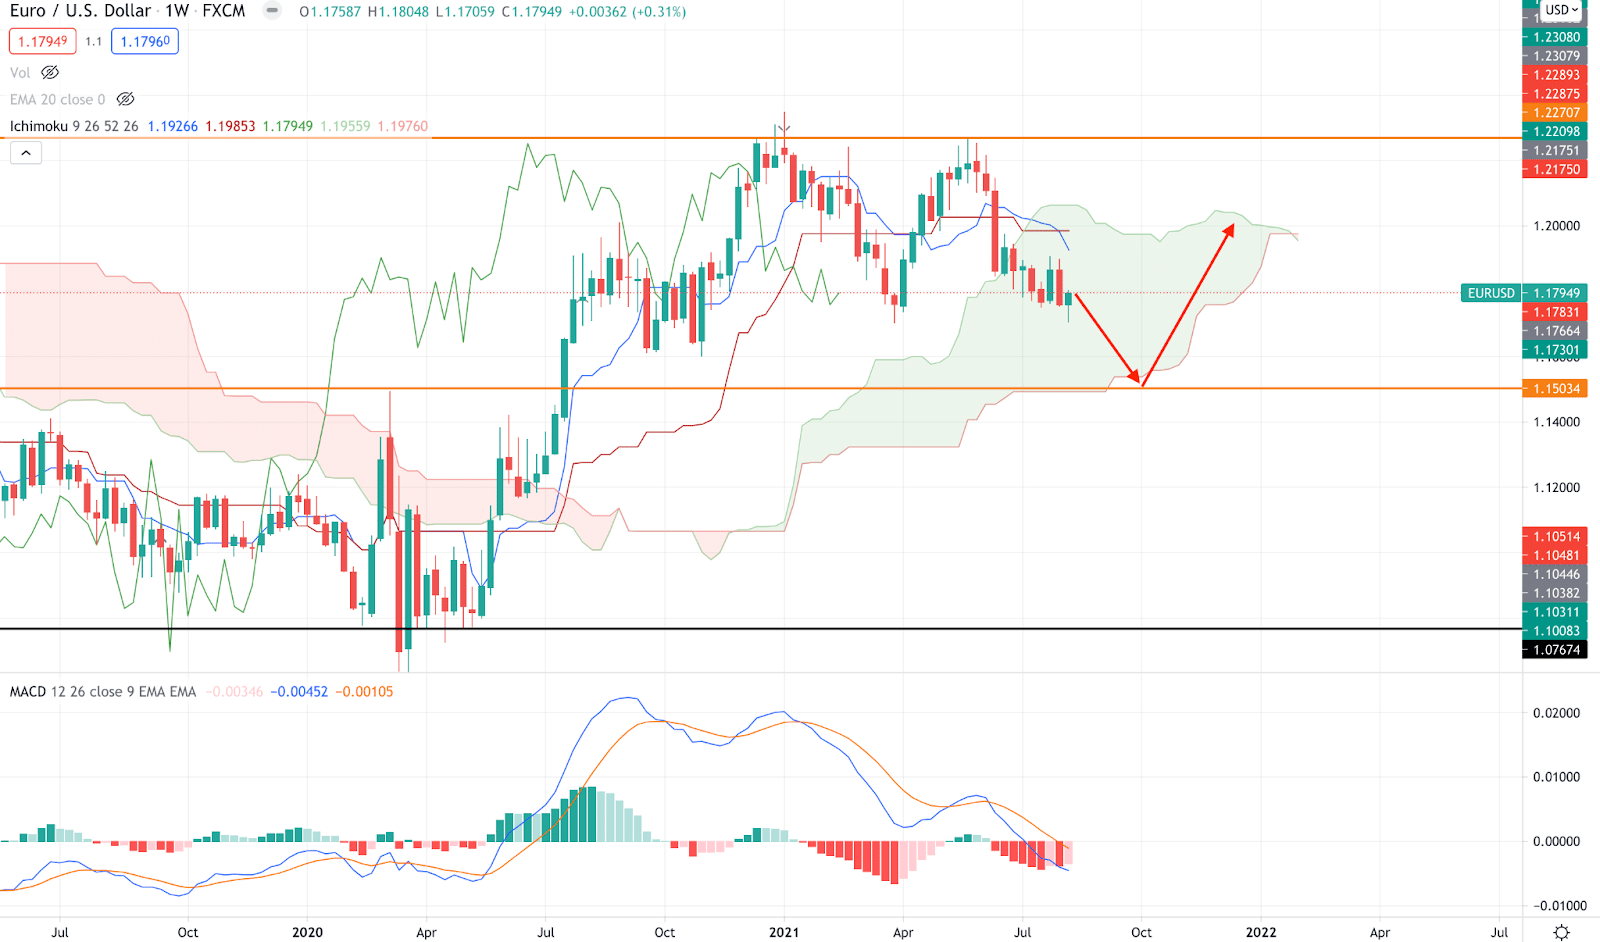
In the above image, we can see that the price is trading below the Tenkan Sen and Kijun Sen while the bearish crossover between these two lines is in play. Therefore, as long as the price is trading within the Kumo Cloud, it is more likely to test the bottom of the 1.500 level in Q4 2021.
Moreover, in the indicator window, the MACD histogram is still bearish but making higher lows. In that case, any upside movement with a weekly close above the Cloud resistance may resume the current bull run above 2021 high.
EUR/USD daily time frame
In the daily chart, EUR/USD is quite volatile and corrective since the beginning of 2021. Like the weekly time frame, buyers failed to hold the price above 1.22 level, and sellers became active to take the price lower below the Kumo Cloud.
Later on, the price corrected below the cloud resistance and formed resistance at the 1.1900 level. Therefore, as long as the price is trading below the 1.1900 level, we came to consider that the bearish pressure may expand in Q4.
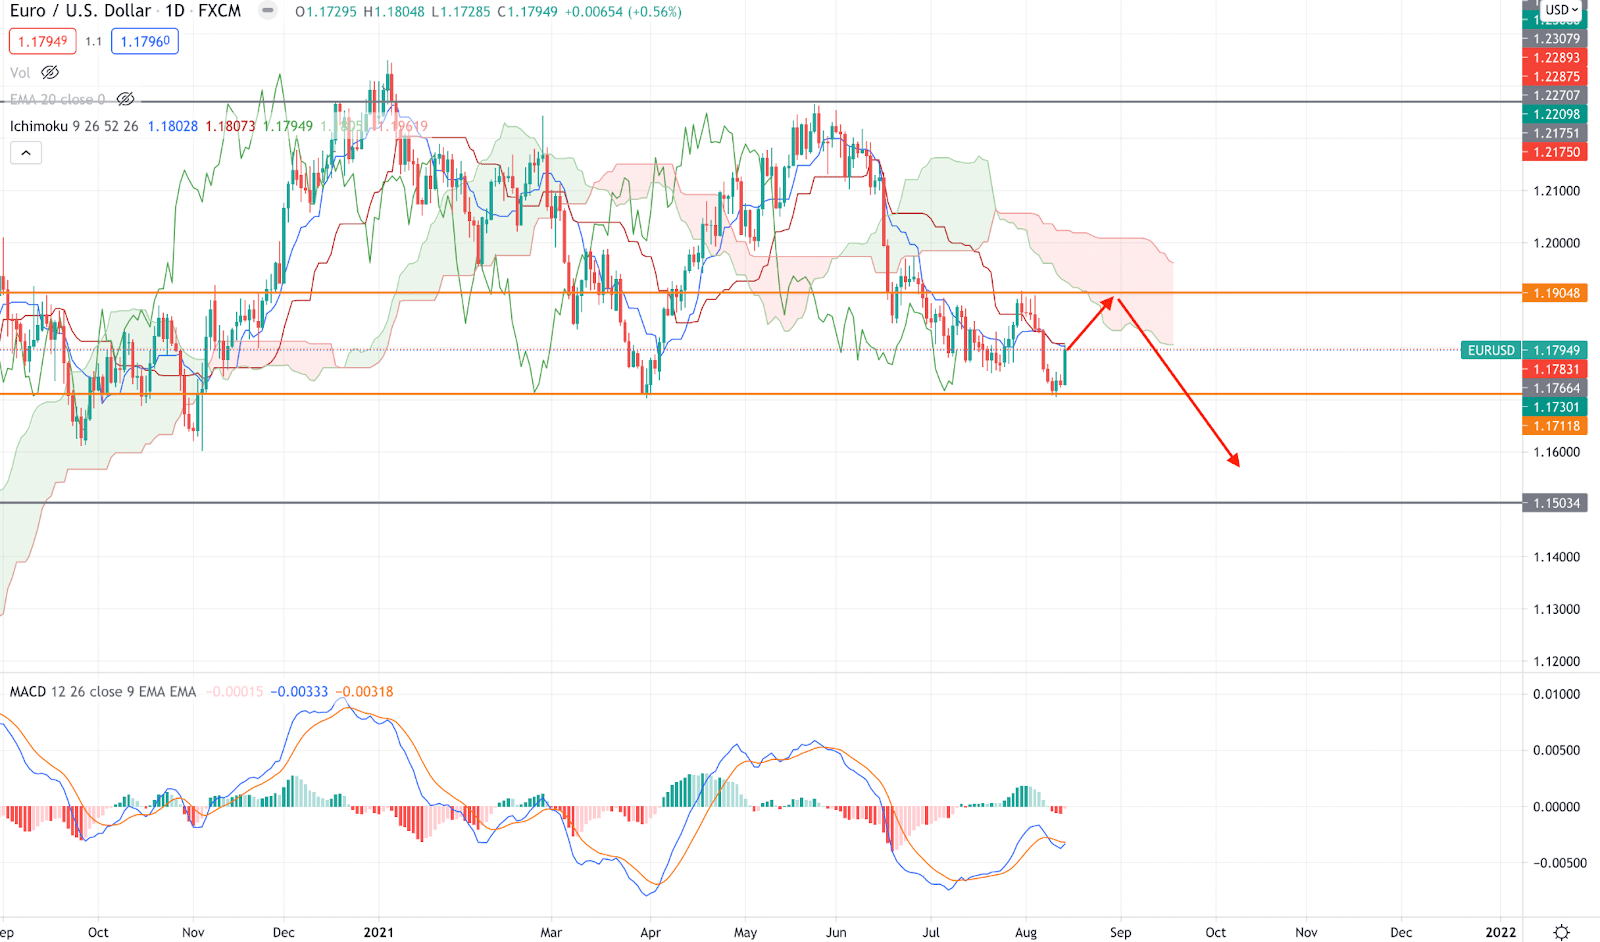
The above image shows the daily chart of EUR/USD where the price is trading below the static resistance of 1.1900 and cloud resistance. Moreover, in the future cloud, the Senkou Span A, which measures the average price of Tenkan and Kijun Line, is below the Senkou Span B. According to the Ichimoku Theory, Senkou Span A works as an essential trend director, and its movement with the price signifies the strength of the current bearish trend.
However, the price made a bottom at the 1.1710 level on the daily chart, which may push some upside pressure before the Q4 begins. Overall, the thickness of the future cloud, bearish MACD histogram, and near-term static and cloud resistance are signs that the price has a higher possibility of expanding lower in Q4.
Is EUR/USD a sell?
As per the above findings, the overall outlook for the EUR/USD may remain bearish. However, investors should closely monitor how the price is heading, and economic conditions appear, especially the September FOMC. Right now, the USD bulls are aggressive and require some correction.
EUR/USD idea for buying in Q4
Considering the current bearish pressure, there are two crucial support levels from where the rebound may happen. Therefore, the primary buying point would be 1.1710, which may take the price towards 1.21 and even 1.22. Moreover, another buying opportunity is available at 1.500 key support levels.
However, while making the real-time market scenario important, traders should find appropriate price action on these levels before making any trading decision.
EUR/USD idea for selling in Q4
Since the beginning of the 2nd half of 2021, EUR/USD started to grow higher, and any sign of a breakout above the Cloud resistance and psychological 1.200 level may attract sellers in the market. In that case, any appropriate rejection and price formation from the 1.220 critical level may initiate a bearish pressure on the price.
Final thoughts
Trading in the financial market involves a lot of risk and uncertainty. However, some risks are unavoidable, so you should only invest the money you are ready to lose. You can minimize the risk by applying an appropriate risk management system associated with your trading strategy.
Overall, understanding the market structure, critical level, and near-term price behavior makes money from the EUR/USD pair very easy and effective.