
EMA is a technical trading tool that traders from all financial markets use to define the price direction of a trading instrument. However, the excessive volatility and random price change often make crypto trading hard. Therefore, many traders believe that the traditional indicator might not work in crypto, which is not true.
If you are a cryptocurrency trader or are willing to make a crypto trading portfolio, the following section is for you. Today’s lesson will show the nuts and bolts of exponential moving averages in the crypto context.
What is EMA?
EMA is a bit different from the traditional SMA. Although this indicator itself is not enough to define a reliable price direction, the combination of EMA with other tools might make your trading journey fruitful.
Before processing further, let’s see the formula of EMA.
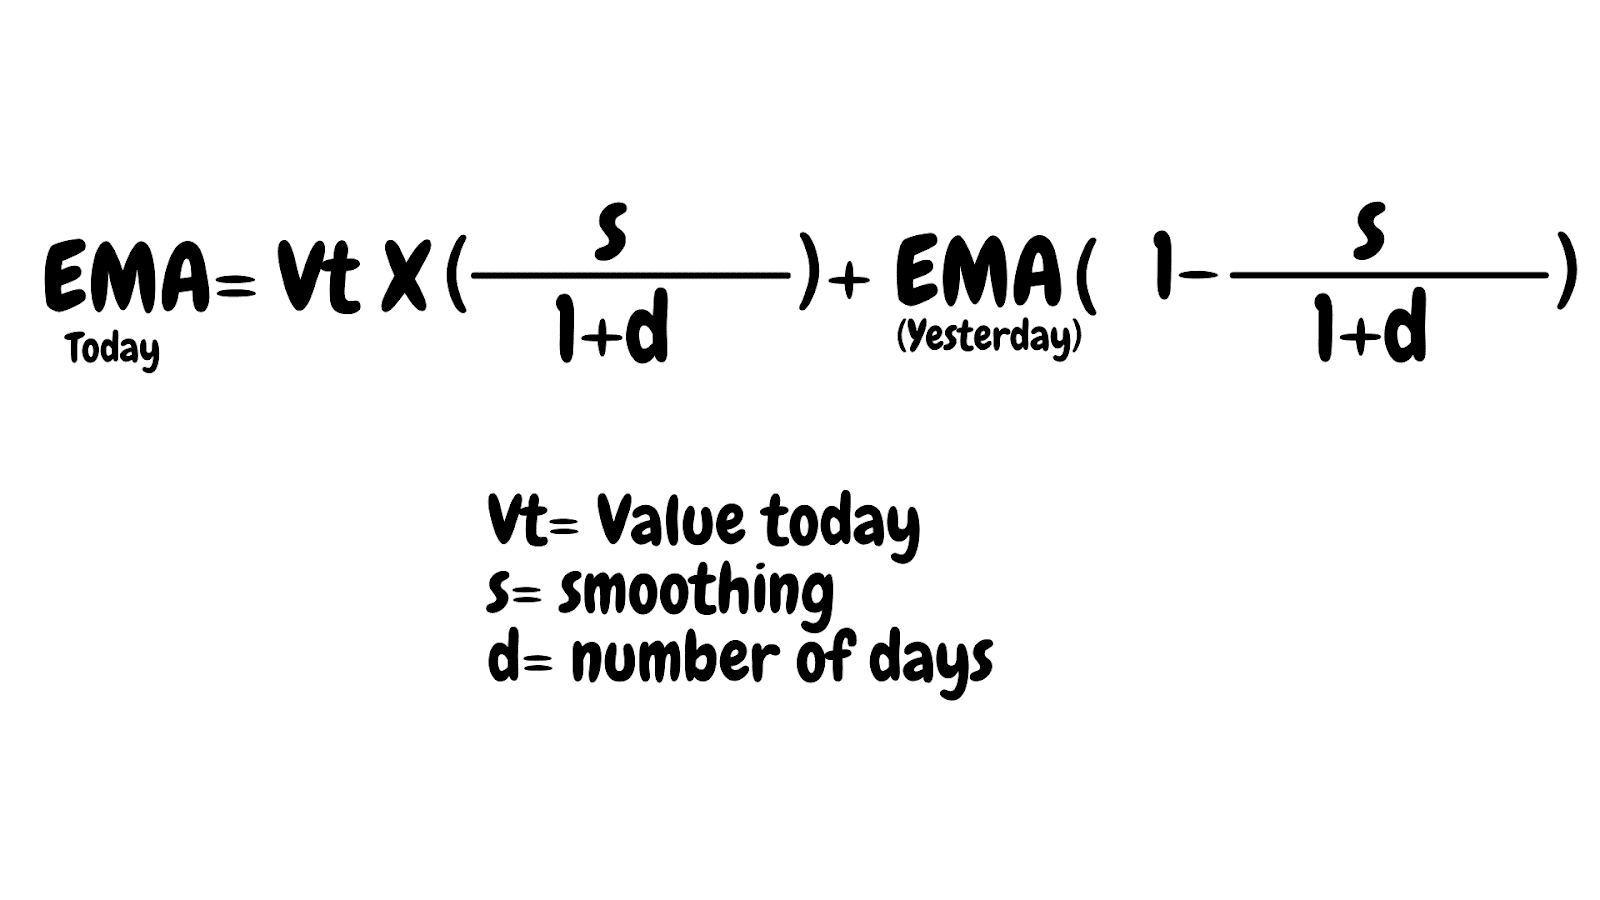
As per the above calculation, we can say that the EMA uses the previous day’s value to calculate today’s result, which is unique to the traditional SMA. EMA focuses on the most recent prices while the SMA sticks to the average. In that case, EMA provides a better result than SMA in the lower MA value and intraday trading. Therefore, the best approach is to use EMA to find the trading entry.
How to trade using EMA in trading strategy?
In EMA trading, the best output comes from using multiple indicators like SMA and EMA or EMA and MACD. There are many trading strategies based on EMA, but it is better to stick to higher time frames only for cryptocurrency trading.
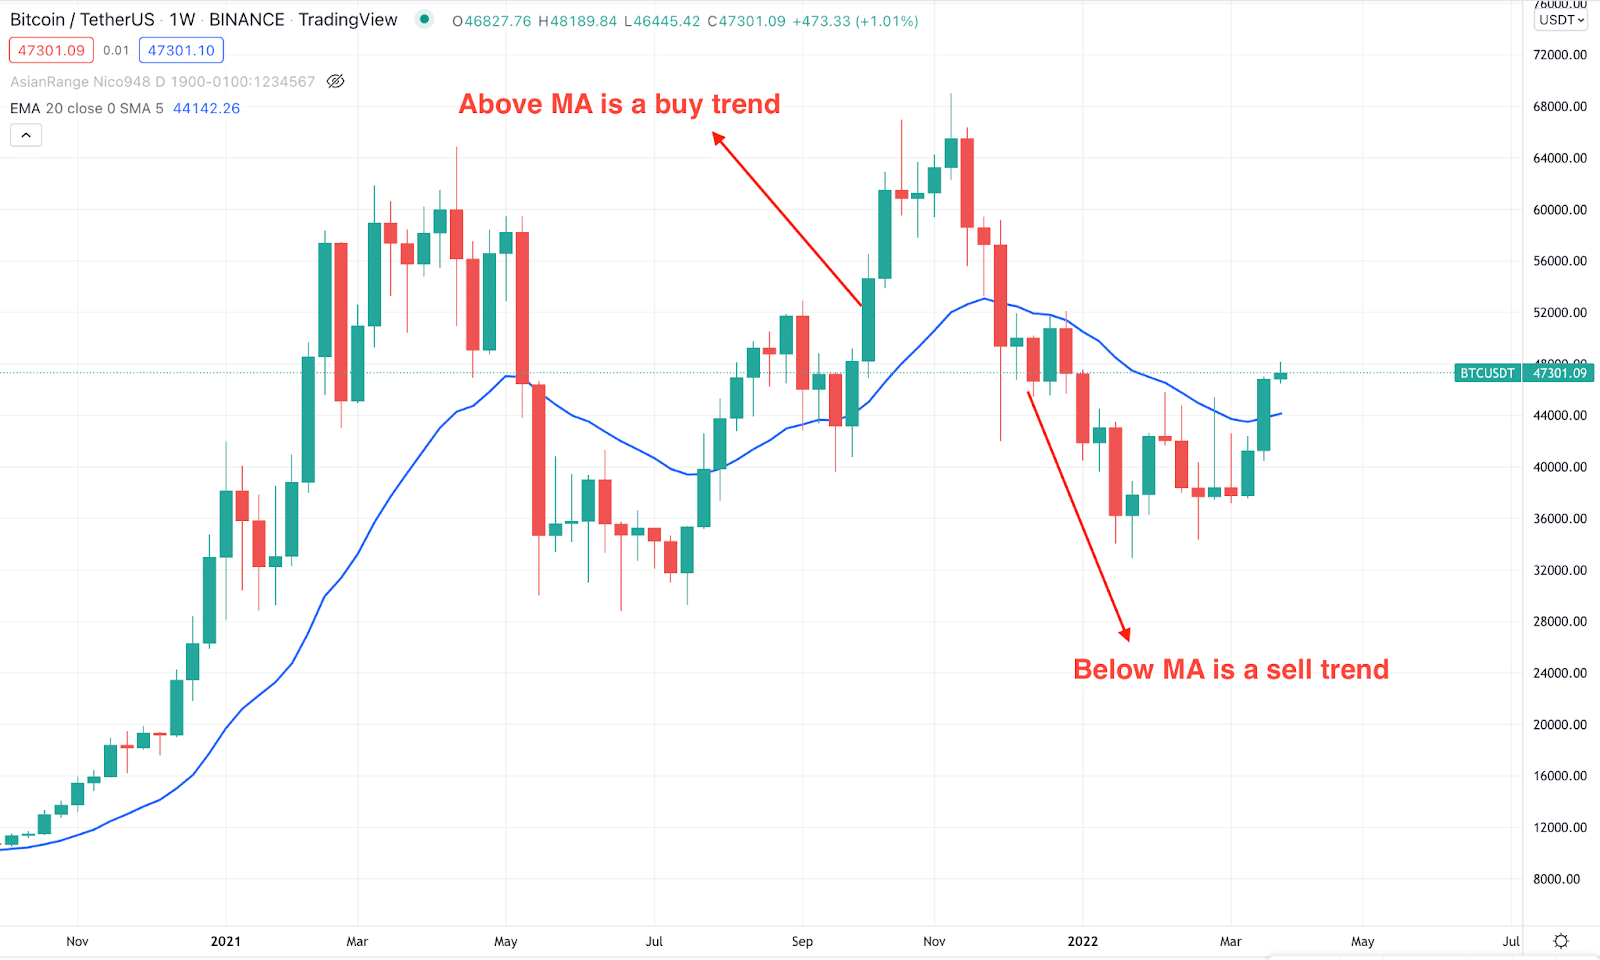
The basic idea of moving average is to find where the average traders are heading. If the current price is above the MA, we can say that the price trend is bullish. In that case, finding buying trades will be wise. On the other hand, if the price remains stable below the MA, the sentiment should be bearish, and for this, it is wise to focus on sell trades.
A short-term trading strategy
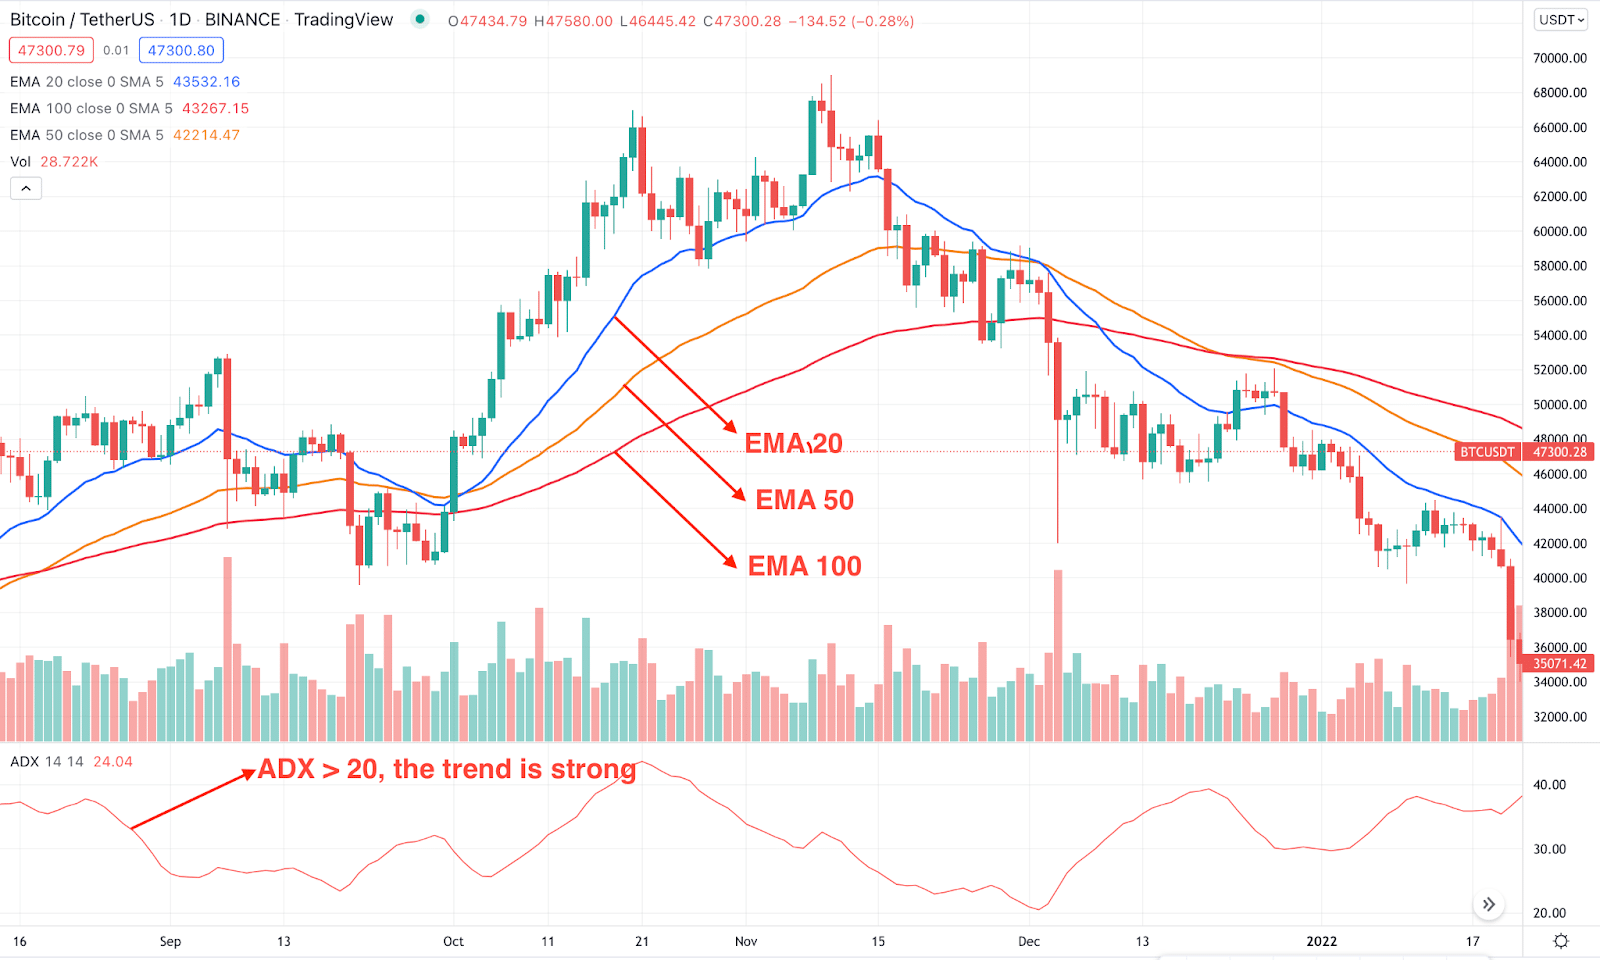
We will use multiple EMA levels in the short-term method to find the price trend. Let’s see the list of indicators with settings:
- EMA 100 to find the long-term price trend.
- EMA 50 to find the medium-term price trend
- EMA 20 near-term dynamic support/resistance.
- ADX to find the strength of the trend.
Bullish trade scenario
We will see the intraday approach to buying crypto in the bullish trade in the H1 chart. Although this method applies to any time frame, we will stick to H1 to avoid intraday price volatility.
Entry
Find these conditions in the price chart before opening a buy entry:
- The long-term outlook of the price is bullish. The price is trading above any important support level and moving up.
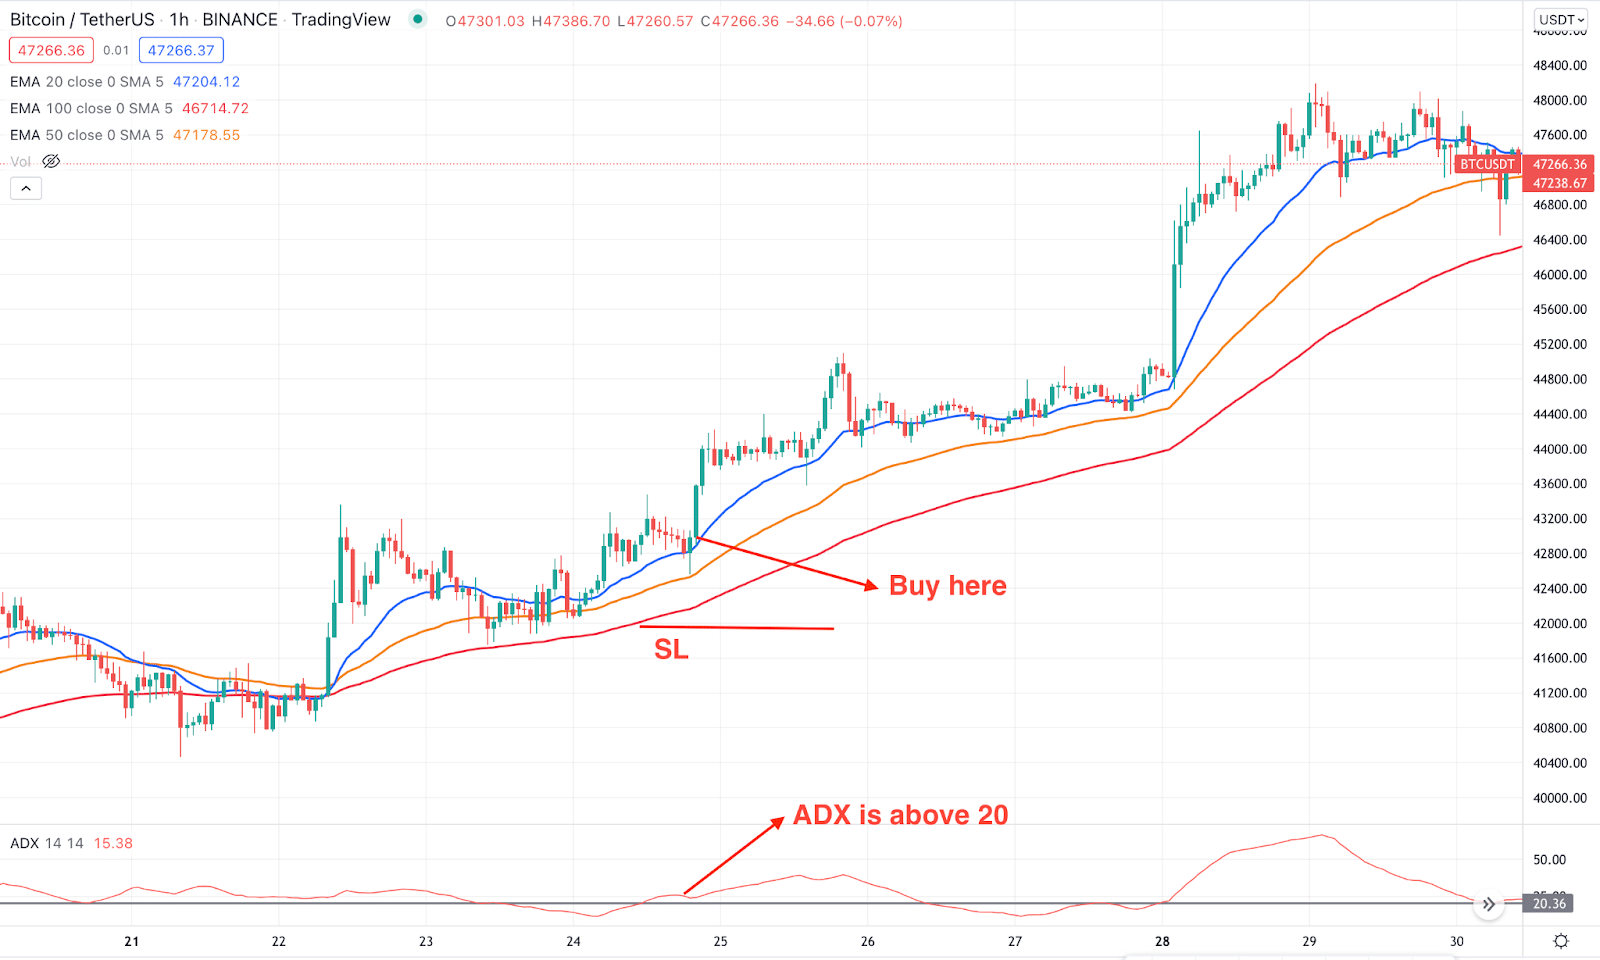
- In the H1 chart, the 50 EMA is above the 100 EMA.
- The price moved above 50 and 100 EMA and made a new swing high.
- Later on, the price corrected lower but failed to hold the bearish momentum. It shows a bullish rejection from the dynamic 20 EMA, which is the buying point.
- ADX is above 20 level.
Trade management guide
- The aggressive SL is below the entry candle and the conservative approach is to set it below the 50 EMA.
- The first target level is based on 1:2 R: R and the second target depends on price pressure.
Short-term buy method
Bearish trade scenario
The bearish trade is also applicable in the H1 time frame, and this method perfectly works for cryptocurrency CFDs trading.
Entry
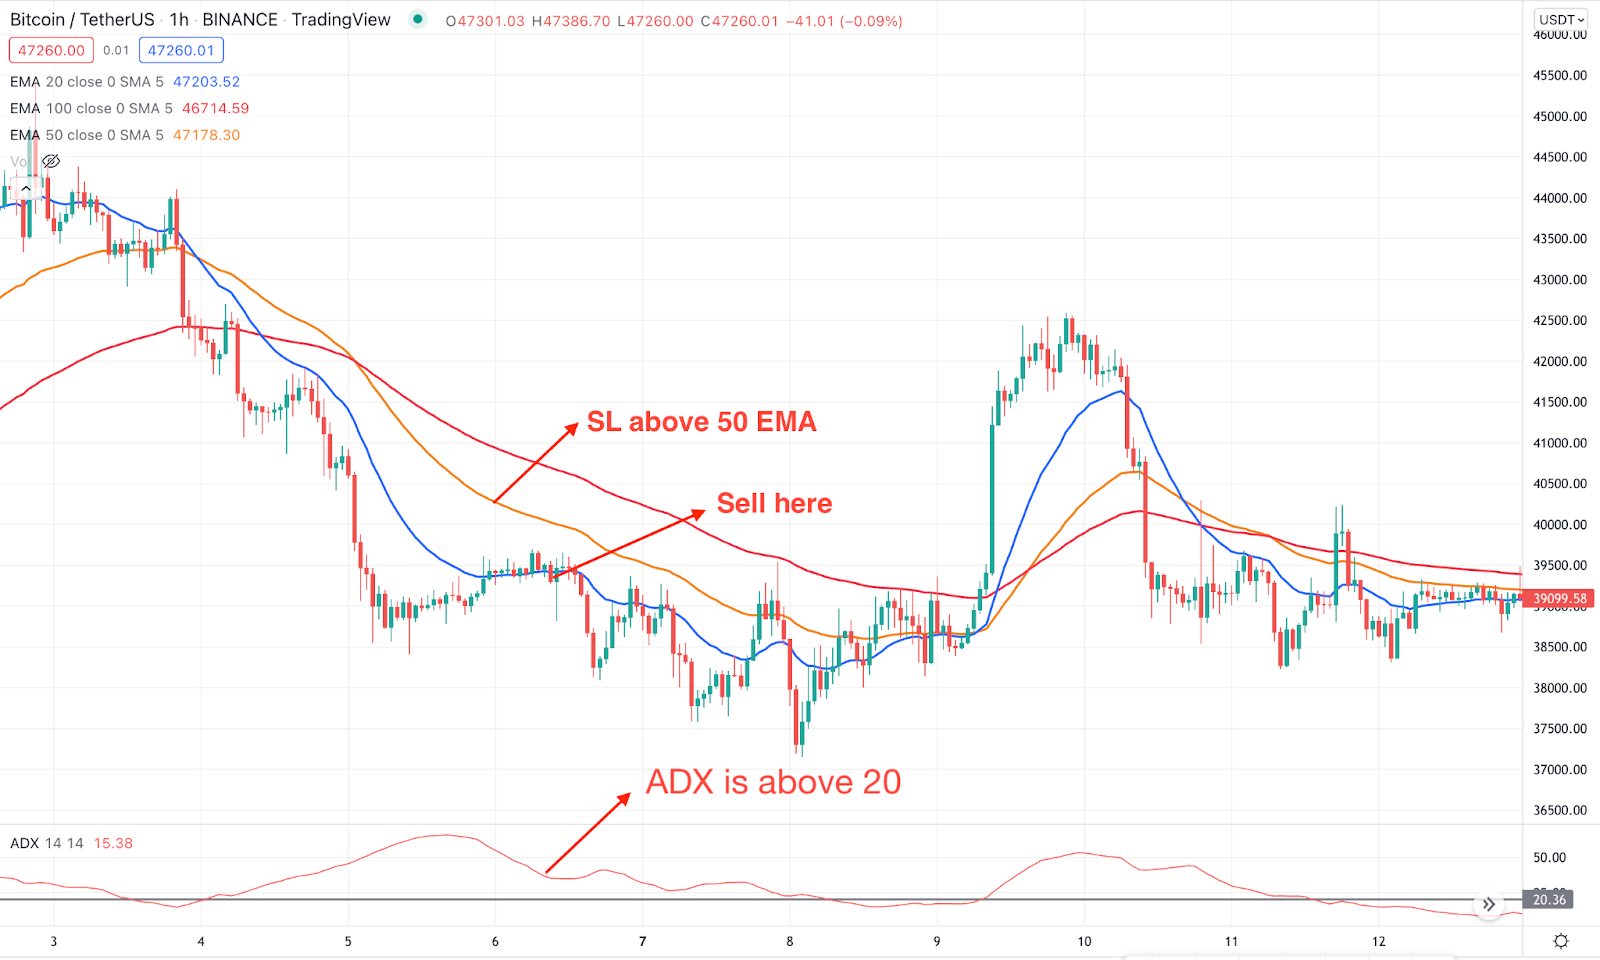
Find these conditions in the price chart before opening a sell entry:
- In the higher time frame, the price shows a bearish rejection from any important resistance level and moves down.
- In the H1 chart, the 50 EMA is below the 100 EMA.
- The price moved below 50 and 100 EMA and made a new lower low.
- From the low, the price moved higher and formed a bearish rejection from the dynamic 20 EMA resistance.
- ADX is above the 20 level, indicating that the trend is strong.
Trade management guide
- The aggressive SL is above the entry candle, and the conservative approach is to set it above the 50 EMA.
- The first target level is based on 1:2 R: R, and the second target depends on price pressure.
A long-term trading strategy
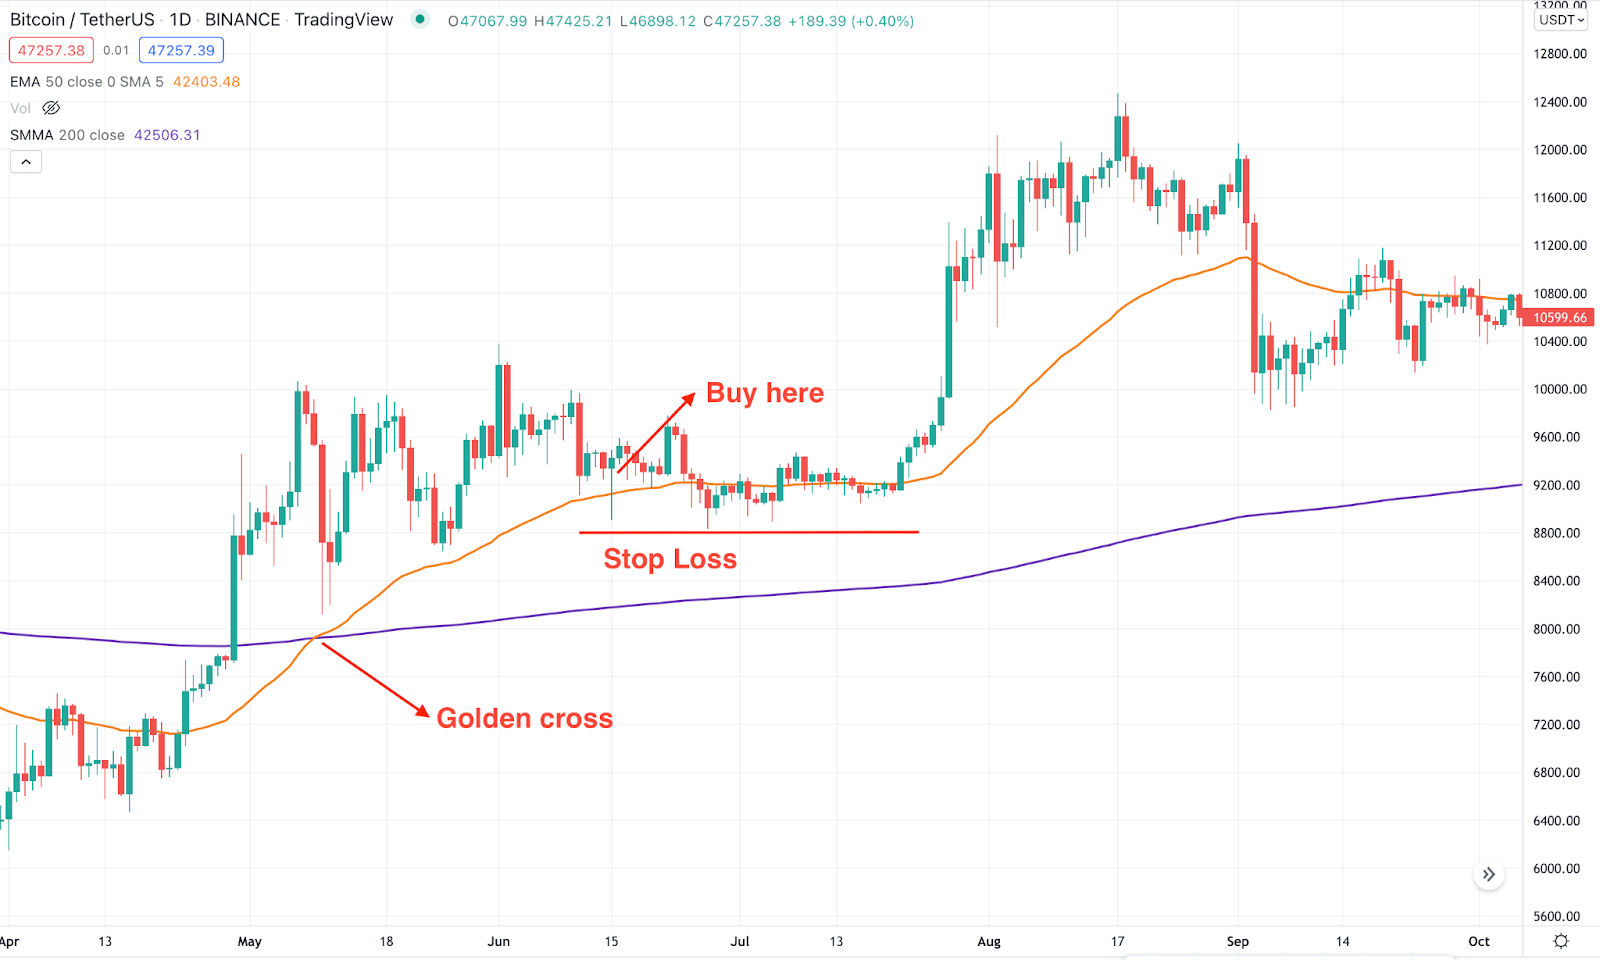
We will use a profitable trading system known as the golden cross in the long-term method. When 50 EMA crosses the 200 SMA, it indicates that short-term traders became aggressive, meaning a buying opportunity.
Bullish trade scenario
It is a combination of EMA and SMA, so traders should set them in the chart before approaching to trade. The buying method measures the potential point where long-term HODLers should enter their position.
Entry
- 50 EMA crosses over the 200 SMA, indicating that short-term bulls became strong while long-term bulls are still in the market.
- The price remains above the dynamic 50 EMA, and after a bearish correction, it rejected the 50 EMA.
- The trading entry is valid on the rejection candle, where the trader should open a buy trade after the candle is closed.
Trade management guide
If the price trades above the dynamic 50 EMA, you can consider it a valuable trade. However, a decisive break below the 50 EMA with volatility would be alarming for bulls.
As it is a long-term approach, you can hold the trade for months to get the maximum benefit. However, it is better to read the price action before taking a trading decision.
Bearish trade scenario
The bearish version of the golden cross is known as the death cross where the price should move lower from 200 SMA and 50 EMA.
Entry
- 50 EMA moves below the 200 SMA, indicating that short-term market sentiment turned more bearish than long-term trends.
- The price remains below the dynamic 50 EMA and after a bullish correction, it rejects the bulls from the 50 EMA.
- Open a sell trade once the rejection is completed with a candle close.
Trade management guide
The primary SL is above the entry candle with some buffer, while the conservative approach sets the SL above the 50 EMA. On the other hand, the take profit level is based on near-term resistance and price pressure.
Pros & cons
| Pros | Cons |
|
|
|
|
|
|
Final thoughts
Finally, we have seen the detailed trading mechanism using the EMA indicator and how it is effective in the cryptocurrency market. However, the volatility in the crypto market is higher than in other financial markets that need additional attention in trade management.


