
Some candle types are so popular among financial investors that it becomes easier to make trade decisions by spotting those candles on particular phases of price movements in financial trading.
However, many candles, such as “the hammer” candles, generate different trading signals by appearing in various phases of price movements. This article will discuss all primary info about the hammer candle. Moreover, it also includes trading strategies using this candle type with chart attachments for better understanding.
What is the hammer candle?
It is is a single candle formation that indicates an upcoming bullish pressure on the asset price near any support level. Financial traders also consider this potent during the consolidation phase of the price movement. An ideal hammer candle has long wicks below the body, at least twice the body.
The body can be green or red; the most potent is when the body is green or the bullish hammer. Traders call the same candle a “hanging man” when it is near any resistance level, which signals an upcoming declining pressure.
How to trade using a hammer candle?
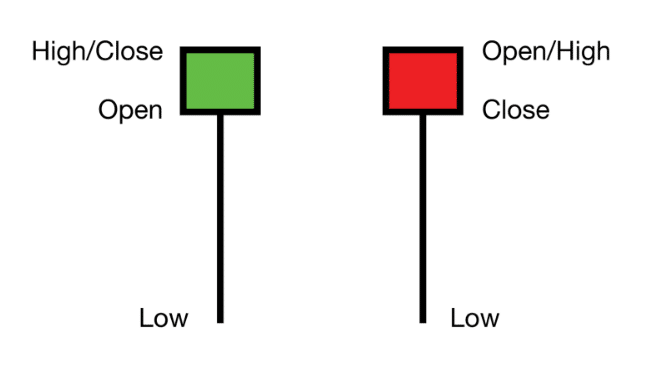
First, it requires understanding the formation of the candle. A bullish hammer candle opens at a specific price then declines as sell pressure increases. Later, buyers take control of the asset price, and the price starts to surge on the upside, and the closing price and the high of the candle are the same. That creates an ideal bullish hammer candle.
On the other hand, the opening price and the high are the same for the bearish hammer candle, and the closing is below, which creates a red body. When the happier candle appears near the finish line of an uptrend, it causes confusion that the price declines more. Meanwhile, buyers may be going to take control. This candle generates both continuation and reversal price movement depending on the market context.
Waiting for the next few candles is wise to confirm the price direction before opening any position. In that case, traders often use technical indicators such as MACD, RSI, ADX, Parabolic SAR, etc., to determine entry/exit positions.
A short-term strategy
Besides candle formation, this trading method contains an EMA crossover concept to generate trade ideas. The EMA crossover concept is simple that involves two or more moving average lines. When the MA with a smaller value crosses above the MA with a larger value indicates a bullish pressure on the asset price and generates a buy signal. Meanwhile, the exact opposite crossover between those MA lines declares a declining pressure on the asset price and generates a sell signal. We use EMA 10 (green) and EMA 30 (red) in this trading method. The preferable time frame is a 15-min chart to catch potential short-term trades for this trading method.
Bullish trade setup
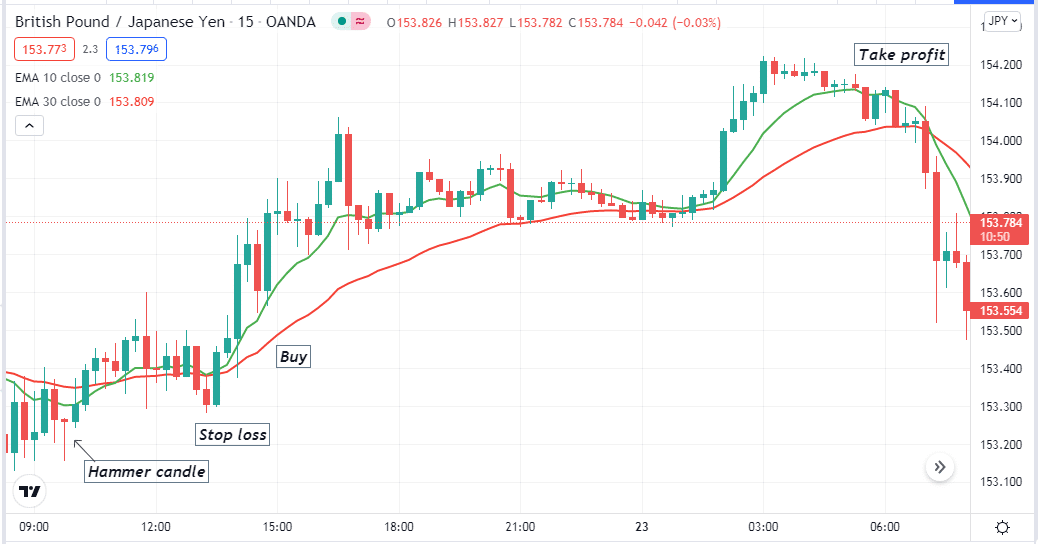
While you seek to place a buy order, spot a hammer near the ending of a downtrend, then observe the EMA lines.
Entry
Enter a buy trade when the green EMA crosses the red EMA on the upside after the hammer candle.
Stop loss
The reasonable stop loss level will be below the bullish momentum and the bullish EMA crossover.
Take profit
Close the buy order when the momentum changes or the green EMA crosses the red EMA on the downside.
Bearish trade setup
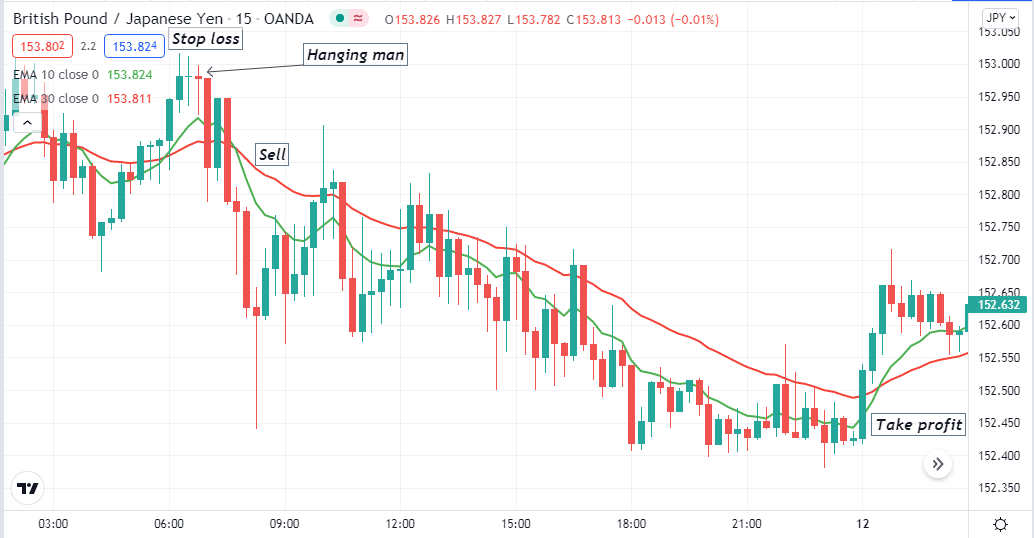
While you seek to place a sell order, spot a hanging man candle near the ending of an uptrend, then observe the EMA lines.
Entry
Enter a sell trade when the green EMA crosses the red EMA on the downside after the hanging man candle.
Stop loss
The reasonable stop loss level will be above the bearish momentum and the bearish EMA crossover.
Take profit
Close the sell order when the momentum changes or the green EMA crosses the red EMA on the upside.
A long-term strategy
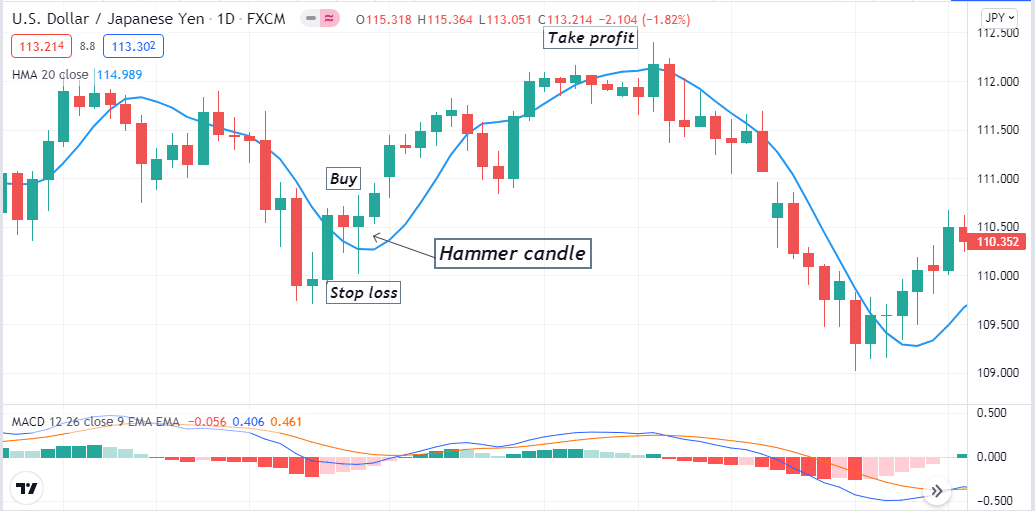
This long-term method contains two technical indicators besides the candle formations. We use the MACD and a Hull moving average value of 20 periods. The HMA line slops upside indicates bullish momentum, and it declares a bearish momentum while sloping on the downside. We recommend using this method on an H4 or above time frame chart to catch the most potent long-term trades.
Bullish trade setup
First, spot a hammer candle near any support level and observe indicator readings when:
- The HMA line starts sloping on the upside.
- The dynamic blue line crosses the dynamic red line on the upside at the MACD window.
- MACD green histogram bars take place above the central line.
Entry
After spotting the hammer candle, match these conditions above and place a buy order.
Stop loss
The initial reasonable stop loss level will be below the current swing low.
Take profit
Close the buy order when the bullish momentum ends. Observe indicator readings when
- The HMA line starts sloping on the downside.
- MACD red histogram bars take place below the central line.
Bearish trade setup
First, spot a hanging man candle near any resistance level and observe indicator readings when:
- The HMA line starts sloping on the downside.
- The dynamic blue line crosses the dynamic red line on the downside at the MACD window.
- MACD red histogram bars take place below the central line.
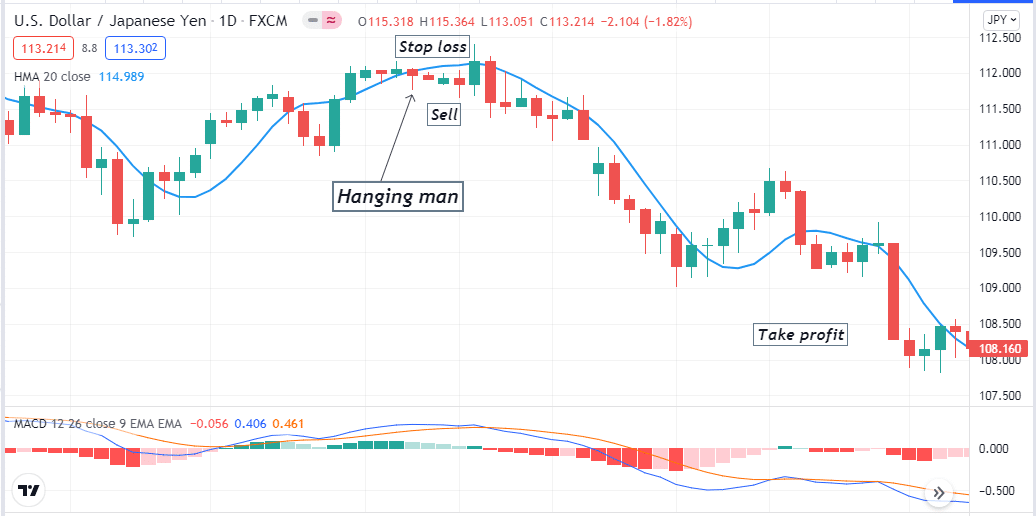
Entry
After spotting the hanging man candle, match these conditions above and place a sell order.
Stop loss
The initial reasonable stop loss level will be above the current swing high.
Take profit
Close the sell order when the bearish momentum ends. Observe indicator readings when
- The HMA line starts sloping on the upside.
- MACD green histogram bars take place above the central line.
Pros & cons
| Pros | Cons |
| Professional traders consider this candle signal while making trade decisions. | This candle generates both continuation and reversal signals. |
| A typical candle that you can spot on many financial assets. | Executing trades using only one candle is not wise. |
| This candle type is easy to identify. | It requires using other technical tools and indicators to get complete trade setups. |
Final thought
In this article, we list all essential info about hammer candles. Now, it is your turn to check the potentiality of this candle formation and strategies by practicing demo trading. We don’t suggest starting live trading by applying any method before mastering that concept.