
Learning to understand candle formation is one of the mandatory parts of the financial market. Successful traders always prioritize candle formations while making trade decisions. The Harami pattern generates acceptable trading signals that market participants and investors follow.
It is not formed very often; it is hardly suitable for the basis of a trading strategy. We recommend that you remember the rules for creating this model and, if necessary, use the chance to enter the market.
Harami is not a win-win candle design. If you trade this pattern, there will be triggered stops and trades closed at breakeven. But if you learn to filter patterns of this type, you will get a reliable tool for making money.
However, as a multi candle pattern, it requires understanding the formation of this pattern to make trade decisions. This article describes the Harami pattern — moreover, successful techniques using it with chart attachments for better understanding.
What is the Harami candlestick pattern?
The price movement leaves footprints through candle formations in the financial market. Candlestick patterns can be single or multi candle formations, including two or more candles. Harami means pregnant in the Japanese language, and they includes two candles that share similarities with the structure of a pregnant woman.
This pattern signals both a continuation and reversal price movement depending on the market context and appearing on different price movements.
Harami patterns are of two types:
- Bullish formation
- Bearish formation
In the bullish formation, the first candle is a sell candle, and the next is a buy candle. The second candle completes formation within the range of the first candle. Meanwhile, there will be a gap between the opening price of the second candle and the closing price of the first candle.
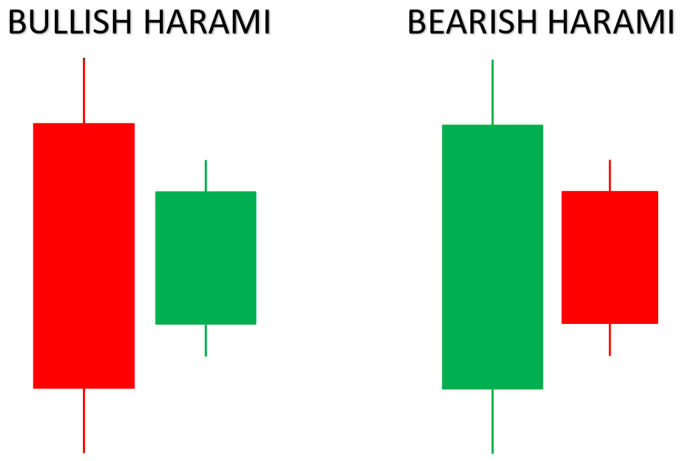
On the other hand, the bearish formation is the exact opposite of the bullish one. A bullish candle initiates the pattern. On the next day, a bearish candle opens with some gap with the closing ice of the previous candle and completes formation within the range of the first candle.
How to trade using a Harami candlestick pattern?
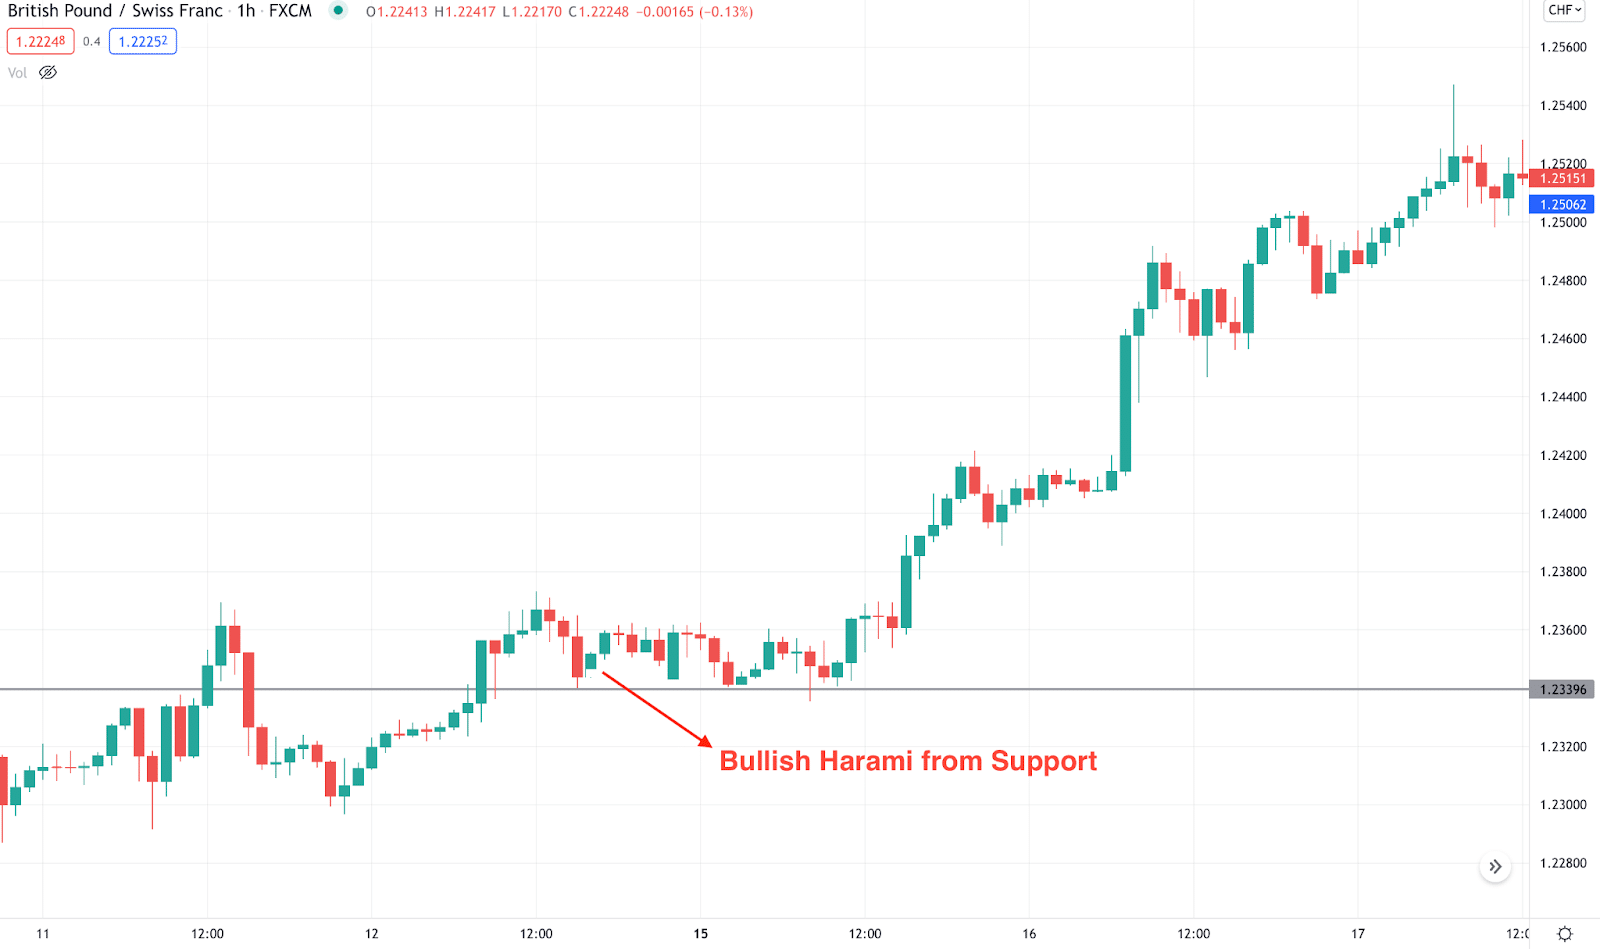
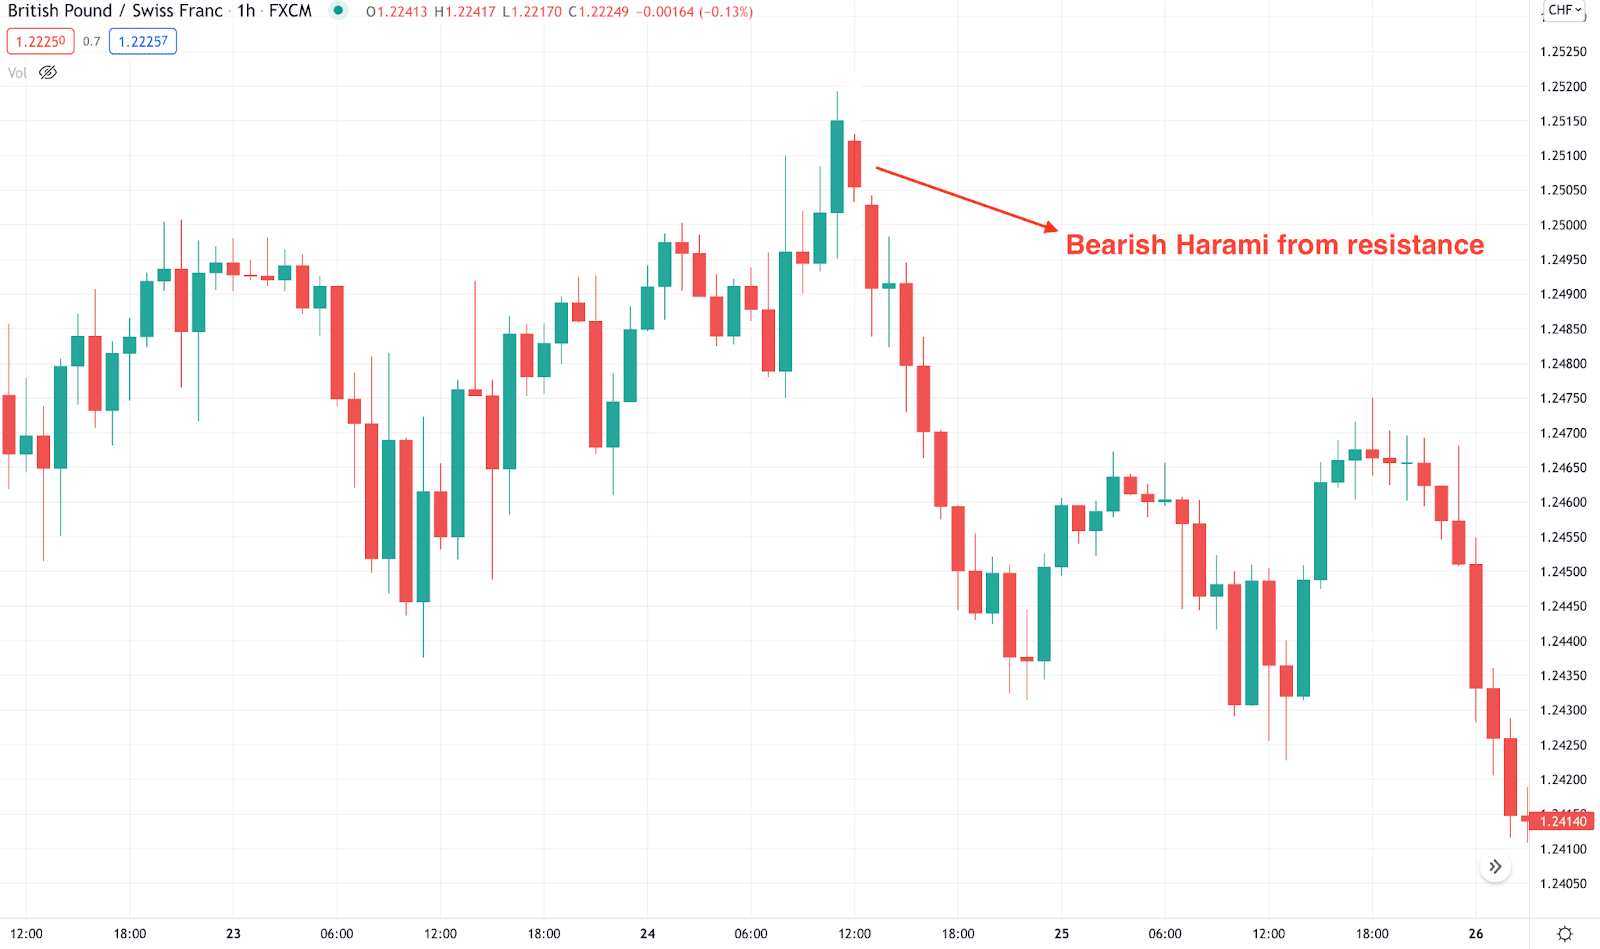
The ideal pattern is rare in the financial market. It is most potent near any support or resistance level where an uptrend or downtrend may end. Still, if you ignore the gap between those two participating candles, you can mark this candlestick pattern frequently on any trading instrument chart.
The first candle is more extensive means it contains sufficient trading activity. So the next smaller candle declares. Although executing trades using these patterns involves some complacency, you can do it by following the steps below.
Step one
Mark any Harami candlestick pattern near any support resistance level. The bullish pattern generates signals for an upcoming bulling pressure on the asset price near support levels. Therefore, the bearish pattern signals a possible decline in asset price by occurring at near resistance levels.
Step two
Combine the market context with the pattern formation using technical indicators. For example, you may use a stochastic oscillator. When you mark a bullish Harami at any support level, and the bullish crossover occurs between the dynamic lines of the stochastic window, it is suitable to open a buy position.
Step three
Determine entry/exit positions by using indicators. Remember, a complete strategy will always suggest entry/exit positions for your trades. In this step, execute trades by following suggestions by your trading method.
Step four
Consider trade and money management rules on your executing trades. So, close trading positions when the market context gains the preferable conditions of your trading techniques.
A short-term trading strategy
It is a straightforward trading technique that suits any trading instrument on time frames between 1min-hourly charts. As this is a short-term trading method, we recommend selecting assets with sufficient volatilities, and the preferable time frame is a 15-min chart. This trading technique involves using an SMA line of 50 periods.
Entry
When opening positions using this trading method, follow the procedures below:
- Mark the bullish or bearish pattern on your chart at the most potent levels.
- After identifying, observe the 50-SMA line. When a bullish Harami occurs, check the price candles are above the SMA line before opening a buy position.
- Open any position only after the complete formation of the pattern. Simply after the closing of the second candle of any Harami pattern.
Stop loss
If you open any position by matching the conditions above, your SL levels will be above or below the range of the first candle. For buy, order place an initial SL below the first candle range and vice versa for a sell order.
Take profit
Close the open positions when the current trend strength fades or the SMA line declares an opposite force on the asset price.
A long-term trading strategy
It is a unique method that is so simple for any market participant who can identify support resistance levels. You can efficiently execute swing trades using this trading technique. We recommend using this method on an H4 or above chart to catch potential long-term trading positions that you may hold for days or even weeks.
Entry
Opening any position using this method involves the following steps below:
- Mark a bullish Harami near the finish line of any downtrend (support level) or a bearish Harami near the finish line on a downtrend (resistance level).
- Open a position when the pattern completes formation and the price breaks above or below the first candle range.
- Open buy position when the price crosses adobe the range of the bullish Harami. Conversely, if the price breaks below the first candle range of the bearish Harami pattern, place a sell order.
Stop loss
Place an initial SL for your executing orders by following the previous trading strategy that suggests above or below the range of the first candle.
Take profit
Continue your trades by observing the market context. You can close your order when the price reaches the next support-resistance level or continue if a valid breakout occurs.
Pros and cons
| Pros | Cons |
| This pattern declares perfect market context. | The ideal pattern is rare. |
| It is a typical pattern on any trading instrument in the financial market. | Requires using other technical indicators to create complete trade setups. |
| Identifying a pattern has no complications. | Trade management using this pattern requires additional attention. |
Final thought
Many traders and investors rely on this pattern as it is helpful to generate trade ideas that have reasonable winning rates. We recommend not making any early entries. Have patience while executing trades using this pattern that you wait till the complete formation besides carefully combining the indicator reading to obtain the most accurate entry/exit positions.